During the collection of remote sensing data, an analysis of satellite images was conducted. The ASTER product was used as starting material. The choice is due to several parameters:
-
Shooting with a spatial resolution of 15 - 90 m;
-
6 bands in the SWIR range;
-
5 bands in the TIR range.
Mineralogical indices and spectral analysis show reliable results in processing.
At the preliminary stage, radiometric calibration and atmospheric correction of remote sensing materials are performed. It requires the creation of a single data set from the VNIR and SWIR ranges.
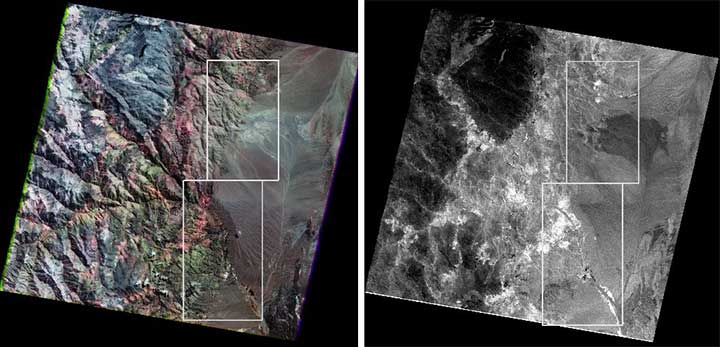
At the first stage, optimal zones for analysis were identified. RGB channel synthesis and spectral indices made it possible to reduce the search area and strengthen the geological features of argillization – phyllitization (Fig. 1).

Figure1 – Synthesized RGB ASTER image. Arcgilic – phylic pink (left), ASTER synthesized spectral image. White Arcgilic – phylic (right).
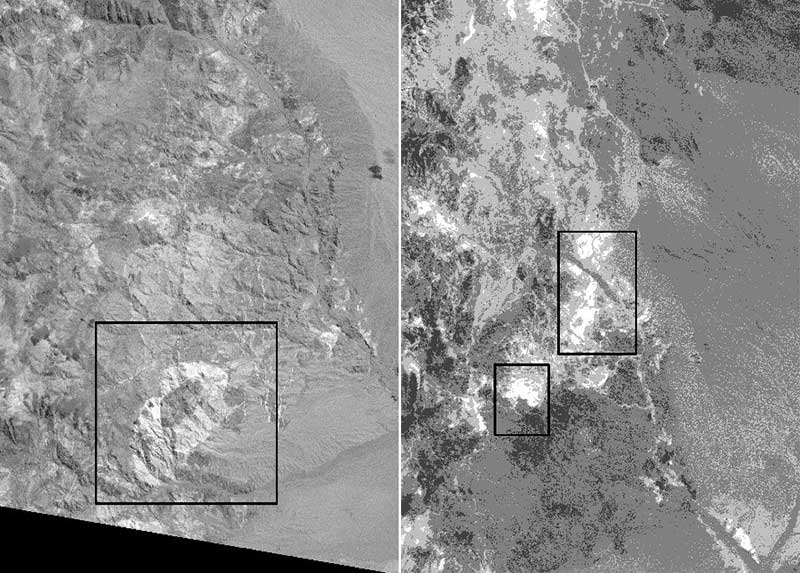
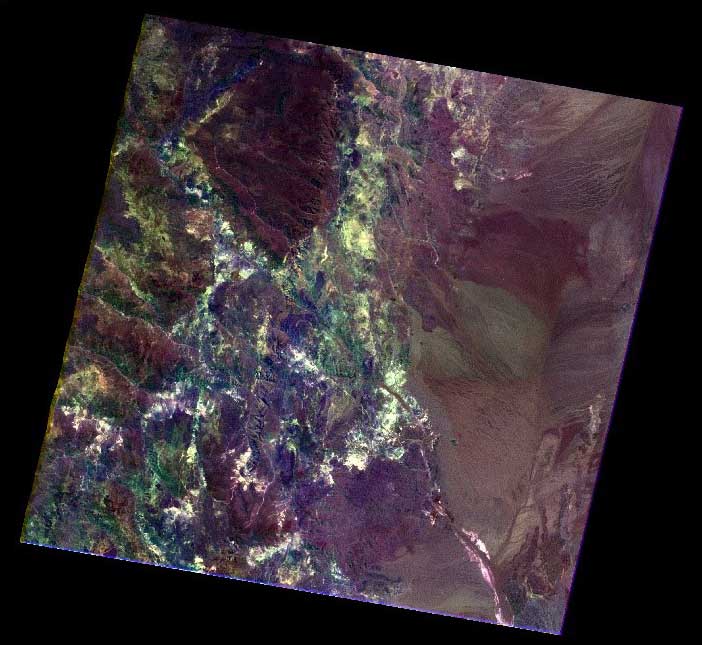
At the second stage, zones of acidic, mafic and sedimentary rocks were identified using mineralogical indices. The combination of VNIR data revealed acidic igneous rocks (Fig. 2). The synthesized channels of the SWIR range exhibit clay deposits / mica with bright (white) pixels in the ASTER scene under study (Fig. 3).

Figure2 – Synthesized image of band2 / band1 ASTER. White color indicates acidic igneous rocks (left); synthesized image band4 / band6 ASTER. White color indicates OH-mineral group (right).

Figure3 – Synthesized composite image RGB ASTER. Hydrothermally modified clays and mica (bluish-white areas).
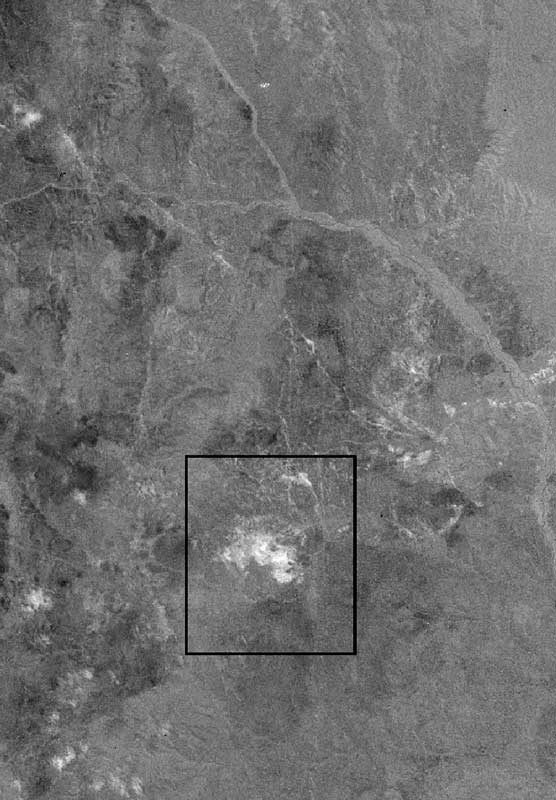
At the third stage, the PCA principal component method was used — it is a reliable statistical method that is used to suppress the dominant radiation effects in all ranges. Principal Component Analysis improves the reflectivity and enhances the differences in geological features of the territory. After evaluating PCA analysis statistics, the 3rd main component allowed detecting small areas with hydrothermal changes (Fig. 4).

Image of the 3rd main component. Bright pixels correspond to hydrothermal changes.
Results
1. Preliminary maps of the allocation of lithological differences and hydrothermal changes in the area.
2. Identified areas of distribution of hydrothermal rocks.
3. Spectral analysis, together with mineralogical and spectral indices, made it possible to isolate the zones of distribution of hydrothermally altered rocks that are promising for the detection of ore objects.
