Thematic maps, RSEI and NDVI indices, monitoring of water, drought and biodiversity from the archive or a new survey.
Search the site
What the service is used for
Environmental mapping
Compilation of georeferenced environmental information: natural-territorial complexes and anthropogenic factors.
Environmental condition monitoring
Measurement of environmental condition up to the global scale and identification of anthropogenic factors.
Decisions and ESG
Rapid assessment of spatial-temporal patterns of environmental vulnerability for environment protection.
RS archives and RSEI
An image archive for retrospective analysis and calculation of terrestrial system health indicators.
Biodiversity and drought
Structural measurements of ecosystems; monitoring of arid territories (~45% of the globe).
Need environmental monitoring?
Describe the territory and the task. A specialist will select the RS archive and the set of thematic maps.
What you will receive as a result of the work
01
Environmental mapping
Compilation of georeferenced environmental information: natural-territorial complexes and anthropogenic factors.
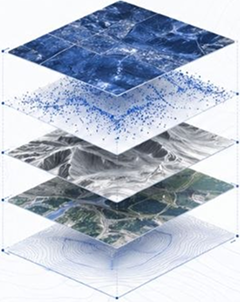
Maps for a state or a region are convenient for analysis and comparison: biodiversity, pollution, resources, climate and disaster risks. We combine RS data and environmental indicators into georeferenced thematic maps. Indices for assessing the state and dynamics of the environment may be calculated per the terms of reference..
What you get
- environmental maps and GIS layers for the agreed territory
- the RSEI index or other environmental indicators if they are included in the ToR
- materials for planning and sustainable development
The map set, survey dates and the set of indices are fixed in the terms of reference; archive availability and cloud cover affect coverage.
02
Environmental condition monitoring
Measurement of environmental condition up to the global scale: anthropogenic factors and the impact of management methods.
Satellite monitoring is thematic analysis of images in different frequency ranges. Radiometers of modern constellations provide geophysical information for environmental assessment and disaster prevention. Monitoring is conducted by ground-based and aerospace methods.
What you get
- environmental assessment from the archive or a new survey
- identification of anthropogenic variability factors
- materials for decisions on environment protection and green development
Frequency, resolution and the set of bands depend on the task and scene availability.
03
Water, algal blooms and pollution
Optical sensors in the visible and IR ranges track water colour and turbidity, discharges and leaks.
Optical data in the visible and IR ranges make it possible to analyse water colour and turbidity, detect algal accumulations and track changes in water-surface pollution.
What you get
- maps of colour, turbidity or algal accumulations
- layers of air, water and soil pollution
- comparison of periods from the available archive
04
Drought, biodiversity and emergencies
Monitoring of arid and semi-arid ecosystems (~45% of the globe), biodiversity and hazardous natural processes.
Images are used to assess soil moisture, water resources, vegetation, biomass and surface temperature. RS is applied to forests, fires, land use, coastal ecosystems, permafrost and air quality. From RS data we assess vegetation condition, moisture, water resources and surface temperature, as well as ecosystem change and hazardous natural processes.
What you get
- layers of vegetation, moisture and temperature condition
- materials on biodiversity and ecosystem hierarchy if included in the ToR
- identification of avalanche, debris-flow and glacier-surge characteristics for the agreed dates
The promptness of scene delivery depends on the operator and cloud cover.
05
RS archive and indices
An image archive for retrospective analysis and calculation of terrestrial-system health indicators, including RSEI.
We select archival and new images to analyse territory changes over time. Per the terms of reference, NDVI, NDWI, SAVI, EVI, LST and other thematic indices may be calculated..
What you get
- selection of the archive and a new survey for the analysis period
- calculation of the agreed indices from multispectral data
- a basis for monitoring ecosystem health and ESG indicators
The available retrospective depth is determined by the territory, sensor and the availability of suitable archival data.
How the work goes
Real projects — real results
We solve complex challenges using advanced technologies and expertise in geospatial data.




Cost and timeline
The cost and timeline of environmental monitoring depend on the territory, observation period and the set of maps and indices.
- area and task: environmental mapping, environment monitoring, biodiversity, pollution, drought, city or water area
- data type: satellite imagery, UAV and ground sensors; archive or new survey
- period: operational monitoring or retrospective analysis for the required dates
The cost of the work is calculated individually
Timelines depend on the area, survey type and product composition
We will agree the final estimate after the territory and map set are described
What is needed for a quote
To agree the terms of reference for environmental monitoring, provide:
- task: mapping, environmental assessment, pollution, biodiversity, drought, city, forest, water or emergencies
- area of interest — outline, region, water area or SHP file
- period: operational control or a retrospective
- whether you have your own images or need archival / new satellite imagery, UAV and ground sensors
- whether RSEI, NDVI, NDWI, SAVI, EVI, LST, FCA indices or risk maps are needed
- requirements for the format of maps and layers, if they are already known
If survey parameters have not been set yet, describing the territory and the goal is enough — specialists will propose the RS data composition.
Describe the outline and the task — we will clarify the archive, new survey and the set of maps.
Why Innoter
Prompt access to archives
Suitable archive imagery can be obtained faster when the required area and date are already available from operators.
No aviation clearances
A new satellite survey does not require the flight clearances typical of aerial surveys.
Large and remote areas
A single satellite pass covers large areas and makes it possible to work in hard-to-reach regions.
Direct agreements with operators
Distribution agreements help select archive imagery and order new surveys from different providers.
Software and server infrastructure
Modern software and computing capacity for quality control and processing of large data volumes.
Experienced specialist team
Years of experience on complex projects and specialists in cartography, photogrammetry and remote sensing.
RS data, indices and monitoring scope
The composition depends on the territory, archive or new survey, indices and map requirements.
1
Ecology is the study of relationships between living organisms, including humans, and the physical environment. The global economy implies strict environmental standards; the trend toward environmental sustainability by the beginning of the third decade of the 21st century is called stable. Ecology comprises 30+ directions (disciplines).
Industrial ecology studies the systemic relationships of society, the economy and the natural environment: technologies for reducing impact, accounting for socio-economic factors. Analysis of the use and circulation of materials and energy — from eco-industrial parks and cities to countries and the global economy.
Ecosystem services are functions of natural systems that benefit humans for free: pollination, flood control, carbon storage, biodiversity and recreation. To control impact on the biosphere, environmental monitoring has been used since the late 20th century: comprehensive observations, assessment and forecast.
2
Monitoring is classified by location relative to the environment, purpose of use, type of negative factor and the location of the analysis system. Work is carried out by ground-based and aerospace methods.
Satellite environmental monitoring is the most accurate, cost-effective and informative: thematic analysis of images from instrument complexes in various frequency ranges. Radiometers of modern constellations provide comprehensive geophysical information.
Over the past 20 years RS methods have been applied more widely in ecology: satellite data and tools, UAVs and ground sensors have become more accessible. Spectral analysis measures the electromagnetic radiation of objects; unique spectral characteristics are used to identify materials.
3
Basic tasks: environmental mapping; measuring environmental condition up to the global scale; support for decisions on environment protection and green development; RS archives for retrospectives and RSEI; spatial-temporal aspects of biodiversity; ecosystem hierarchy; combining field assessments with RS; monitoring of arid and semi-arid ecosystems (~45% of the globe) — water supply, biodiversity, flood protection, food security, carbon storage and sequestration.
Detailed community tasks for the coming years: forest management and biodiversity; soil and water pollution, land degradation; meteorological characteristics; large fires and forest-fire prevention; land use (LULC) and forestry; machine learning in marine ecology; urban socio-ecological systems; field water monitoring from UAV to satellite; coastal ecosystems; permafrost; landscape ecology; ecophysiology and agriculture; AI for environmental quality (EEQ); air pollution.
4
RS datasets provide large-scale spatial and temporal approaches to measuring ecosystems at different levels. Sustainable development goals (ESG) are linked to biosphere quality indicators.
The effectiveness of RS in assessing land degradation has been proven: vegetation and soil cover, productivity, above- and below-ground carbon stocks. RS methods link environmental information between small and large scales — a fundamental problem of landscape ecology.
They determine the spatial-temporal heterogeneity of environmental condition in large agglomerations and the links with LUCC. Independent analysis of changes on a site is possible with a depth of more than 20+ years thanks to the archive of RS materials.
Frequently asked questions
Answers to key questions about service parameters, timelines, deliverable formats and workflow. If you did not find what you need — contact us and we will help.
Environmentalists often use remote sensing to study the environment and ecological processes. Remote sensing is a method of collecting information about objects on Earth using sensors on satellites, airplanes, or other platforms. It provides data on various aspects of the environment such as surface temperature, vegetation, air and water pollution, deforestation, changes in land use, and other parameters.
One of the most common remote sensing tools is spectral analysis, which is based on the measurement of electromagnetic radiation reflected or emitted by objects on Earth. Different materials and objects have unique spectral characteristics that can be used to identify and analyze them.
Ecologists can use remotely sensed data for a number of purposes. For example, they can study changes in the distribution and condition of ecosystems to assess the impact of climate change or anthropogenic activity. Also, remote sensing can monitor and predict the spread of natural disasters such as forest fires, floods or droughts.
Remote sensing data can be used to monitor and assess the quality of water resources, including lakes, rivers and oceans. Ecologists can analyze data on water temperature, suspended solids, phytoplankton and other parameters to assess the health of aquatic ecosystems and identify potential pollution problems.
In addition, remote sensing can be used to assess changes in land use and vegetation. Using vegetation index data, ecologists can identify areas of deforestation, agricultural expansion or changes in vegetation cover due to climate change or natural disasters. This allows the impact of such changes on the biodiversity and ecological resilience of a region to be assessed.
Remote sensing can also be a useful tool for monitoring and protecting species and their habitats. Ecologists can use data on the distribution and changes in animal and plant populations to identify trends and prioritize areas for protection and management.
In general, remote sensing is a powerful tool for environmental research and monitoring. It provides information on the state of the environment over large areas and under various conditions. Analysis of remote sensing data helps ecologists to obtain a more complete and objective understanding of ecosystems and the processes occurring in them, which contributes to the development of effective management and conservation strategies.
Remote sensing offers a wide range of applications in ecology. Here are a few examples:
- Monitoring changes in vegetation and forest cover: Remote sensing data allows tracking changes in vegetation and forest distribution over time. This can be useful for assessing overall ecosystem health, detecting deforestation, identifying areas of vegetation regeneration, and evaluating the impact of climate change on plant cover.
- Assessing water quality: Remote sensing enables the monitoring of water parameters such as temperature, transparency, phytoplankton concentration, and pollutants. This helps ecologists evaluate water ecosystem quality, identify pollution areas, and take measures to protect water resources.
- Studying climate change and its impact on ecosystems: Remote sensing allows the analysis of climate variables such as air temperature, precipitation, and humidity across the planet. This helps researchers understand the effects of climate change on ecosystems and predict possible consequences.
- Monitoring and protecting species: Remote sensing data can be used to monitor populations of various species and their habitats. This enables researchers to determine trends in species distribution and population dynamics, identify vulnerable areas, and develop conservation strategies.
- Predicting and monitoring natural disasters: Remote sensing helps in predicting and monitoring natural disasters such as wildfires, floods, droughts, and landslides. This allows for timely measures to protect people and ecosystems and assess the environmental impact of such disasters.
These are just a few examples of remote sensing applications in ecology. With the continuous development of remote sensing technologies and the increasing availability of large datasets, ecologists can apply them in many other fields:
- Assessing the impact of human activities: Remote sensing can be used to study the effects of various human activities on the environment. For example, it can analyze land-use changes, detect unauthorized construction, monitor air and water pollution, and track infrastructure and industrial facility modifications.
- Studying and monitoring marine and coastal ecosystems: Remote sensing allows for the study and monitoring of marine and coastal ecosystems, such as coral reefs, mangrove forests, and seawater conditions. This helps identify biodiversity zones, track changes in marine ecosystems, and assess the impact of global climate change on oceanic resources.
- Forecasting and managing resources: Remote sensing can be used for forecasting and managing various natural resources. For example, it can analyze forest area and quality data to support sustainable forestry planning or assess vegetation data to identify the most suitable locations for agricultural land.
- Studying and monitoring ecosystems in remote and inaccessible areas: Remote sensing enables the study of ecosystems in remote and hard-to-reach areas where direct access is limited or hazardous. This is particularly useful for studying wildlife, Arctic regions, mountainous areas, and tropical rainforests.
- Evaluating the effectiveness of environmental programs and policies: Remote sensing provides objective data for assessing the effectiveness of environmental programs and policies. It can analyze environmental parameters before and after implementing specific measures to determine their impact and efficiency. For example, it can track land-use changes following ecosystem restoration programs or assess the effects of protected area conservation on biodiversity.
All these applications of remote sensing help ecologists obtain detailed information about the state of the environment at different scales—from local to global. They contribute to more accurate analysis, forecasting, and planning in nature conservation and sustainable resource use. Combining remote sensing data with other research methods allows ecologists to gain a comprehensive understanding of ecosystem functions and their interactions with human activities.
Ecology has a significant impact on the world, people, and animals:
-
Sustainable resource use: Ecological research helps determine optimal ways to use natural resources while ensuring their renewability and minimizing negative environmental impacts. This includes assessing the effects of industrial and agricultural activities, developing effective energy-saving methods, and managing waste efficiently.
-
Food security: Ecological studies allow for the analysis of agro-ecosystem conditions and their influence on food production. Research on pesticides, genetically modified organisms, soil treatment, and other factors helps develop sustainable agricultural methods that ensure food safety and quality.
-
Pollution and health: Ecological research helps analyze the effects of environmental pollution on human and animal health. It enables scientists to identify and study various pollutants, their sources, and their distribution, as well as develop strategies to reduce risks and protect public health.
-
Biodiversity: Ecological studies contribute to understanding the importance of biodiversity and its connection with ecosystems. They help identify threats to biodiversity, including species extinction, habitat loss, and climate change, and develop measures for conservation and biodiversity restoration.
-
Environmental education and awareness: Ecology plays a crucial role in shaping environmental awareness and consciousness. Through education and information campaigns, ecological research helps improve understanding of the interconnection between humans and the environment, while also drawing attention to the need for sustainable resource use, nature conservation, and environmentally responsible decision-making.
-
Environmental disasters and their consequences: Ecological research helps analyze the causes and effects of environmental disasters such as oil spills, water pollution, wildfires, and other catastrophes. This enables the development of prevention and response measures to minimize damage to ecosystems and society.
-
Environmental policies and legislation: Ecological studies provide a scientific foundation for developing environmental policies and regulations. They help establish priorities for environmental protection, set air, water, and soil quality standards, and define waste collection and disposal requirements. This contributes to creating a sustainable and environmentally responsible resource management system.
Overall, ecology plays a crucial role in understanding and managing interactions between people, animals, and the environment. It helps minimize the negative impact of human activities on nature, ensures ecosystem sustainability, and promotes the well-being and health of all living beings.
The use of Earth Remote Sensing (ERS) plays a crucial role in monitoring arid ecosystems. ERS enables the collection of information about the Earth's surface using satellites and other aerospace platforms. In the case of droughts, ERS can be a valuable tool for determining the severity and extent of drought conditions, as well as monitoring changes in vegetation, water resources, and soil conditions.
Here are some ways ERS can be used to monitor arid ecosystems:
-
Soil moisture measurement: Satellites equipped with radar and microwave sensors can measure soil moisture over vast areas. Changes in soil moisture levels can indicate the presence of drought conditions.
-
Water resource measurement: ERS can be used to assess changes in water levels in bodies of water, including rivers, lakes, and reservoirs. Comparing data over different time periods can reveal trends in water resource depletion due to drought.
-
Vegetation monitoring: Analyzing changes in vegetation cover using multispectral imagery can help detect droughts. Drought can lead to a decline in green biomass, which will be visible in spectral data.
-
Changes in biomass: Using ERS to assess changes in plant biomass can help identify arid areas where vegetation has become less dense.
-
Temperature data analysis: ERS can also assist in monitoring temperature changes on the Earth's surface. Arid areas tend to heat up faster due to a lack of water, which can be detected through thermal imaging.
-
Assessment of extreme drought areas: By analyzing satellite imagery, it is possible to evaluate areas where drought has the most severe impact. This helps focus drought mitigation efforts on the most critical regions.
-
Drought forecasting: Analyzing time-series ERS data can aid in developing drought prediction models and assessing their intensity based on historical records.
For more precise and effective monitoring of arid ecosystems, it is recommended to combine ERS data with local observations and climate information.
Monitoring of semi-arid ecosystems can also be carried out using Earth Remote Sensing (ERS). These ecosystems are situated between more humid and arid regions and are often subject to changes in water resource availability and climatic factors. Here is how ERS can be used to monitor semi-arid ecosystems:
-
Water resource analysis: Monitoring water levels in rivers, lakes, and other water bodies using ERS can help identify changes in water availability. Variations in water levels can indicate shifts in climate and water balance.
-
Soil moisture measurement: Changes in soil moisture can affect vegetation health and the overall ecosystem. Satellite data measuring soil moisture can help identify areas experiencing water balance deterioration.
-
Vegetation monitoring: Changes in vegetation related to water availability and climatic factors can be detected through multispectral data analysis. Satellite images from different time periods can reveal trends in vegetation development.
-
Study of climatic parameters: ERS can provide data on temperature, atmospheric conditions, and precipitation, helping to understand which climatic factors influence semi-arid ecosystems.
-
Identification of threats and vulnerabilities: ERS can help detect areas at risk of potential threats such as wildfires, desertification, and soil degradation. This enables the development of resource management strategies.
-
Forecasting ecosystem degradation: Analyzing ERS data in combination with climate data and vegetation changes can help predict future changes in semi-arid ecosystems and take measures for sustainable management.
-
Data integration: Effective monitoring of semi-arid ecosystems requires a comprehensive approach that integrates ERS data, meteorological data, geographic information, and local observations.
The use of ERS in monitoring semi-arid ecosystems enables the timely detection of changes and responses to them, contributing to the sustainable development of these vulnerable regions.
The Remote Sensing Ecological Index (RSEI) is a numerical metric derived from data obtained through Earth Remote Sensing (ERS). This index is used to assess the ecological state or specific aspects of an ecosystem, such as vegetation, water resources, soil, and other environmental factors.
Depending on the goals of monitoring and analysis, there are numerous ecological indices developed to measure various aspects of the environment. Below are some examples of ecological indices that can be derived from remote sensing data:
-
Normalized Difference Vegetation Index (NDVI): This index measures green biomass and the overall health of vegetation in a given area. NDVI is calculated based on the difference between reflected light in the near-infrared and visible spectral ranges. It is widely used for monitoring vegetation health, assessing wildfire-affected areas, identifying drought conditions, and detecting soil degradation.
-
Normalized Difference Water Index (NDWI): This index is used for monitoring water resources. It measures the water content in plants and soil, helping to assess moisture levels and water availability.
-
Soil Adjusted Vegetation Index (SAVI): SAVI accounts for background illumination and enables more accurate assessment of vegetation and soil conditions on land.
-
Enhanced Vegetation Index (EVI): This index is designed for a more precise evaluation of vegetation, considering atmospheric conditions and aerosol effects.
-
Land Surface Temperature (LST): Measuring land surface temperature using ERS can provide insights into climatic conditions and thermal changes, which are crucial for assessing the impact of climate change on ecosystems.
These indices and metrics can be applied to analyze various aspects of ecological systems, allowing for more effective monitoring, measurement, and comparison of environmental changes across large areas using ERS data.
Environmental mapping is the process of creating maps and Geographic Information Systems (GIS) aimed at studying and visualizing environmental parameters and processes. It plays a crucial role in understanding the interactions between nature and humanity, as well as in developing strategies for sustainable development.
Here are some key aspects of environmental mapping:
-
Studying biodiversity: Creating maps that reflect the distribution of various species of plants, animals, and microorganisms helps scientists and decision-makers more effectively manage natural resources and prevent biodiversity loss.
-
Monitoring pollution: Maps can visualize the distribution of air, water, and soil pollution. This allows for tracking and assessing the extent of environmental impact on specific areas and taking measures to improve environmental quality.
-
Managing natural resources: Environmental maps help plan and manage the use of natural resources such as forests, water bodies, and soils. They assist in making informed decisions to balance human needs and nature conservation.
-
Studying climate change: Mapping can be used to track climate changes and their impact on ecosystems and human activities. This is essential for developing strategies to adapt to climate change.
-
Assessing natural disaster risks: Creating maps of natural disaster risks, such as earthquakes, floods, and wildfires, helps identify vulnerable areas and develop measures to mitigate the consequences of such events.
Environmental mapping involves the use of modern technologies such as satellite imaging, remote sensing, Geographic Information Systems, and geoinformation technologies to create accurate and informative maps that support scientific and practical research in environmental protection.
Environmental assessment is the process of analyzing and measuring the state of the environment, including air, water, soil, fauna, and flora, to determine the level of pollution and the sustainability of ecosystems. This assessment can be conducted at various levels, from individual sites to vast territories, and covers different aspects of the environment.
The main stages of environmental assessment include:
- Data collection: Data on air, water, soil quality, biodiversity, climate, and other environmental parameters are gathered. This may include the use of monitoring stations, remote sensing, biota surveys, and other data collection methods.
- Data analysis: Collected data is analyzed to identify patterns, trends, and anomalies. This may involve assessing pollution levels, climate changes, biodiversity levels, and other environmental parameters.
- Risk assessment: An evaluation is conducted to determine the risks to human health and ecosystems due to environmental changes. This may include assessing the impact of pollutants on humans as well as investigating potential consequences for fauna and flora.
- Development of improvement strategies: Based on the analysis results, strategies and recommendations for improving the environment are formulated. This may include proposals for reducing emissions, restoring ecosystems, implementing sustainable practices, and other measures.
- Monitoring and updates: Environmental assessment is an ongoing process that requires constant monitoring and data updates. This allows for tracking the effectiveness of implemented measures and making adjustments to environmental management strategies.
Environmental assessment plays a crucial role in sustainable development, enabling informed decision-making to preserve nature, improve quality of life, and prevent negative impacts on human health and natural ecosystems.
Monitoring arid ecosystems is crucial for understanding environmental changes, effectively managing resources, and developing adaptation strategies to climate change. Drought has a significant impact on soil, vegetation, water resources, and wildlife, and its monitoring helps identify threats and develop strategies for the sustainable use of natural resources. Here are some key aspects of arid ecosystem monitoring:
1. Precipitation measurement: One of the important monitoring parameters is the amount of rainfall. This helps assess how arid the conditions are and what changes are occurring in the climate.
2. Water level monitoring: Tracking water levels in rivers, lakes, and groundwater is essential for determining the water balance and identifying drought periods.
3. Soil condition analysis: Studying soil properties, its moisture content, and structure helps determine the degree of drought and predict potential consequences for vegetation and agriculture.
4. Vegetation monitoring: Utilizing modern technologies such as satellite imaging and remote sensing to track changes in vegetation. This includes assessing plant health, vegetation density, and soil cover changes.
5. Impact on biodiversity: Monitoring the effects of drought on local plant and animal species. This involves assessing threats to biodiversity and implementing conservation measures.
6. Impact assessment on agriculture: Studying the effects of drought on agriculture, including crop yields, soil quality, and plant diseases.
7. Development of adaptation strategies: Based on monitoring data, adaptation strategies to drought are developed, including improving water management systems, implementing efficient irrigation methods, and other measures.
Monitoring arid ecosystems is a key component of risk management and maintaining resilience in a changing climate.
An environmental index is a quantitative measure used to assess the state of the environment, the level of pollution, ecosystem sustainability, or quality of life. These indices combine various parameters into a single numerical value to facilitate comparison and analysis.
Depending on the specific objectives and context of the assessment, different environmental indices may be used. Here are several examples of environmental indices:
- Air Quality Index (AQI): Evaluates air pollution levels based on several parameters such as oxygen, nitrogen, carbon dioxide concentrations, fine particles, and other harmful substances.
- Water Quality Index (WQI): Assesses water pollution levels based on parameters such as chemical composition, bacterial content, dissolved oxygen levels, and other factors.
- Biodiversity Index: Measures species diversity in a specific region, taking into account factors such as species count, distribution, and population health.
- Sustainable Development Index: Evaluates how well a specific area or society implements sustainable development principles, considering social, economic, and environmental factors.
- Soil Pollution Index: Assesses soil contamination levels by measuring toxic substances, heavy metals, and other pollutants.
- Urban Environmental Quality Index: Measures the quality of the urban environment, considering factors such as air quality, noise levels, green spaces, and access to eco-friendly services.
Environmental indices provide simple and understandable metrics that can be used for decision-making in environmental protection and sustainable development. They also serve as tools for monitoring changes over time and evaluating the effectiveness of environmental programs and initiatives.
The Remote Sensing Environmental Index uses data obtained via satellites or other remote sensing methods to assess environmental conditions. These indices provide quantitative metrics that reflect various environmental aspects, such as water quality, vegetation health, air pollution, and more.
Here are some examples of environmental indices based on remote sensing:
- Normalized Difference Vegetation Index (NDVI): Measures the activity of photosynthesizing vegetation. Higher NDVI values indicate healthier and denser vegetation.
- Enhanced Vegetation Index (EVI): Similar to NDVI but accounts for atmospheric effects, making it more accurate in assessing vegetation health.
- Water Quality Index (WQI) based on water color data: Remote sensing can be used to assess water color, which may indicate water quality. Indices such as the Water Quality Index can incorporate these data.
- Urban Heat Island Index: Measures the temperature difference between urban and suburban areas based on thermal radiation data obtained through infrared remote sensing.
- Air Quality Index (AQI) using pollutant concentration data: Remote sensing can provide data on the concentration of various pollutants in the atmosphere, which can then be used to calculate air quality indices.
- Land Cover Index: Uses land use data obtained via remote sensing to assess changes in land cover and their impact on ecosystems.
These indices enable the monitoring of environmental parameters over large areas in real time, making them valuable tools for environmental management and assessment.
Need satellite imagery or help choosing the right data?
Describe your task, area of interest, and desired outcome. We will check data
availability, assess new acquisition options, and propose the optimal solution in terms of timelines, cost,
and quality.
Discuss the project
clients who trust us
25+ years in the geodata market