Monitoring — a system of observing processes, assessing the situation in the environment and society. During this process, an assessment of a phenomenon or event is made, depending on the impact of numerous factors.
Elements of the monitoring system
- Monitoring the effectiveness of interventions.
- Observing changes in sectors of human activity and the environment as a whole.
- Analyzing and integrating the results of monitoring.
To facilitate the monitoring process, people have devised the process of remote sensing.
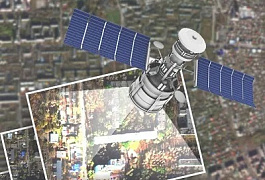
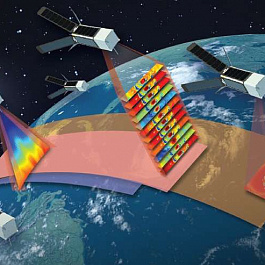
Remote sensing is the process of detecting and monitoring the physical characteristics of an area and the objects within it by measuring its reflected and emitted radiation from a distance (usually from a satellite, aircraft, or UAV). Special camera sensors collect remote sensing images across a wide electromagnetic spectrum, with both overview and detailed characteristics, in a time series, which help researchers analyze the situation on Earth.
Types of Remote Sensing
The types of remote sensing can be classified based on various criteria that reflect their applications and technologies. One of the main ways to classify them is by the ranges of electromagnetic radiation, such as visible light, infrared and ultraviolet radiation, microwaves, and radio waves. Additionally, remote sensing types can be divided into active and passive, depending on whether the system uses its own radiation source or records reflected radiation. There is also a classification based on the type of platform on which the sensing sensors are mounted, such as satellites, unmanned aerial vehicles (drones), or balloons. Each of these types has its own features and provides valuable information for a wide range of applications, from monitoring climate changes and the environment to urban development planning and agriculture.
1. Optical Sensing:
- Features: Uses the visible and infrared spectrum to obtain images of the Earth.
- Advantages: Provides high spatial resolution, allows for detailed images of the surface.
2. Thermal Sensing:
- Features: Measures the thermal radiation of the surface to analyze temperature characteristics.
- Advantages: Allows detecting temperature changes, identifying hotspots (including oil leaks), and is useful for monitoring the thermal state of objects.
3. Radar Sensing:
- Features: Uses the radio range of electromagnetic waves to image the surface, penetrates clouds, and operates in various weather conditions.
- Advantages: Provides the ability to work in low light or adverse weather conditions, detects changes in terrain and surface structure.
4. Hyperspectral Sensing:
- Features: Measures reflected or emitted electromagnetic radiation in discrete wavelengths across a wide spectrum with small bands.
- Advantages: Allows obtaining spectral characteristics of objects over a wide spectrum range, provides high capability for distinguishing surface types and materials.
There are also other categories of remote sensing.
Passive Method
In passive sensing, measurements are made using the radiation emitted from Earth's surface objects, thus not requiring the use of a radiation source in the necessary part of the spectrum.
Active Method
In active sensing, the system uses its own radiation source to illuminate the Earth's surface and then records and analyzes the signal returned from the objects.
For example, RADAR and LiDAR sensors are typical active remote sensing instruments that measure the time delay between emission and return to determine the location, direction, and speed of an object. The collected remote sensing data is then processed and analyzed using remote sensing equipment and computer software (the most sophisticated solutions are analytical products presented in near real-time), which are available in various applications, primarily in geographic information systems (GIS).
Types of Sensing:
1. Satellite Sensing:
- Includes the use of space vehicles to recognize objects on the Earth's surface, weather conditions, and other parameters.
- Capabilities: Used for large-scale research, monitoring, mapping, and other applications.
2. Aerial Photography:
- Based on using a camera mounted on an airplane, helicopter, or other manned aircraft to capture images of the Earth's surface from flight altitude.
- Application: Used in geography, cartography, scientific conditions, and in searching for human factors in remote areas.
3. UAV Photography:
- Specialized devices that allow for aerial photography without a person on board.
- Application: Used in monitoring fields, forests, and forest-industrial areas for safe and efficient problem recognition. Offers the highest spatial resolution.
For example, the summarized characteristics of the most in-demand remote sensing data sources on the market today are shown in Table 1.
| Parameters | Satellite | Aerial Photography | |
|---|---|---|---|
| Manned Aviation | Unmanned Aerial Vehicles | ||
| Optimal survey area | >100 km2 | 50-1000 | <100 km2 |
| Sensors | Multispectral | Multispectral | Multispectral |
| Hyperspectral | Hyperspectral | Hyperspectral | |
| Thermal | Thermal | Thermal | |
| Radar | Radar | Radar | |
| LIDAR | LIDAR | LIDAR | |
| Spatial resolution | 0.25 m to 10 m | 0.1 m to 1.5 m | 0.02 m to 1 m |
| Cost of an image area (USD) | |||
| 1 km | - | - | 200 |
| 5 km | - | - | 500 |
| 25 km | 200 | - | 1,250 |
| 50 km | 500 | 6,250 | 1,750 |
| 100 km | 1,000 | 10,000 | 3,000 |
| 1000 km | 10,000 | 40,000 | - |
| 10000 km | 70,000 | 150,000 | - |
One way or another, any initial remote sensing data represents spatial data.
You can order from us


Problems to be solved
Globally, remote sensing is needed to explain and make decisions in two areas of human life - changes in the environment and infrastructure for any human activity.

Remote sensing has over 250 thematic directions and every year it grows with new directions as an innovative field of research.
Remote sensing monitoring is needed for detecting anomalies on land, in water, in the air, in cities, on roads, during natural disasters, or due to human factors, whether limited in size or extensive. Spatial factors over time play a role everywhere. Fixing anomalies and analyzing their appearance is what remote sensing does.

Goal: To make effective decisions resulting from remote sensing analysis that contribute to improving and ensuring the safety of life and society, preserving and restoring nature, and preventing infrastructure destruction.
Tasks:
Food Security – undoubtedly the primary and crucial task of remote sensing monitoring is food security and sufficiency for survival in the environment:
- Tracking the development of agricultural crops from sowing to harvest based on LULC remote sensing technology. Mapping indices, field condition indicators, assessing weeds, drought, salinity, pest infestations. Precision farming.

- Monitoring the cleanliness of water resources. Registering water pollution.
- Searching for new water sources in adverse areas.
Environment:
- Monitoring the state of the environment. Forming remote sensing information data about the current state of the environment and the degree of its pollution. Mapping anomalies. Conducting large-scale observations of anthropogenic impact factors.
- Predicting trends in environmental changes. Identifying sources of anthropogenic influence and organizing monitoring over them.
- Forest pathology examination. Systematic summarization and analysis of forest pathology observation results, compiling forest pathology condition reviews within specified timeframes. Justifying and making rational decisions for forest protection from damage, illegal logging, maintaining their sustainability and productivity.
- Monitoring the condition and behavior of water resources.

Infrastructure:
- Mapping and 3D modeling of construction industry objects and extended routes at all lifecycle stages: design, construction, operation.
- Urban development, decision making for urban construction, architectural 3D modeling.
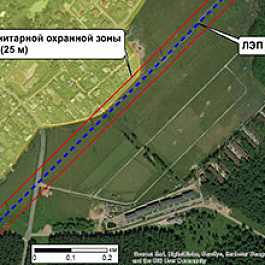
- Regular monitoring of extended routes of power lines, roads, railways, pipelines.
- Creating analytical maps of remote sensing objects, territories, and urban cadastre, real estate.
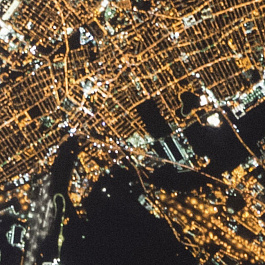
- Population growth and decline based on indirect remote sensing indicators (e.g., spatial night indicators, construction, etc.) in urban and rural areas (degree of agricultural development).
- Mapping the epidemic situation.
- Changes and indicators of the urban and territorial real estate market on the GIS platform.
Emergency Situations:
- Forecasting and controlling natural disasters (fires, floods, tsunamis, typhoons, etc.) and man-made accidents based on remote sensing analytics.
- Predicting emergency situations based on detecting structural and natural anomalies – remote sensing spectral indices, indirect signs based on them, thematic mapping in GIS management, modeling consequences, detailed tracking of the situation, aiding fieldwork for elimination.
Need for consultation?
Fill the form and we will contact you
Implementation examples
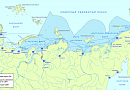
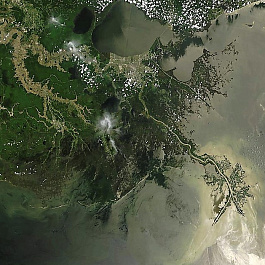
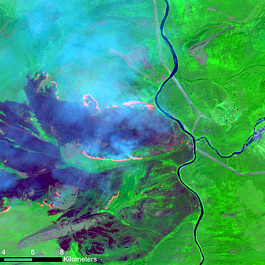
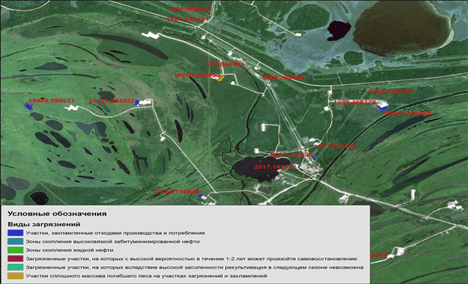
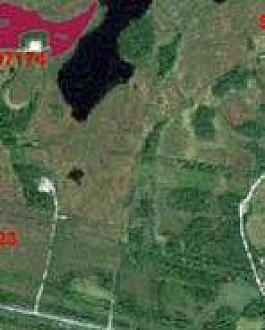
Environmental monitoring of oil pollution by space images
- Tasks:
-
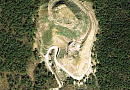
Environmental monitoring of oil pollution and creation of a thematic map of pollution in licensed areas for a specific period.
Using satellite images with high spatial resolution (1.5 m), the following pollution areas need to be identified:
- Areas littered with industrial and consumer waste;
- Zones of accumulation of high-viscosity bituminous oil, liquid oil;
- Polluted areas where self-recovery is highly likely to occur within 1-2 years; Polluted areas where due to high salinity reclamation in the next season is impossible;
- Areas of continuous dead forest mass on pollution and littered sites.
- Solution:
-
To decipher oil pollution in licensed areas (LUs), satellite images TripleSat and SPOT were used, which have a resolution of 1 m and 1.5 m in the panchromatic channel and 4 m and 6 m in the multispectral channels.
The following processing of the obtained images was carried out:
- Orthotransformation – to increase the accuracy of image georeferencing;
- Atmospheric correction – to eliminate the negative impact of the atmosphere on the decoding results;
- Pan sharpening – to enhance the spatial accuracy of the image.

Process of improving spatial resolution Test sites were selected for decoding to choose the most optimal and accurate method. Various classification methods with training (Spectral Angle Mapper, Maximal Likelihood, etc.), spectral indices (NDVI, etc.), and color synthesis options were tested.
The most accurate method is visual expert decoding by specialists in remote sensing of the Earth (RSE), since using classifications reveals a large number of false objects that are not of practical interest. Various combinations of spectral channels in combination with the NDVI index were used for the decoding process.
- Result:
-
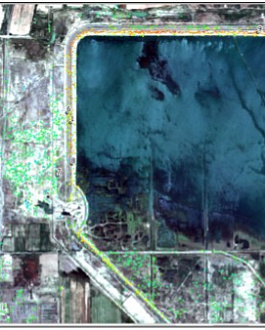
The result of the work was a thematic map of various oil pollution in the form of a vector layer for loading into any geographic information system.
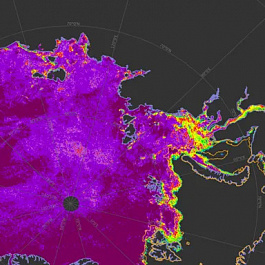
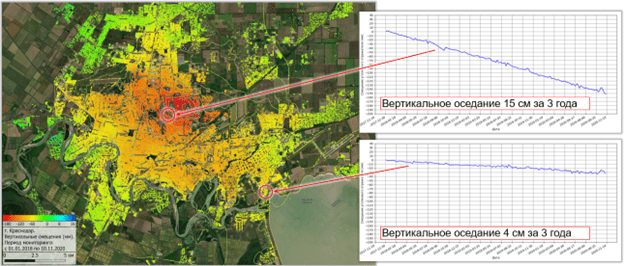
Geodynamic monitoring of the territory of the field under development
- Tasks:
-
- Monitoring of ground surface displacements;
- Determining the impact of field development on ground surface deformations;
- Identifying hazardous geodynamic areas to ensure industrial safety, subsurface protection, and safeguard buildings and structures from harmful mining activities.
- Solution:
-
- 115 radar images (from the last 5 years) from the Sentinel-1A/B satellite were analyzed. A number of images were excluded from the full set of available images due to natural and climatic factors at the time of capture that prevented reliable measurements (presence of snow cover, thunderstorms, ionosphere activity). 37 images were suitable for further use;
- The digital model of the field area was built based on the interferometric processing of a pair of radar images from the Sentinel-1B satellite.
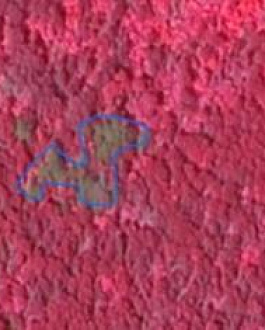
- Interferometric processing of the obtained series of radar images was performed using the persistent scatterers (PS) method;
")
Distribution of persistent scatterers in the field area (fragment) - Using the results of the interferometric processing, a map of average annual displacement rates was created;
- Vertical displacements measured by high-precision leveling were compared with line-of-sight (LOS) displacements obtained by radar interferometry;
- After obtaining vertical ground surface displacements, deformation calculations were conducted;
- After calculating quantitative assessments of surface deformation parameters, potential geodynamic risks were evaluated;
")
Average annual slopes in the field area (fragment) - Overall conclusions were drawn and relevant recommendations were provided;
- The relationship between hydrocarbon production and ground subsidence was analyzed.
- Result:
-
- Digital model of the field area;
- Schematic map (contour lines) of vertical displacements for the field area;
- Map highlighting geodynamic risk zones, conclusions, and recommendations.

Monitoring of technical condition of pipelines
- Tasks:
-
Obtaining optical satellite imagery and UAV imagery for further use in pipeline route patrolling tasks.

- Solution:
-
- Developing aerial patrolling schemes and UAV patrolling schedules for the area of interest;
- Conducting UAV flights and ordering high-resolution satellite imagery to monitor pipeline conditions;
- Ordering radar imagery for the pipeline area;
- Processing remote sensing data;
- Creating displacement maps with centimeter accuracy using radar interferometry.
- Result:
-
- Aerial and satellite imagery materials;
- Identified violations in the form of a database and violation cards;
- Displacement map for the pipeline area.
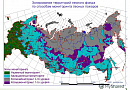
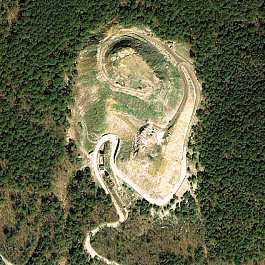
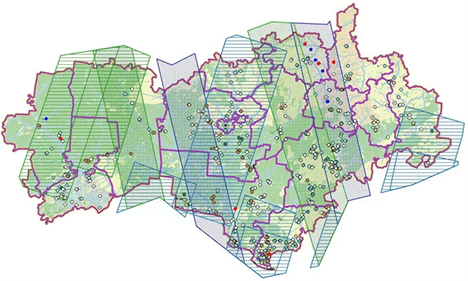
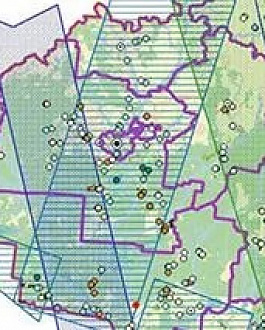
Ecological monitoring of environmental impact during mining operations in the Republic of Mari El
- Tasks:
-
- Conduct environmental impact monitoring during mining operations and the extraction of commonly occurring minerals;
- Detect and update information on illegal quarries (outside licensed areas) and associated solid waste dumps (SWD).
- Solution:
-
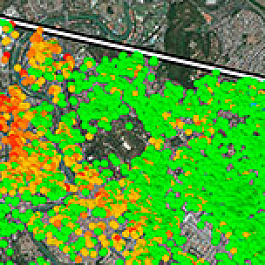
- Ordered archival imagery for the work areas from "Kanopus-V" and "Resurs-P" satellite images. Evaluated spectral separability of classes to identify mining objects. Results showed which objects can be successfully classified in the images and which may cause confusion, requiring more careful selection of standards and visual control by specialists during interpretation.
- Updated and supplemented data from a previously created GIS.
- In the NextGIS QGIS software, data was updated using new information. The resulting GIS map-scheme contained geoinformation layers that reflected preliminary information about all "mining objects," quarry areas, information on minerals, presence of dumps, etc.

- Interpreted images and classified data.
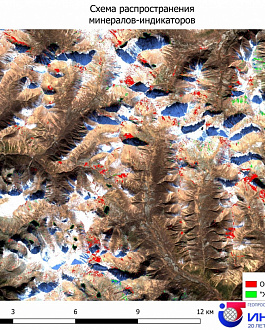
- Selected 40 images from 65 archival data, prioritized images without snow or clouds, summer-autumn period. Interpreted images visually, then classified and combined data into one layer.

Potential mining objects identified from 2017-2018 satellite imagery interpretation. - Analyzed the obtained objects in conjunction with existing subsurface fund data and prepared for field studies. In addition to data integration, a special "confidence" scale was developed:
- 25% – quarry presence is unlikely;
- 50% – quarry presence is moderately likely;
- 75% – quarry presence is highly likely;
- 100% – the object is a quarry.
- Data was evaluated accordingly and all other relevant attribute data was added (quarry condition, SWD presence, extraction area, type of mineral, satellite image used for interpretation, year of shooting).
- Several road graphs were created and routes were planned for visiting objects of interest in preparation for field work.
- The final stage of the project involved field surveys of objects of interest. As a result of the field work, 43 potential mining objects were surveyed, 21 of which were found to be quarries.
- Result:
-
The results demonstrated that Earth remote sensing data can and should be used for environmental monitoring, such as in this case for identifying illegal mining and mineral extraction, as well as detecting unauthorized SWDs.
In addition to identified mining objects, additional interpretation features for quarries and other objects that can be confused with quarries during automated and manual interpretation were developed.
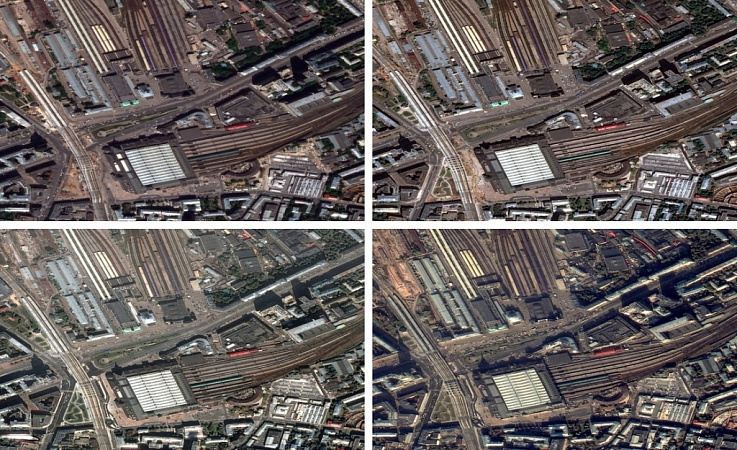
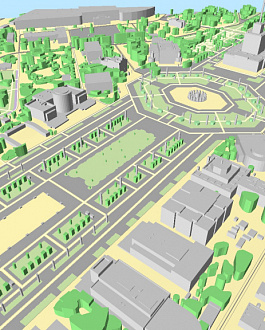
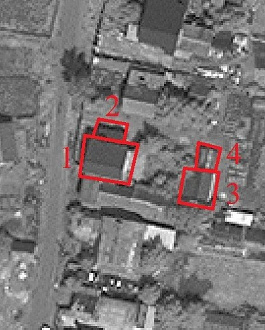
Space monitoring of Moscow city infrastructure
- Tasks:
-
Conduct monitoring of urban changes using ultra-high spatial resolution satellite imagery.
- Solution:
-
- Analyzed customer needs, identified key urban changes for monitoring, and established necessary observation time frames.
- Placed multiple orders for new ultra-high spatial resolution satellite imagery.
- Processed the received images using specialized software for geospatial data analysis. Atmospheric and radiometric corrections were performed.
- Result:
-
A complete set of urban change monitoring results. The report includes cartographic materials highlighting changes, analytical data, and recommendations for further actions. The customer can use this data for informed decision-making and effective urban management.
Completed projects
Our clients


FAQ
Remote Sensing represents a method of obtaining information about the Earth's surface without physical contact. This method utilizes various sensors and instruments installed on satellites, unmanned aerial vehicles (UAVs), aircraft, and other platforms to collect data about the Earth's surface, atmosphere, and environment.
Remote Sensing offers a wide range of applications across various fields, including:
-
Agriculture: Monitoring plant growth, farming activities, crop yield estimation, soil and water resources management.
-
Forestry: Assessing the condition of forest areas, detecting fires, monitoring deforestation.
-
Geology and Mining: Prospecting for minerals, assessing geological structures, monitoring mining activities.
-
Geodesy and Cartography: Creating maps, measuring terrain heights and contours.
-
Ecology: Assessing ecosystem health, monitoring wetlands, tracking species and climate change.
-
Urban Management: Monitoring air and water pollution, accounting for green spaces, waste management.
-
Security: Conducting reconnaissance and surveillance of territories, monitoring natural disasters, assessing structures in emergency situations.
Various types of sensors are used for remote sensing, such as optical (visible and infrared spectrum images), radar (using microwave radiation), thermal, and spectroscopic sensors capable of analyzing the composition of the surface and atmosphere. The collected data is processed and analyzed using Geographic Information Systems (GIS) and other tools.
Remote Sensing has wide practical applications and plays an important role in scientific research, resource management, and addressing various environmental and sustainable development challenges.
Licenses
Our partners