RS materials for scoring, loss assessment and collateral monitoring: archive, NDVI and before/after comparison.
Search the site
What the service is used for
Loans, credit and collateral
Assessment of assets, territories and clients by remote methods; the source cites a concessional loan to a farmer in Europe after RS data and a yield forecast.
Agri and climate insurance
ML/AI on RS data; in agriculture remote sensing is established as a reliable, legally confirmed method for financial services.
Loss before and after an event
Spatio-temporal image analysis: which areas are affected, intensity and the scale of material loss for insurers.
Risk and insurance premiums
High-resolution imagery in different weather conditions to assess risks around the asset and contribution strategy.
Financing monitoring
Warehouse geotags and 3D from satellite and UAV: roads, mining, ports, network supports, housing units — control of actual progress.
Need RS data for a bank or insurer?
Describe the task and the territory. A specialist will select the RS archive, optics or SAR and map composition.
What you will receive as a result of the work
01
Credit scoring and collateral
Remote assessment of plots, crops and objects for loans, credit and lease.
Banks use images and GIS to assess the object, territory and client without visiting every field. In the source — a preferential loan to a farmer in Europe after RS data and a yield forecast; scoring of small farms from historical land data; remote verification of borrower information by vegetation indices and productivity.
What you get
- selection of archive and new images for the collateral object or the plot being financed
- assessment of crop, development and territory condition over the agreed period
- materials for the credit decision and remote verification of borrower information
Layer composition, survey dates and coverage depend on the archive, cloud cover and the terms of reference. The credit decision is made by the bank.
02
Insurance damage assessment
Comparison of images before and after an event: area, damage intensity and claim priority.
Insurers analyse satellite images before and after an event to understand which areas are affected and to assess material damage. For floods, images give an operational view of affected regions and an estimated claim amount for properties. Agents verify claims by comparing frames before and after the incident.
What you get
- before / after image pairs and outlines of the affected territory
- assessment of damage area and intensity by an agreed method
- materials for claim prioritisation and calculation of claims
In urban development, high-rise buildings can interfere with flood survey; the source recommends complementing RS with hydrological data. Frame availability depends on the archive and cloud cover.
03
Risk, premiums and project monitoring
High-resolution images for assessing risk around an object, premium strategy and financing control.
Analysis of images in different weather conditions helps assess risks at an object and refine the pricing strategy for insurance premiums. For industrial finance — geotags of warehouses and periodic stock surveys; for infrastructure — 3D from satellite images and UAV surveys: kilometres of roads, production volume, power-line and telecom towers, number of housing units.
What you get
- risk assessment around the object from high-resolution images
- materials for premium strategy and collateral monitoring
- control of physical progress of financed projects on agreed dates
The 3D composition, UAVs and observation frequency are set in the terms of reference. Survey availability depends on the archive and weather constraints.
04
NDVI and crop insurance
Vegetation time series for calibrating insurance premiums and assessing yield.
In the source — 16-day composite NDVI maps at 250 m resolution for 2000–2018 for medium-term yield trends, and Sentinel-2 series at 10 m resolution for field-level assessment. The k(x,y,t) model for wheat, corn, ryegrass and pastures in 2016–2017 (Piedmont) links biomass to premium calibration. Separately — yield forecast from images for loans to small farmers.
What you get
- NDVI series and vegetation-anomaly maps for the agreed period
- assessment of crop condition at field level when high-resolution survey is available
- materials for calibrating insurance coverage and assessing yield
Resolution, sensors and series years are set in the ToR. The figures 250 m / 10 m / 2000–2018 and k(x,y,t) are from source cases, not a guarantee of coverage of your territory.
How the work goes
Cost and timeline
The cost and timeline of work for banks and insurers depend on the task, area, observation period and the composition of RS materials.
- task: credit scoring and collateral, agricultural and climate insurance, damage assessment from emergencies, monitoring of financed facilities
- data type: optics, SAR radar (including for floods), NDVI vegetation indices, archive or new survey; UAV and 3D if necessary
- industry benchmarks from the source: EUR 295 billion / USD 300 billion of banks’ ESG revenues by 2030; Roland Berger — plus 0,3 pp of ROE over 1–3 years; up to USD 180 billion of working capital of small farms; about 31% of the world population are small farmers. This is not an Innoter price list
- source cases (InceptionV3 and RGB, maize, Kenya, summer 2016; NDVI 16 days / 250 m for 2000–2018 and Sentinel-2 10 m; New South Wales floods, 2021, SAR and DEM) — application examples, not an order standard
The cost of the work is calculated individually
Timelines depend on the area, survey type and product composition
The final estimate is agreed after the task and the territory are described
What is needed for a quote
To agree the ToR for a bank or insurer, provide:
- task: credit scoring and collateral, crop and climate insurance, damage assessment, monitoring of financed facilities
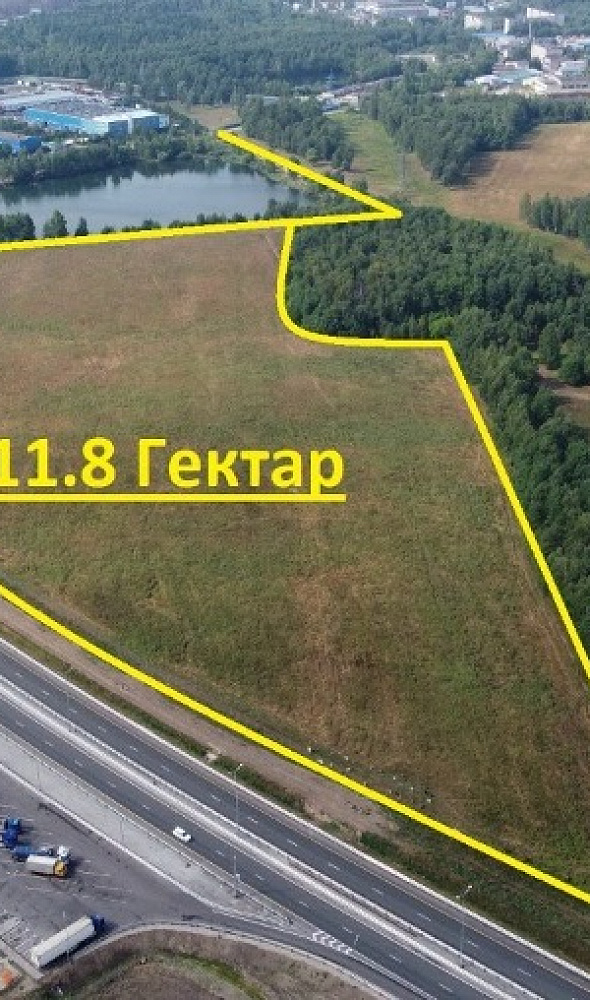
- area of interest — plot, field or facility outline, or a shapefile
- period: “before” and “after” event dates, the growing season or a retrospective
- whether you have your own images or need archival / new satellite imagery, optics, SAR, and UAV if necessary
- whether NDVI, before-and-after comparison, damage-area assessment, scoring or GIS layers are needed
- requirements for the format of maps, the report and the coordinate system, if they are already known
If survey parameters have not been set yet, describing the task and the facility is enough — specialists will propose the RS data composition.
Describe the outline and the goal — we will clarify the archive, a new survey and the set of maps.
Why Innoter
Prompt access to archives
Suitable archive imagery can be obtained faster when the required area and date are already available from operators.
No aviation clearances
A new satellite survey does not require the flight clearances typical of aerial surveys.
Large and remote areas
A single satellite pass covers large areas and makes it possible to work in hard-to-reach regions.
Direct agreements with operators
Distribution agreements help select archive imagery and order new surveys from different providers.
Software and server infrastructure
Modern software and computing capacity for quality control and processing of large data volumes.
Experienced specialist team
Years of experience on complex projects and specialists in cartography, photogrammetry and remote sensing.
RS data, scoring and insurance
The composition depends on the bank or insurer task, archive or new survey, and map and report requirements.
1
By 2030 the world volume of annual bank revenues related to environmental, social and governance products and services will reach 295 billion euros, or 300 billion dollars; almost half of this amount will fall to banks of Europe and North America. Environmental measures already affect bank profitability.
A Roland Berger study of the financial indicators of more than 200 European banks for 2007–2016 showed: banks that implemented substantial environmental remote methods received a positive impact on return on equity of 0,3 percentage points on average over one–three years — through lending, investments and services, efficiency growth and risk management.
Insurers in North America are expected to face growth in costs related to environmental disasters — hurricanes and wildfires — without remote analysis, as well as rising interest rates and declining investment returns in portfolios. The figures are industry figures, not an INNOTER price list.
2
Bancassurance is an arrangement in which the insurer sells products through the bank's channels. Banks receive risk-free commission income; the risk bearer remains the insurer. Insurers are important to banks as a source of share capital and financing: they invest large sums in debt and equity markets.
Digitalisation, new forms of risk and client requirements are changing the insurance industry: lower prices and higher-quality products for consumers and a more profitable model for insurers. The future of banking with remote methods, according to the source, will be different from today: changing consumer expectations, new technologies and business models require strategies already now — for servicing in 2030.
Assessment of the attractiveness of the branch market using GIS (a vector base of remote-sensing geospace) helps banks decide whether to reduce market presence and assess accompanying risks. Financial institutions work not with «pictures» but with information: tabular and text outputs — how much to allocate, when repayment on loans, borrowings and leases.
3
The most advanced direction, where remote sensing is established as a reliable, legally confirmed method of providing financial services, is agriculture. Owners of small farms will need up to 180 billion dollars of working capital and loans; they make up about 31% of the world's population and often have no financial records in banks.
The market for digitalisation of RS in agriculture is divided in the source into: remote yield monitoring; crop scouting; field mapping; variable-rate application; weather tracking and forecasting; inventory management; farm labour management; financial management; other (demand forecasting, customer management, accounts payable and receivable). The yield-monitoring sector held the largest share through 2030; the largest share of the world market for digital agricultural RS is expected in the Asia-Pacific region.
Satellite data give financial institutions access to yields and remote valuation of fields — for risk assessment when lending to small farmers. Crop-monitoring platforms open historical farm data, vegetation indices and productivity without a mandatory agent visit to every field.
4
Insurance companies use RS to quickly understand the affected regions and forecast the estimated claim amount for properties. Spatio-temporal analysis and ML/AI on images before and after the event show the affected areas, intensity and the size of material damage.
Areas with a large number of private individual houses are often better suited to loss assessment by remote sensing. In cities high-rise buildings can interfere with flood survey; insurers can complement RS with hydrological data: satellites show river flow and the floodplain, real-time hydrology covers the satellite revisit interval at flood peak and signal interference.
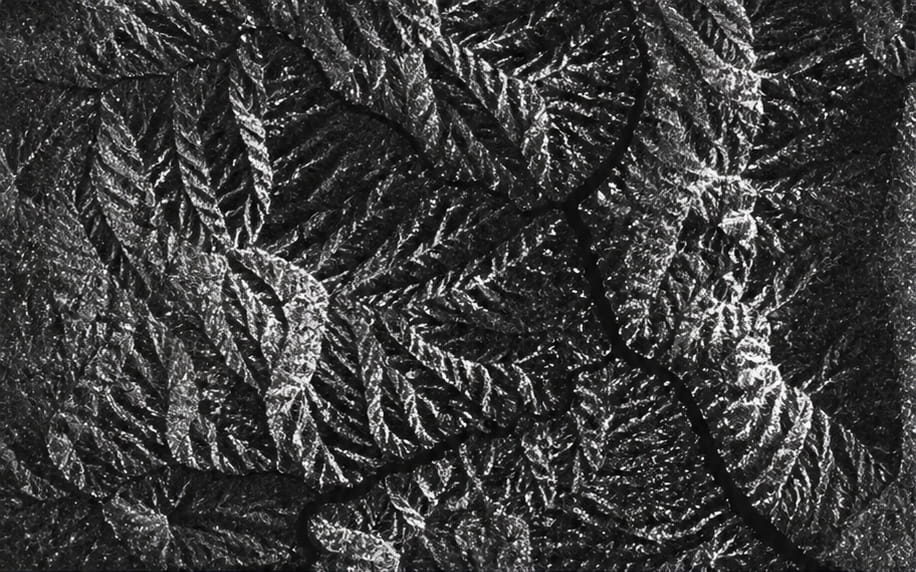
Source case: floods on the east coast of Australia in 2021. Imagery was used to detect floods and the scale of losses: water depth, inundation area, duration; inland (pluvial and river) and coastal (storm surge) floods. SAR provided a three-dimensional risk assessment while the event was still developing. In New South Wales traces of the event overlaid on portfolio data showed that estimated losses were lower than the initial assessment. SAR records water bodies; DEM, if available, — inundation depth for risk-level estimates.
5
Alternative credit scoring: low-income people in rural areas often have no stable credit history. Satellite images provide historical data on farmland and construction sites for value assessment. Accurate RS risk assessment is one of the main tasks of banks in lending: whether the borrower will be able to repay the loan, including in earthquake, flood, fire, chemical-production and oil-refinery zones.
Source case: a deep-learning model for yield forecast in Kenya. Financial-service providers for small farmers can assess the timing and magnitude of the harvest from imagery at low marginal cost. Models of automatic interpretation of maize, beans and potatoes were built for the summer and autumn seasons. More than 20 models were tested; the best — an InceptionV3 convolutional neural network architecture and RGB channels for maize yield forecast from summer 2016 imagery.
Industrial finance: geotags of factories, warehouses and stores; periodic surveys by UAV and mobile 3D cameras of actual inventories; discrepancies with the borrower's reports — grounds for a detailed check, including before and after large payments. Infrastructure financing: 3D from satellite images of sites, supplemented by UAV surveys, — kilometres of roads, area and volume of extraction, new telecommunications and power-line towers, the number of completed housing units.
6
Time series of free multispectral data: 16-day composite NDVI maps at 250 m geometric resolution for 2000–2018 described medium-term yield trends at the regional and macro-agricultural level. Sentinel-2 series at 10 m resolution detailed the assessment at field level and the linking of insurance risk to local crop condition. An operational mathematical model for calibrating premiums at the year and region level was proposed; crops — wheat, maize, ryegrass and meadows, 2016 and 2017, Piedmont region (north-west Italy).
Remote sensing was used as an indicator of socio-economic features: building size, distance between houses, street width, lack of trees and greenery. Together with multi-criteria weighted GIS overlay this was applied to search for food-bank locations. The study is related to UN Sustainable Development Goals Nos. 2, 11 and 12. Source limitation: a census at neighbourhood level is more accurate, the work was done at district level; expatriates change place of residence, which complicates the GIS base of bank users.
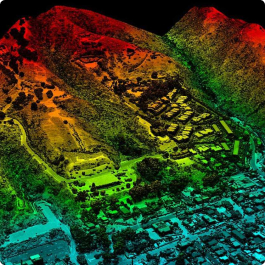
GIS in banking: charts, maps and 3D surface models — hills, mountains, landslides, trees, buildings, streets, rivers. Visual representation shows the relationship of locations and helps choose a retail or shopping-centre site relative to other stores and the presence of customers. Source illustrations (the Banking Salesforce Customer 360 platform and case schemes) were not transferred to the gallery.
Need satellite imagery or help choosing the right data?
Describe your task, area of interest, and desired outcome. We will check data
availability, assess new acquisition options, and propose the optimal solution in terms of timelines, cost,
and quality.
Discuss the project
clients who trust us
25+ years in the geodata market