Thematic map of the mineral-use object, technical report and, as agreed, UAV materials, field survey and GIS.
Search the site
What the service is used for
Illegal mining
Comparison of licence boundaries with actually detected mineral-use objects from satellite and aerial images.
MSW landfills
Detection of MSW landfills accompanying illegal mining.
Workings character
Determination of the character of workings and the mineral type.
Environmental impact
Assessment of vegetation, soils, waters and dumps in the mining zone.
Reclamation
RS-based maps are the basis for assessing the impact of workings and planning reclamation.
Did not find your task?
Send the site coordinates, questions and analysis dates — we will assess the archive and the scope of work.
What you will receive as a result of the work
01
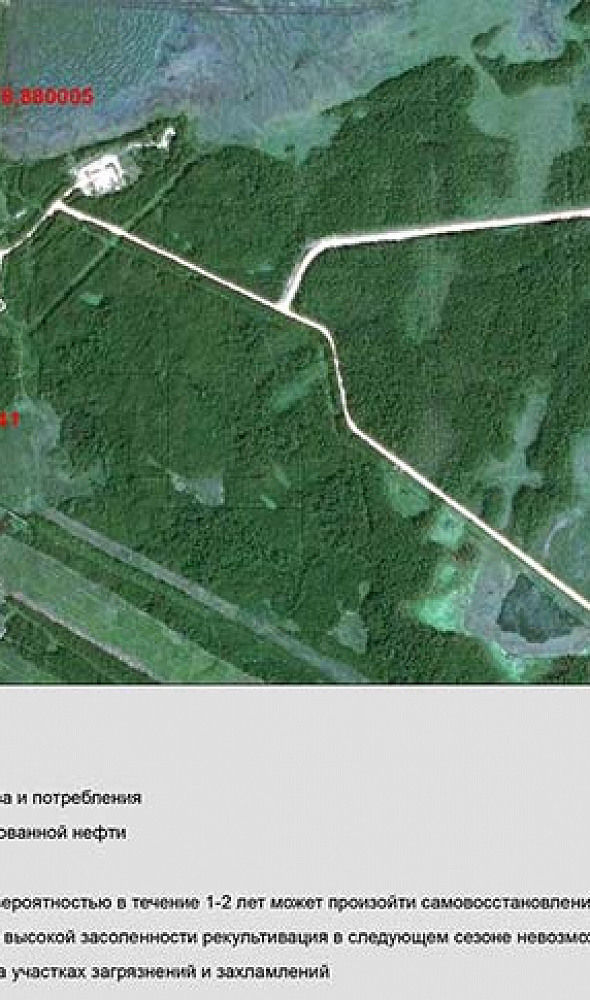
Thematic map
Thematic map of the object within mineral-use boundaries as of the date of the latest satellite survey: pollution sites in visual and numerical form.
The map shows detected mining objects, licence-boundary violations and areas of environmental impact.
What you get
- thematic map of the site within mineral-use boundaries
- pollution sites in visual form
- numerical indicators on the map
Map composition and survey date are fixed in the contract and terms of reference.
02
Technical report
Numerical indicators for mineral-use objects and environmental impact are attached in the technical report.
The report accompanies the thematic map and records the results of spatio-temporal analysis and environmental assessment.
What you get
- technical report with numerical indicators
- results of change analysis for the mineral-use site
- environmental indicators as agreed
The report composition is defined in the terms of reference.
03
UAV and field survey
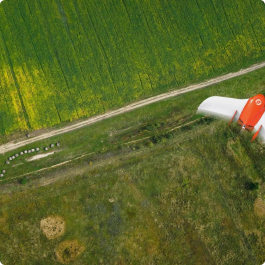
Additionally, more accurate UAV and field-survey data can be calculated and placed on the map — after such work is agreed with the customer.
A visit by specialists or local partners refines interpreted objects, samples and the reliability of data for objects without a field survey. A field survey provides laboratory data and an assessment of pollution of workings areas and the environment.
What you get
- UAV survey data as agreed
- refinement of objects and samples on the ground
- laboratory data and pollution assessment
UAV and field work are performed only after agreement with the customer and are not included in the basic scope without a separate arrangement.
04
GIS project
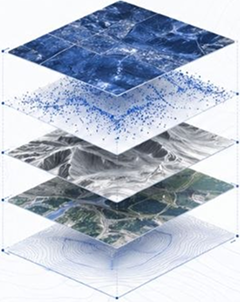
Separately, at the customer’s request, a GIS on the monitoring topic is created with layer vectorisation for further development and observation.
The GIS project contains information for analysis and subsequent decisions, including comparison of official mining-object databases with actually detected sites.
What you get
- GIS project on mineral use
- vectorised layers for further monitoring
- data for analysis and decision-making
GIS creation and layer composition are agreed separately.
How the work goes
Cost and timeline
The cost depends on task complexity, site area, type and number of images, relief, work season, advance size and whether the customer provides materials.
- consultation — free of charge
- image selection, preliminary analysis and terms of reference — free of charge
- RS image order: the cost of materials is calculated individually; free satellite images and/or commercial satellite or aerial images may be used if the customer does not provide their own materials or free images cannot be used
- work of technical specialists and expert(s) — from 500,000 RUB
- total cost — from 500,000 RUB; card estimate — from 500,000 ₽
- timeline on the card — from 20 days; in the timeline block and order steps — from 20 working days from the advance date
- the timeline depends on the total area of interest, availability of archive RS materials or a new survey, requirements for RS materials and the end product, and work complexity
- in the order steps: study from 500,000 RUB; imagery is paid separately; payment by bank transfer only
Total cost — from 500 000 ₽
Timeline — from 20 working days
Consultation and preliminary analysis — free of charge
What data are needed for a quote
To assess feasibility, cost and timelines, please provide:
- precise geographic coordinates of the object in the required coordinate system (specialists will refine coordinates provided in any convenient form)
- location of the study object and the questions to be resolved
- dates for which the analysis is needed
- size, terrain character and product requirements
- your own survey materials or consent to select archive, free or commercial imagery
If the listed information cannot be provided, describe the site, task and period — specialists will analyse the need and propose an option.
Describe the territory, questions and analysis dates — we will assess the archive and the scope of work.
Why Innoter
Prompt access to archives
Suitable archive imagery can be obtained faster when the required area and date are already available from operators.
No aviation clearances
A new satellite survey does not require the flight clearances typical of aerial surveys.
Large and remote areas
A single satellite pass covers large areas and makes it possible to work in hard-to-reach regions.
Direct agreements with operators
Distribution agreements help select archive imagery and order new surveys from different providers.
Software and server infrastructure
Modern software and computing capacity for quality control and processing of large data volumes.
Experienced specialist team
Years of experience on complex projects and specialists in cartography, photogrammetry and remote sensing.
RS methods, change types and source data
The composition depends on area, archive or new survey, map requirements and whether a field survey is needed.
1
To assess illegal mineral use, a range of methods is applied: manual photointerpretation, a combination of automatic methods and photointerpretation, and fully automatic methods.
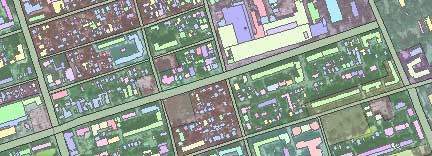
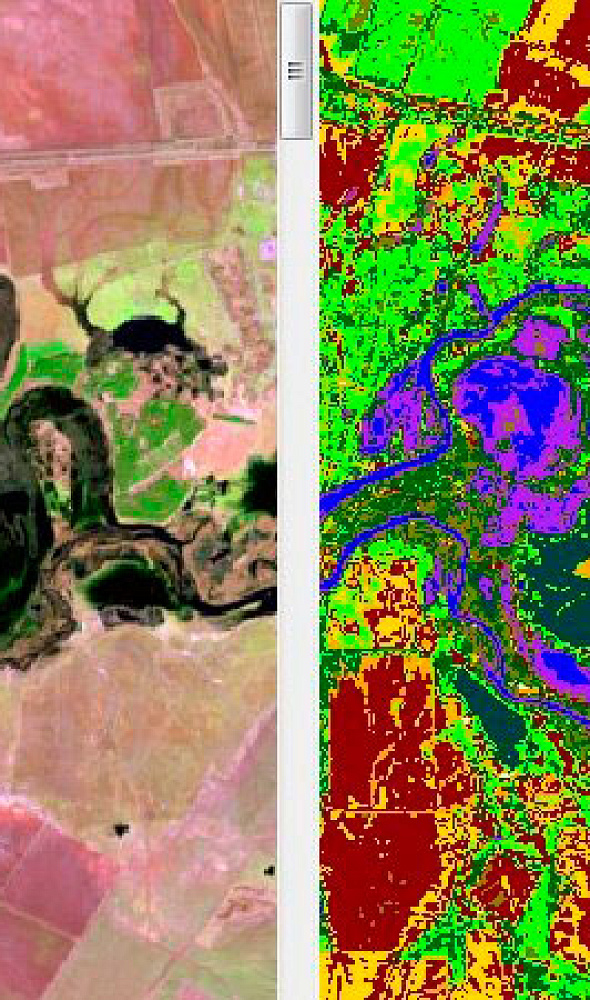
Analysis has shown that the most suitable classification types for the result are supervised, unsupervised and hybrid. Satellite images provide spectral signatures (spectral patterns) used to represent changes in extraction plots and to judge changes in the mining area and the environment.
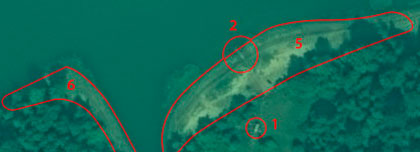
Plots not registered in the images — unlicensed or unauthorised — give an idea of the character and composition of violations. Panchromatic images, colour composites and unsupervised classification with neural networks are used to sample such plots.
2
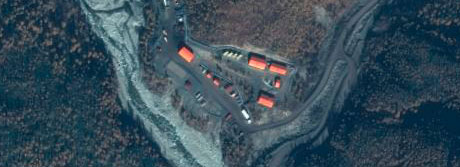
Multi-temporal satellite images record visual (spatial) and invisible (spectral) changes to assess whether the extraction technology is lawful or whether there are violations.
Change types associated with a mining area: exposure of underground layers; movement of material and piles of minerals; new dumps and changes in the mineral composition of dumps; vegetation health on destroyed and reclaimed plots; soil degradation; water quality in lakes and rivers in mining districts; raw-material transport routes and track monitoring; man-made changes; appearance of unknown buildings, new roads, movement of portable structures; soil-and-vegetation cover changes under land use and other details at workings sites.
3
Satellite images provide complete simultaneous coverage of the territory and an environmental assessment not only at observation points but also on any selected plot.
RS promptly shows the current boundaries of mineral-use violations and the condition of the territory, including whether it is in an environmental-crisis zone or an unsatisfactory environmental state.
Maps based on remote sensing data are needed for subsequent assessments of the impact of deposit development on soil and vegetation cover and as a basis for planning and monitoring reclamation. Understanding the causes of vegetation-cover variability makes it possible to distinguish natural and anthropogenic ecosystem disturbances for quantitative assessment of the impact of mining and other workings.
4
Precise geographic coordinates of the object in the required coordinate system are needed; specialists refine coordinates provided in any convenient form.
Software: GIS — QGIS, ArcGIS and others; processing — ERDAS, ENVI SARscape, SNAP and others.
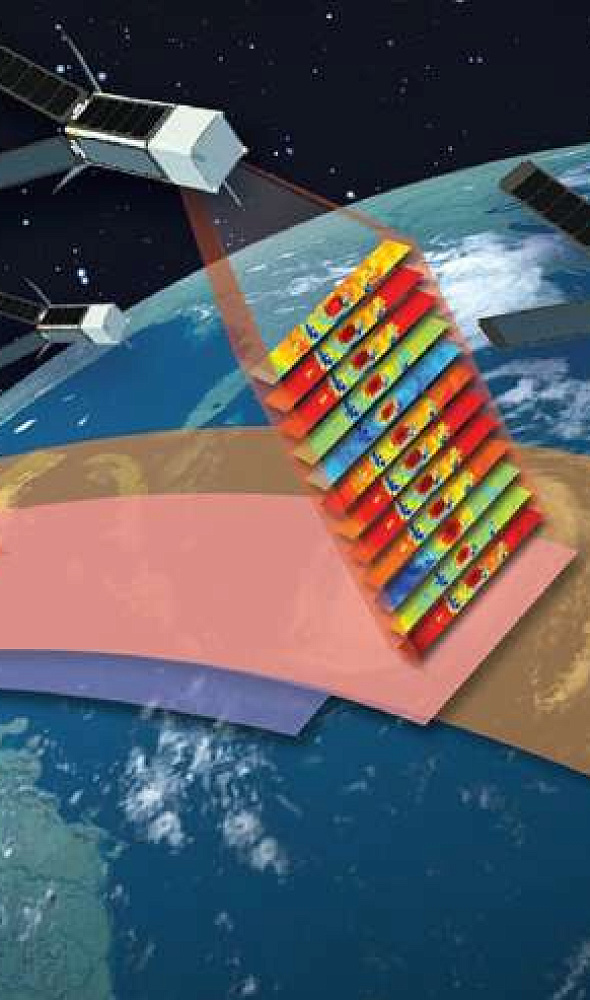
Optical, IR and radar images of different electromagnetic bands make the result more detailed and reduce interpretation errors. Separate spectral bands make it possible to compare existing and sought mining areas by spectral similarity, compute spectral indices and apply band fusion.
5
To increase interpretation reliability, an accumulated bank of interpretation samples of quarries and similar objects is used. Samples and additional interpretation features make it possible to fulfil orders with interpretation accuracy of 80% and more without a field survey.
A field survey increases effectiveness: it provides laboratory data and an assessment of pollution of workings areas and the environment. A visit by specialists or local partners refines interpreted objects and samples and confirms the reliability of data for objects without a field survey.
6
Time series — analysis of images of one area after scatter analysis of each image — combined with a bimodal histogram made it possible to identify unauthorised mining sites with a probability close to 90%.
There are methods based on ready-made algorithms for a specific geographic environment, district, mine, quarry or pit. Subsoil within the territory of the Russian Federation, including underground space and the minerals, energy and other resources contained therein, is state property; issues of possession, use and disposal of subsoil are under the joint jurisdiction of the Russian Federation and the constituent entities of the Russian Federation.

Frequently asked questions
Answers to key questions about service parameters, timelines, deliverable formats and workflow. If you did not find what you need — contact us and we will help.
A wide range of methods are used in our work, from manual methods such as photointerpretation, combinations of automatic methods and photointerpretation, to fully automatic methods.
Based on the analysis, it was found that different types of classification (supervised, unsupervised, hybrid) are the most appropriate to achieve the result.
A solution related to land classification based on supervised and unsupervised classification. For this purpose, space images were used, which provide spectral signatures (spectral patterns) on the basis of which it is possible to represent changes in mining sites and to judge changes both in the mining area itself and in the environment. Areas not recorded on the imagery - unlicensed or unauthorized - give an indication of the nature and composition of disturbance. At present, for example, conventional panchromatic images, combinations of color compositions and unsupervised classification using neural networks are already being used to sample such areas.
Yes, absolutely. Different images, different electromagnetic bands allow to make the result more detailed, avoid errors in interpretation. And due to the possibility of obtaining separate spectral bands of satellite images, it is also possible to apply the method based on spectral similarity between existing mining areas and the searched new mining areas, as well as to calculate spectral indices and apply fusion methods for different bands.
The creation of so-called time series (analysis of images per area) after scatter analysis of each individual image, combined with the use of bimodal histograms, made it possible to identify unauthorized mining sites with a probability close to 90%.
In addition, there are methods based on off-the-shelf algorithms for a specific geographical environment, neighborhood, mine, open pit, excavation, etc. They too have their application in the analyzed subject.
Need satellite imagery or help choosing the right data?
Describe your task, area of interest, and desired outcome. We will check data
availability, assess new acquisition options, and propose the optimal solution in terms of timelines, cost,
and quality.
Discuss the project
clients who trust us
25+ years in the geodata market