Accessibility Analysis for Transportation Planning is a comprehensive concept defined by the time required to travel from the point of departure to the destination point.

As an important indicator of development, accessibility, and the convenience of the location of a particular area, as well as its investment attractiveness, it needs to be taken into account in various spheres of human activity, including:

  • Industrial purposes (developing new territories, planning various construction projects, building infrastructure, etc.);
  • Personal purposes (choosing a place of residence, leisure destinations, route planning, travel, etc.).

The importance of Accessibility Analysis for Transportation Planning

Conducting an transport accessibility analysis in an area is essential for making strategic decisions, including managerial and investment decisions. It serves various purposes, such as:

  • Designing various solutions for transportation infrastructure;
  • Evaluating prospective areas for the development of different industries, including oil and gas extraction;
  • Studying the characteristics of remote territories;
  • Monitoring the condition of transportation networks under diverse seasonal conditions;
  • Comprehensively studying regions with complex climates or terrains;
  • Logistics planning for different types of cargo and cost estimation;
  • Organizing passenger transportation.

The Accessibility Analysis for Transportation Planning helps in making informed decisions, optimizing resource allocation, and ensuring efficient transportation and logistics operations. It is a crucial tool for assessing the potential of an area for development and making well-informed choices in various sectors of human activity.

Работник

Goals and Objectives of transport accessibility analysis

  • To provide accurate visual representation of the current state of the transportation network within the specified area at the given time intervals (both at the present moment and in retrospect);
  • To assess the physical, temporal, and financial costs required for transportation from the point of departure to the destination;
  • To evaluate the feasibility of making certain managerial decisions;
  • To organize complex composite routes, taking into account various modes of transportation and the nature of the cargo;
  • To select the optimal route for transportation to a specific point on the map.

Advantages of using Remote Sensing Data (RSD)

  • Operational access to information about any location;
  • Possibility to use archived data from satellite imaging since 1999;
  • Comparatively low cost of satellite imagery itself and the processing of the acquired materials;
  • Satellite imagery is significantly cheaper than using Unmanned Aerial Vehicles (UAVs), especially when studying geographically remote areas;
  • However, the use of UAVs or Aircraft is indispensable for researching areas under prolonged dense cloud cover over the region of interest.

Prices for services

Consultation Free of charge
Image acquisition, preliminary analysis Free of charge
Image processing, vectorization, technical report preparation From $300 USD*
Work of technical specialists and expert(s) From 50,000 rubles
Total cost From 50,000 rubles

* - free of charge if the Client provides their own materials or if free images can be used.

The cost of analyzing the transport accessibility of a location is calculated individually for each client and depends on: the area of the territory of interest; the cost of suitable satellite images; the level of detail required for identifying and describing the object composition, as well as the accuracy of the georeferencing of the obtained results.

The cost of execution is calculated on an individual basis, taking into account a specific of task.

After receiving the task description, we calculate the cost and send you a commercial offer.

Period of execution

Term of work - from 10 (ten) working days.

The timeframe for the analysis of transport accessibility of the area depends on the total scope of work within the project and terms of reference and is calculated individually for each project.

How to place an order:

  1. STEP №1: Submit an application on the website with the following information:
    • Location of the object of interest (coordinates, district name, region, SHP-file, etc.);
    • Requirements for the period of imaging (period for which archive data can be used or the need for new imaging);
    • Determination of the required scale and accuracy;
    • Required object composition;
    • Required final product format.
  2. STEP №2: Agreement on the technical specifications and cost:
    • Satellite images are paid for separately;
    • The cost and list of services for analyzing the transport accessibility of the location are worked out based on the requirements for the final product.
  3. STEP №3: Contract conclusion and commencement of work
    • Payment is made only by bank transfer. We start executing the Contract immediately after receiving the advance payment.

We work with individuals, legal entities, individual entrepreneurs, government and municipal authorities, foreign customers, etc.).

Need for consultation?

Fill the form and we will contact you

By clicking the «Send» button, you give your consent to the processing of your personal data, in accordance with Federal Law No. 152-FZ of July 27, 2006 «On Personal Data», on the conditions and for the purposes specified in the Consent to the processing of personal data.

Stages of service provision

Stage № 0 (Before Contract Conclusion):

  • Determining the boundaries of the location and the desired time period (current moment or retrospective);
  • Defining the requirements for accuracy and object composition of the study;
  • Checking the availability of archive remote sensing data (RS data) for the area of interest;
  • Verifying selected archive images for compliance with customer requirements;
  • Submitting a request to the operator(s) for new imaging if necessary.

RESULT: possibility (YES/NO) of providing the service


Stage № 1 (Before Contract Conclusion):

  • Agreeing with the customer on available archive remote sensing data;
  • Agreeing with the customer on the timing and parameters of new imaging (if necessary);
  • Agreeing with the customer on requirements for ground control points, ground control markers for orthorectification of satellite images (if necessary);
  • Agreeing on the coordinate system, projection of the final product, and output product format;
  • Final determination of labor and material costs, agreement on delivery schedules, and costs.

RESULT: signed contract


Stage № 2 (Contract Execution):

  1. Receiving 100% advance payment;
  2. Ordering satellite imaging materials;
  3. Incoming control of RS data materials;
  4. Stereo processing of RS data, obtaining GCP (GCM);
  5. Orthorectification of images and creation of seamless orthomosaics;
  6. Color corrections and cloud cover correction of the obtained orthomosaic;
  7. Partitioning the image into nomenclature sheets;
  8. Interpretation of necessary objects, creating vector GIS layers according to the standard classifier and the classifier provided by the customer;
  9. Adding necessary semantic information;
  10. Exporting data to various coordinate systems and projections;
  11. Compilation of a summary technical report on the existence of transport infrastructure objects and their condition (if necessary).

RESULT:

  • Raster base in the form of orthorectified satellite images;
  • Vector GIS layers;
  • Technical report (if necessary) in accordance with customer requirements.

The result of the provision of services

  • This is a turnkey product, executed according to unified standards, ready for loading into various GIS systems;
  • An analytical report (if necessary), representing an analysis of data obtained during the processing of information.


Requirements for Source Data

  • Exact location of the area of interest (coordinates, district name, region, SHP file, etc.);
  • Desired list of objects for the required analysis of transport accessibility of the area;
  • Other relevant information available.

If it is not possible to provide the specified data, please provide information about the purpose for which the remote sensing data materials are planned to be used. The specialists of "GEO INNOTER" LLC will analyze the requirements and propose an optimal solution to the problem.

Related services

Forensic Imagery Analysis (Expert Opinion)
Find out the price
Satellite imagery. Satellite data
Find out the price
Infrastructure Change Detection (PIPELINE Monitoring)
Find out the price
3D City Modelling (Digital twins)
Find out the price
Digital Topographic Maps
Find out the price
Thematic mapping
Thematic mapping
Find out the price
3D и 4D моделирование территории (3D город)
Find out the price
Заказ космической съемки. Космоснимки
Find out the price
Заключение эксперта
Заключение эксперта
Find out the price
Создание и обновление цифровых топографических карт
Find out the price
Мониторинг нарушения охранных зон. Дистанционный контроль соблюдения минимальных расстояний с помощью ДЗЗ.
Find out the price
Составление тематических и специальных карт, планов
Find out the price
Zazulyak Evgeny Leonidovich
The material was checked by an expert
Zazulyak Evgeny Leonidovich
Engineer, 28 years of experience, Education - Moscow Topographic Polytechnic Technical School, St. Petersburg Higher Military Topographic Command School named after Army General A.I. Antonov, Military Engineering University named after V.V. Kuibyshev. Kuibyshev Military Engineering University.

Customers

Rosneft
Gazprom
Gazprom neft
Lukoil
Transneft

FAQ

Standard polygon width from 5 km. In case of large volumes the minimum width of the polygon can be reduced in agreement with the supplier of space images.
The minimum order of archival super-resolution space images according to the terms of suppliers is from 25 square kilometers

Transport accessibility analysis is an important tool for determining the level of accessibility of a specific location depending on various types of transportation, such as car transport, public transport, pedestrian transport, and so on.

To conduct transport accessibility analysis, the following factors need to be considered:

  1. Distance: The distance to the nearest transportation infrastructure, such as bus stops, subway stations, train stations, etc.

  2. Travel time: The average time it will take to travel from point A to point B, considering transportation infrastructure and traffic congestion.

  3. Transport frequency: The number of transport vehicles passing through a certain point within a specific time frame.

  4. Transport infrastructure capacity: The ability of the transport infrastructure to accommodate a certain number of vehicles and people within a specific time frame.

  5. Expenses: The cost of transportation services and the ability to afford them.

Transport accessibility analysis can help in making decisions when choosing a location for living, working, or doing business. It can also be used to identify potential issues with transportation infrastructure and find ways to improve accessibility.

In the context of seasonality, analyzing the state of the transportation network is crucial to ensure its efficiency and safety. Seasonality means that the demand for transportation services can significantly vary depending on the time of year, holidays, events, and other factors.

To analyze the state of the transportation network in the context of seasonality, regular surveys and data analysis of traffic flow are necessary to identify potential issues and take measures to address them. Some of the possible measures for analyzing the state of the network in seasonality conditions include:

  1. Analysis of traffic flow changes: Observing the number of vehicles on the roads, including cars, trucks, buses, etc., during different seasons and during holidays and events.

  2. Monitoring of traffic congestions: Studying information about traffic congestions during different seasons and under different circumstances, such as weather conditions, road accidents, etc.

  3. Studying the demand for public transport: Collecting data on the demand for public transport, including the number of passengers and their routes, during different seasons and during holidays and events.

  4. Evaluation of the condition of transportation infrastructure: Regular inspection of infrastructure, such as roads, bridges, tunnels, railways, airports, etc., to identify potential problems and risks.

  5. Analysis of accident data: Analyzing statistics of road accidents and accidents in other infrastructure areas to identify the most dangerous locations and causes of accidents.

Monitoring the state of the network in seasonality conditions helps identify potential issues and risks and take measures to improve and address them effectively.

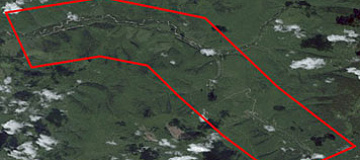
Analyzing transportation accessibility is a crucial part of developing new territories. It allows identifying the most efficient transportation methods and planning the construction of new roads and infrastructure, thereby increasing the accessibility of new territories and enhancing their economic potential.

When conducting an analysis of transportation accessibility, several aspects are important to consider:

  1. Distance: Evaluate the distance from the new territories to the nearest settlements, important facilities, and centers of economic activity.

  2. Types of transportation: Study the accessibility of various types of transportation, such as automotive, railway, air, water, and others.

  3. Road infrastructure condition: Assess the condition of road infrastructure and identify potential issues with establishing new roads.

  4. Transportation load: Examine the level of traffic load on existing roads and routes to determine the need for new roads and highways.

  5. Transportation cost: Evaluate the cost of transporting goods and passengers and identify the most economically advantageous transportation methods.

  6. Environmental factors: Consider environmental factors, such as emissions of harmful substances and pollution, that may arise during the construction of new roads and the development of transportation infrastructure.

Analyzing transportation accessibility enables the identification of the most effective ways to develop new territories and formulate plans to improve transportation infrastructure and enhance accessibility for residents and businesses.

A significant proportion of customers of many retail facilities use public transportation for their daily purposes. Therefore, when studying such facilities, it is important to analyze accessibility not only by personal transport, but also by public transport. Our experience, technology and data allow us to take these factors into account.
Assessment of the object's accessibility by public transport (availability of public transport stops in the vicinity). For residential real estate one of the most significant factors is good accessibility by public transportation. Convenience of transport accessibility of the object has a significant impact on the attractiveness and value of real estate objects.
There are several methods of transport accessibility analysis that are used to assess the level of accessibility of transport infrastructure in cities and localities. These methods take into account various criteria such as population, distance from urban development, the importance of transportation infrastructure to the economy and residential lines, and the specifics of individual geographical areas.


One such method is transportation network density analysis. It consists of determining the number of transportation routes available in a particular area and their density. The greater the number of transportation routes and the more dense they are, the higher the transportation accessibility in a given area. For example, in cities with high population density and a large number of built transportation routes, the density of the transportation network is one of the important criteria for assessing transportation accessibility.


Another method is travel time analysis. This method is based on estimating the time required to reach destinations by different modes of transportation. For this purpose, information on the schedules and travel times of vehicles is used. Such an analysis is important for assessing the accessibility of certain areas of the city or settlements that are located at a considerable distance from the center or from major transport hubs.


There is also a method of distance analysis. It is based on determining the distances between points and estimating the availability of transportation to reach these points. For example, distance analysis to major transportation hubs such as railway stations, bus stations and airports can be used to assess the transportation accessibility of a city.


Another method is transportation cost analysis. It is based on the assessment of the cost of transportation of goods and passengers. This method allows to assess the economic efficiency of transportation infrastructure and determine its importance for the economy of a region or country. Various criteria are used to analyze the cost of transportation, such as the cost of transportation of cargo or passenger, transportation time, distance between points, capacity of transport infrastructure, etc.


This method can be used to analyze transportation accessibility at both local and macro level. For example, when planning transportation infrastructure at the local level, transportation cost analysis can help to determine the most efficient location of roads, railways and other transportation infrastructure, as well as to select the optimal type of transportation.


At the macro level, transportation cost analysis can be used to determine the economic importance of transportation infrastructure as a whole. For example, it is important for a country to have a developed transportation system in order to ensure economic growth and competitiveness in the global market.


Thus, transportation cost analysis is an important method of transportation accessibility analysis, which helps to assess the economic efficiency of transportation infrastructure and determine its importance to the economy of a region or country.


Another method of transportation accessibility analysis is the gravity model method. It is based on the assumption that the amount of movement between two points is proportional to the product of the population of these points and the inverse of the distance between them. Thus, this method allows us to estimate the transportation accessibility between individual geographical points based on the calculation of the value of the gravity index.


For an example, let us consider the analysis of transportation accessibility of residential lines in an urban environment. When building residential complexes, it is very important to take into account the transportation accessibility of the location. In this case, the criteria can be remoteness from the centers of economy and population, as well as the availability and distance to public transport.


Various methods can be used to calculate transportation accessibility, including a combination of several methods. It is important to consider both existing and planned transportation routes and lines, as well as projected traffic volumes on these routes.


The conclusions of the transport accessibility analysis can be used to optimize the location of infrastructure, residential and commercial developments, as well as to make decisions on the construction of new roads and the widening of existing roads.

Accessibility indicators in transport planning measure the ease with which individuals or businesses can reach desired destinations, services, or activities. These indicators help planners assess the effectiveness and inclusivity of transportation systems. Several key accessibility indicators are commonly used:


  • Travel Time and Distance:

Travel Time: The time it takes to travel between origin and destination points.
Travel Distance: The physical distance between origin and destination locations.

Mode Choice:
Transport Mode Share: The distribution of trips across different transportation modes (e.g., walking, cycling, public transit, private vehicles).

  • Connectivity:
Network Density: The availability and density of transportation infrastructure, including roads, public transit routes, and pedestrian pathways.
Accessibility to Transport Nodes: Proximity to transit hubs, bus stops, train stations, and other transportation nodes.

  • Service Frequency and Reliability:
Frequency of Transport Services: The number of trips or services provided within a given time period.
Reliability: Consistency and predictability of transportation services.

  • Affordability:
Transportation Cost: The financial burden associated with using different transportation modes.

Universal Design and Inclusivity:
Accessibility Infrastructure: Presence of features like ramps, elevators, and tactile paving for individuals with disabilities.
Inclusive Design: Ensuring that transportation services are accessible to people of all ages, abilities, and socioeconomic backgrounds.


  • Land Use and Zoning:

Land Use Mix: The diversity and proximity of land uses, such as residential, commercial, and recreational areas.
Zoning Regulations: Policies that influence the development of transportation-friendly environments.

Safety and Security:
Pedestrian Safety: Measures of safety for pedestrians, including crosswalks, pedestrian signals, and lighting.
Vehicle Safety: Measures to enhance the safety of motorized transportation.

  • Environmental Impact:
Emissions and Pollution: Indicators related to the environmental impact of transportation activities, including air and noise pollution.

Public Satisfaction:
User Satisfaction Surveys: Feedback from the public regarding their satisfaction with transportation services.

  • These accessibility indicators provide a comprehensive view of how well a transportation system serves the needs of the community and can guide planners in making informed decisions to improve the efficiency and inclusivity of the transportation network.

Accessibility in transportation refers to the ease with which individuals or communities can reach desired destinations, services, or activities using the available transportation infrastructure. It involves assessing the degree to which transportation systems enable people to connect with the places they need to go, such as workplaces, schools, healthcare facilities, shopping centers, and recreational areas. Accessibility is a crucial concept in urban and transportation planning, emphasizing the importance of designing transportation networks that are efficient, inclusive, and cater to the diverse needs of the population.
Accessibility analysis in transportation refers to the examination and measurement of how easily individuals or goods can reach desired destinations within a given area. It involves evaluating the ease of movement and the ability to connect with various opportunities, such as employment, education, healthcare, shopping, and recreational activities. Accessibility analysis is crucial for understanding the performance of transportation systems and identifying areas for improvement. It goes beyond simply measuring the physical infrastructure (like roads and transit lines) and incorporates factors that influence people's ability to reach their destinations efficiently.
Accessibility planning refers to the strategic and systematic process of designing, developing, and managing transportation systems and urban environments to ensure that they are inclusive, efficient, and meet the diverse needs of all users. The goal of accessibility planning is to create environments where individuals can easily reach their destinations, participate in economic and social activities, and enjoy a high quality of life, regardless of their age, ability, or socioeconomic status.

Licenses

License for implementation of geodetic and cartographic activities (page 1)
License for implementation of geodetic and cartographic activities (page 2)
Application for the license for implementation of geodetic and cartographic activities
ISO 9001:2015 Certificate of Conformity №СДС.ФР.СМ.00813.19 (page 1)
ISO 9001:2015 Certificate of Conformity №СДС.ФР.СМ.00813.19 (page 2)

Warranty

It is optimal to specify profile RF and international documents regulating the subject area under consideration.

We guarantee 100% quality of services. Cooperating with GEO Innoter specialists, you exclude risks and losses!

The availability of qualified personnel with extensive experience in working with specialized software allows us to ensure timely and high-quality implementation of projects!

Our partners