A regular grid, TIN or contours in an agreed format — from stereo imagery, aerial photography, UAV or ready-made commercial DEMs.
Search the site
What the service is used for
Maps and plans
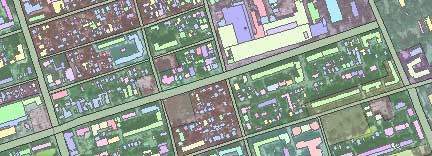
Display of relief when creating and updating digital topographic maps and plans at various scales.
Flooding and hydrodynamics
Hydrodynamic modelling of terrain flooding and forecasting of landscape processes.
Construction and roads
Topographic site plans for designing facilities, underground and above-ground structures, roads and interchanges.
Cadastre and land management
Land management and cadastral work, territorial planning and environmental tasks.
Telecom and navigation
Digital terrain models for planning telecommunication networks and navigation maps with address information.
Did not find your task?
Describe the territory, the required DEM accuracy and the purpose. A specialist will check the archive, ready-made models and survey feasibility.
What you will receive as a result of the work
01
Regular elevation matrix
A DEM as a regular elevation matrix of the Earth's surface on a grid of squares, rectangles or triangles.
Grid nodes hold elevation values of the true terrain — without vegetation, buildings or other anthropogenic objects.
What you get
- an elevation matrix of specified accuracy and detail
- formats GeoTIFF, Arc/Info ASCII Grid (ASC), Band interleaved (BIL), XYZ
- if required — tiles in Sputnik KMZ format
Model type, coordinate system and format are fixed in the terms of reference.
02
TIN model
An irregular TIN model (Triangulated Irregular Network): points with elevation values and triangulation taking account of breaklines.
Suitable for complex relief: triangle edges describe structural lines, ridges and surface discontinuities.
What you get
- TIN with the required accuracy, type and format per the ToR
- formats Wavefront OBJ, 3DS, VRML, COLLADA, Stanford PLY, STL, Autodesk FBX, AutoCAD DXF, Google Earth KMZ, U3D Universal 3D, Adobe PDF
The set of formats and delivery composition are agreed before the contract is signed.
03
Contours and isolines
Vector lines — contours (isohypses) or other isolines with equal or unequal interval.
Used to display relief on digital topographic maps and plans and to transfer data into CAD and GIS.
What you get
- contours in AutoCAD DXF, ArcGIS SHP, Google KML formats
- a grid (elevation matrix) at the agreed spacing
Contour interval and projection are set in the terms of reference.
04
Ready-made commercial DEMs
Selection and delivery of ready-made commercial models: AW3D, WorldDEM, Maxar 3D, NextMAP, VRICON, TanDEM-X and others — for any territory.
If operators' and partners' databases contain a model that meets the order goals, delivery follows the standard order-fulfilment mechanism.
What you get
- a ready-made DEM with a cell from 1 m
- vertical accuracy up to 1.6 m (RMSE), accuracy up to 1 m (RMSE)
- minimum delivery area from 25 km²
Availability of a ready-made model depends on the operator's coverage; otherwise the DEM is created from remote sensing materials.
How the work goes
Cost and timeline
DEM price depends on the cost of images, the number of frames covering the area, availability of GCPs and the complexity category of the district.
- order benchmark on the card — from 30,000 ₽
- consultation — free of charge; image selection and preliminary analysis — free of charge
- ready-made commercial DEMs (AW3D, WorldDEM, Maxar 3D, NextMAP, VRICON, TanDEM-X and others): minimum area from 25 km², cost from 2,500 USD; cell size from 1 m; vertical accuracy up to 1.6 m (RMSE); accuracy up to 1 m (RMSE)
- ordering images to create a DEM — from 8 to 200 USD per 1 km² depending on the survey (archive or new, mono or stereo, resolution); images are paid separately
- stereo processing of remote sensing materials — from 8 USD per 1 km²
- DEM creation — from 8 USD per 1 km², calculated individually (volume of remote sensing data and presence or absence of GCPs)
- a ready-made DEM is delivered for an area of at least 25 km²
- timeline in the table and on the card — from 5 working days (depends on volume, complexity category, availability of archival imagery)
- in the timeline block: ToR agreement — from 1 to 5 working days; contract signing — from 1 to 5 working days; execution — from 5 days from the date of 100% advance payment; total — from 6 days
- payment when creating a DEM: from 5 working days from the date of 100% advance payment for remote sensing materials, bank transfer only; remaining payment after the work is completed
- when ordering a ready-made DEM the advance is 100%
Order cost — from 30 000 ₽
Lead time — from 5 working days
Consultation and preliminary selection — free of charge
What is needed for a quote
To assess feasibility, cost and timeline, provide:
- location of the object of interest: coordinates, district or region name, shapefile
- the task for which the DEM is required
- requirements for vertical accuracy and spatial resolution of the DEM
- the period for which archival data can be used, or a new survey is required
- if needed — requirements for control accuracy, coordinate system and projection of the finished product
If exact parameters are unknown, describe the purpose of using the DEM — specialists will check the archive, ready-made models and the possibility of a new survey.
Specify the area contour, the task and the model accuracy requirements.
Why Innoter
Prompt access to archives
Suitable archival materials can be obtained faster if the required territory and date are already available at the operators.
Without aviation approvals
A new satellite survey does not require flight-performance approvals typical of aerial surveys.
Large and remote territories
A single satellite strip covers significant areas and makes it possible to work with hard-to-reach districts.
Direct agreements with operators
Distribution agreements help select archival imagery and order a new survey from different suppliers.
Software and server infrastructure
Modern software and capacity for quality control and processing of large data volumes.
Experienced specialist staff
Many years of experience on complex projects and specialists in cartography, photogrammetry and remote sensing.
Data sources, formats and model types
The composition depends on accuracy, archive or new survey, control, and whether a ready-made commercial DEM or creation from remote sensing is needed.
1
A digital elevation model (DEM) is a three-dimensional representation of the Earth's surface as an array of points with defined elevation. A DEM contains elevation information of the true terrain only, without vegetation, buildings or other anthropogenic objects.
Digital surface models (DSM) describe all irregularities of the Earth's surface, including vegetation and anthropogenic objects. A DEM is needed for detailed terrain information: digital topographic maps and plans, mine surveying, engineering surveys, studies by geologists, biologists and geographers.
2
Five main sources: ground surveys; airborne photogrammetric collection; existing cartographic surveys (topographic maps); airborne laser scanning; stereoscopic or radar satellite images.
Satellite images, aerial photography (APS), UAV surveys and airborne laser scanning (ALS) are used to create a DEM. Satellite data are obtained faster if the area is already in the operator's archive. DEMs from stereophotogrammetric processing of satellite and aerial images have high accuracy and informativeness.
3
Elevation pickets — points with known geodetic coordinate referencing — are used to build a DEM. The model is created only from points classified as ground relief points. Elevations are obtained by interpolation with various picket layouts.
The goal is terrain information with specified accuracy and detail for a given area. Representation structures: TIN (Delaunay triangulation), GRID (regular elevation grid) and TGRID (a combination of TIN and GRID principles) with linear interpolation, inverse distance weighting, kriging, spline and trend interpolation.
4
Raster DEM: GeoTIFF, Arc/Info ASCII Grid (ASC), Band interleaved (BIL), XYZ or Sputnik KMZ tiles.
TIN: Wavefront OBJ, 3DS, VRML, COLLADA, Stanford PLY, STL models, Autodesk FBX, AutoCAD DXF, Google Earth KMZ, U3D Universal 3D, Adobe PDF.
Contours (isohypses): AutoCAD DXF, ArcGIS SHP, Google KML. The coordinate system and projection are agreed with the client before the contract.
5
DEMs at scales from 1:500 to 1:50,000 can be ordered from satellite imagery, aerial photography and UAV surveys. Work is performed in accordance with SNiP, GOST and SP.
Experience in DEM creation — since 2000. Priority is orthophotomaps from satellite images with spatial resolution from 0.3 m for scales 1:10,000, 1:25,000, 1:50,000 and smaller. In the last 5 years orthophotomaps are also produced from aerial photography and UAVs for scales 1:5,000, 1:2,000, 1:1,000 and larger.
6
Before the contract: purpose of creation, area of interest, accuracy characteristics, preliminary selection of archival images, planning of a new survey if needed, check of ready-made commercial DEMs at operators and partners.
Execution when creating a DEM: collection and pre-processing of source materials (remote sensing, GCPs, map materials; radiometric, geometric and atmospheric correction); technical design of processes; photogrammetric processing; creation of a DEM with the required accuracy, type and format.
7
SRTM (Shuttle Radar Topographic Mission) is radar topographic survey of almost all land except oceans and extreme latitudes. Data have been openly available since 2005: 3-arc-second spacing, 1 arc-second over the Americas.
DEM from topographic maps: scanning at optimal resolution, joining of sheets, contour vectorisation, raster interpolation. Converting raster SRTM DEMs between formats in GIS is usually not a problem: a specific format is often already set in the technical specifications.


Frequently asked questions
Answers to key questions about service parameters, timelines, deliverable formats and workflow. If you did not find what you need — contact us and we will help.
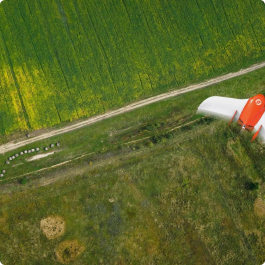
Even the most inaccessible vast areas of the Earth can now be viewed and modeled through the use of drones. Different types of radars, video cameras and other instruments can be used on drones to collect the required data.
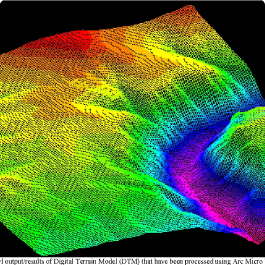
DEM is a digital elevation map, that is, a representation of the Earth's surface. Unlike a DSM, a digital terrain model (DTM) represents the bare surface of the earth without any objects such as plants and buildings.
DTM is a set of methods used to derive or represent a DEM.
Created using modern software and equipment, the Digital Elevation Model (DEM) is a high-precision method for producing cartographic maps or raster representations of the Earth's surface. It consists of a group of coordinates and discrete numbers that determine the locations of buildings, natural features, and other objects, including valleys, rivers, elevations, and more, without considering vegetation on the terrain.
Information about the relief of a specific area is obtained not only through natural measurements but also through remote sensing using unmanned aerial vehicles, which allow for the creation of different types of assignments:
-
with irregularly placed points based on local coordinates, the center of the territory, structural lines, or relief profiles;
-
with regular representation of elevation points on triangular, rectangular, and other grids;
-
with contour assignment, where points are located on contour lines, either considering the complexity of the drawing or evenly distributed.
In the United States, there is another definition for digital elevation models, which are vector datasets consisting of regularly spaced points and natural features such as ridges and fault lines. They complement the height matrix, including linear surface characteristics.
DEM is a pure raster grid, tied to a vertical coordinate system.
DEM is a pure raster grid, tied to a vertical coordinate system.
- For calculating slopes and slope exposure, as well as other geometric parameters of the terrain, which is crucial not only for road construction and various types of pipelines but also for proper field planning in agriculture and other industries;
- For visibility analysis in order to plan communication networks, solve military tasks, or in other industries;
- As well as for analyzing the illumination of an area and wind patterns;
- For orthorectification of images;
- For conducting project surveys and monitoring the dynamics of the terrain;
- For monitoring and forecasting geological and hydrological processes;
- For creating flood modeling;
- Monitoring exogenous processes by comparing multiple DEMs;
- Building and structure design. It takes into account not only the coordinates of specific points but also the characteristics of the construction site.
The main disadvantage of such a relief model is that the location of points on the terrain turns out to be suboptimal, because in some areas you need greater accuracy and, accordingly, a greater number of points, in other areas, on the contrary, the available number of points is excessive
- Ground surveys;
- Aerial photogrammetric data collection;
- Existing cartographic surveys, such as topographic maps;
- Airborne laser scanning;
- Stereoscopic or radar satellite imagery.
- Cost;
- Accuracy;
- Density of sampling;
- Pre-processing requirements.
Another highly efficient modern method is the airborne and spaceborne interferometric radar system, which is used to obtain precise data about both land cover and terrain.
Currently, UAV aerial imagery is the easiest and cheapest way to conduct large-scale measurements over large areas, surveying for orthophotos and digital terrain models (DTM). In the process of processing dense point cloud data, geodetic engineers acquire elevations of the terrain, thus creating a digital terrain model. The DEM does not include information about the elevations of vegetation, structures, and machinery on the earth's surface. This material is needed by planners for construction planning.
There are many software tools for creating and processing digital elevation model data: from multifunctional GIS, such as Panorama GIS, ArcGIS, QGIS, to narrowly focused programs for visualization and creation of animation using elevation models.
Three-dimensional modeling is currently one of the fastest growing areas of DEM use. The difference between a three-dimensional model and a two-dimensional one is quite obvious: it is possible to visually evaluate terrain features, its variability and other characteristics. To create a three-dimensional model of some terrain, one can use an orthoimage, which is a space image or aerial images with distortions removed, as a result of which the scale of all points is equalized. The prepared orthoimage is as if "stretched" on the surface created by the digital terrain model. After such processing it is possible to get a rather realistic 3D-image. However, this combination of orthoimage and DEM may not always coincide exactly, because some parts of the relief may be modified due to the presence of vegetation, snow or other natural phenomena. Besides, orthoimage usually contains shadows from objects. As a result, the resulting three-dimensional image will depend on the time of year and time of day. To eliminate such effects and to increase the quality of terrain texture, additional processing of orthoimages is required: additional digital filtering and retouching.
Conversion of raster digital elevation models srtm from one format to another in a GIS program is usually not a problem, so a specific format is not necessary, especially since they are often already fixed in the preliminary specifications. Depending on the selected output medium, different ways of displaying terrain surfaces are chosen.
Depending on the set tasks, professional GIS-technologies or specialized GIS-technologies can be used for DEM formation. As a rule, the software product of GIS-technologies is offered in the basic version with the possibility of selecting additional add-ons according to the set task. The basic module contains basic GIS operations: program support of input-output devices, data export and import capabilities and some others. As a rule, the difference between the presented capabilities of software products that implement GIS-technologies does not differ much from one manufacturer to another, since technological developments are usually borrowed from each other quite actively.
The first software package allowing to model relief using a regular elevation model, which found its application and development, was the GRID package, which means grid, mesh, network. It was created in the late 1960s in the Harvard Laboratory of Machine Graphics and Spatial Analysis (USA). This package realized the possibility of multiple input of different layers of raster cells.
A digital terrain model (DTM) and digital elevation model (DEM) is, roughly speaking, a grid where each pixel contains information about plan coordinates and elevation of the surface point it corresponds to.
In the course of aerial imagery, the images include not only the ground surface, but also vegetation, buildings and road elements. All these objects (data) also become part of the digital surface reconstructed from the photos. It is like throwing a huge blanket over the terrain, fixing all its curves and lifting it up - so you get a digital terrain model, i.e. a combination of relief and all objects located on it.
If you cut off all the objects that are not the earth's surface and build a digital model, you get a DEM.
There are several basic types of data in GIS: points, lines, polygons, surfaces and rasters. The mixing of these data within a single layer is generally unacceptable. Exceptions are data models of the "network" (consisting of nodes connected by arcs) and "coverage" type (like a network, consisting of nodes connected by arcs; in addition, there are regions whose boundaries are defined by arcs).
The fastest and most informative way to obtain rapid spatial data for express planning or visualization.
Several factors play an important role for the quality of matrix-derived products: terrain roughness; sampling density; elevation data collection method; grid resolution or pixel size; interpolation algorithm; vertical resolution; and terrain analysis algorithm.
Today, modern drones are capable of collecting the necessary data, analyzing it down to the smallest detail, and building a visual layout in a short period of time.
In GIS electronic systems, data from various topographic map collections are still being digitized. The process involves the following steps:
- Scanning: This process involves scanning the maps while considering the optimal resolution. The resolution is determined based on the needs of the digital terrain model (DTM). Too much detail may not be necessary, as it can result in long loading times and require extensive processing.
- Alignment and overlay: This step allows for the alignment and seamless merging of all elements of the future model. It also helps to address any discrepancies or errors in the data, such as missing information on one source but present in another.
- Vectorization: Software is used to automatically mark horizontal lines. Attempting to perform this manually would require a significant amount of time.
- Raster image interpolation using one of the aforementioned methods. This step transforms the electronic map into a complete digital terrain model (DTM).
The use of information from radar topographic survey, aka Shuttle radar topographic mission, is becoming more and more widespread. The information is conducted from two shuttles, which revolve around the Earth. The whole planet, except for the oceans and the most extreme (southern and northern) latitudes, is captured by radar sensors.
The data have some longevity, they have been offered in the public domain since 2005. The whole network has a three-second step, they are just taken as points for the construction of the DEM. Only on the territory of America the step is 1 second, it is caused by the fact that the shuttle and the whole program belong to the USA.
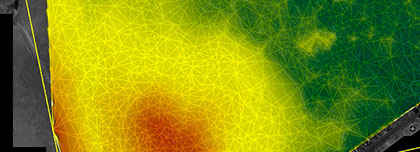
TIN (Triangulated Irregular Network) is a representation of terrain that consists of connected triangles. Each edge of a triangle is part of a neighboring triangle. The vertices of the triangles are coordinate points with known values. They are connected using Delaunay triangulation, where circles are drawn through the vertices and edges are placed along the intersecting points of the circles.
GRID - The literal translation from English is "grid." It represents a network with height values. The grid interpolates and transforms the original values, filling the cells with the resulting values. The advantage of this system is that the values can be continuously transformed and refined based on approximation.
TGRID (Triangulated Grid) combines the principles of the previous two methods. The main advantage is that this technology is ideal for describing complex topographic maps and areas with challenging terrain. Mathematical calculations help predict unexpected changes in the surface, such as boulders and small depressions.
Multiple interpolation methods are used, including linear interpolation, inverse distance weighting, kriging, spline interpolation, and trend interpolation.
Need satellite imagery or help choosing the right data?
Describe your task, area of interest, and desired outcome. We will check data
availability, assess new acquisition options, and propose the optimal solution in terms of timelines, cost,
and quality.
Discuss the project
clients who trust us
25+ years in the geodata market