Infrastructure Change Detection (PIPELINE Monitoring) - monitoring of territories or water areas, which are located within the boundaries defined by the minimum allowable distance from the axis of main pipelines (gas pipelines, oil pipelines, product pipelines, etc.), power lines, railroads, within which certain objects can be located, calculated by processing of aerospace materials.

Why is Infrastructure Change Detection is needed

Infrastructure Change Detection (PIPELINE Monitoring) is carried out to comply with the legislation on the safe operation of particularly dangerous objects and the adjacent territories.

Pipeline monitoring (Infrastructure Change Detection) is carried out using a comprehensive method of remote sensing of the Earth: satellite imaging + unmanned aerial vehicle (UAV) imaging during both day and night to solve the following tasks:

   1. Real-time detection:

-     failures in oil industry pipelines.
-     spills of oil, petroleum products, and effluent water;
-     locations of unauthorized intrusions;
-  locations of unauthorized actions by third parties at controlled facilities;
-     forest fires, peat fires, in areas where pipelines pass through;
-     locations of debris along the pipeline route;
-     unauthorized storage of construction materials and pipes in security zones;
-     locations of unauthorized presence of individuals and vehicles in security zones;

   2. Condition assessment:
condition assessment:

- air crossings, water crossings and ravines;

- crane stations, launching and receiving points for treatment facilities;

- along pipeline routes, pipeline accesses, bridges, over streams and ravines, pipeline crossings, culverts and other pipeline facilities;

- Locations of non-designed pipeline sections;

- repair works on pipelines;

- condition of kilometer signs, crossing, corner, turn and other signs on the pipelines;


    3. Monitoring:

- violations and damages on the pipelines

- places of construction, installation works and ground leveling; places of construction of crossings and passages through pipelines, parking places for tractor vehicles without appropriate documents agreed with the operating organization and drawn up in accordance with the established procedure;


Automatic monitoring of power transmission lines and PPAs is a method of automatic inspection of power transmission lines using satellite imagery and UAVs. Here the main solution of three subtasks: automatic measurement of power lines, automatic three-dimensional reconstruction of the terrain along the power line corridor (PLC) and automatic recognition of obstacles. 

Continuous monitoring of critical assets and their surroundings can ensure reliable operation, asset protection, and preventive maintenance on an as-is basis.


Machine learning techniques can monitor the reliability of these assets and automatically detect overgrown vegetation, illegal construction in the right-of-way, and disaster detection events (landslides and floods). Future climate change challenges will require the development of new detection technologies and machine learning models on remotely sensed images to improve power system reliability, prevent power outages, and minimize the likelihood of wildfires.


Emphasis is placed on scalable and accurate technology for monitoring power line corridors and SAMs, including but not limited to:


Detection of vegetation in power line corridors using optical satellite imagery, SAR and LiDAR imagery.

  • Development of new imaging techniques including UAVs and autonomous vehicles.

  • Detection of hazardous conditions around critical assets.

Работник

Goals and Objectives

The main objectives of processing Earth remote sensing data (RSD) for the purpose of Infrastructure Change Detection (PIPELINE Monitoring) are as follows:

  • Ensuring the safe operation of particularly hazardous facilities and adjacent territories;
  • Defining the zone of minimum distances and registering it (including boundaries) in the Unified State Real Estate Register;
  • Determining the zone of minimum permissible distance to main or industrial pipelines and other objects of increased danger (power lines, etc.) suitable for construction or other economic activities, as well as human habitation;
  • Timely detection of existing and under-construction buildings and structures within the zone of minimum distances / protected zone;
  • Identification of illegally constructed buildings and structures within the zone of minimum distances;
  • Identification of woody vegetation within the protected zone;
  • Monitoring compliance with the width of the protective strip;
  • Identification of logging residues (storage/retention) within the protected zone;
  • Detection and timely prevention of possible technogenic disasters;
  • Identification of locations with damages to pipeline supports and backfilling;
  • Discovery of pipeline sections not in their planned position;
  • Finding unplanned pipeline surface outcrops;
  • Determining deviations from current requirements for pipeline protection;
  • Collecting and analyzing information on the current state of protective zones, surface objects of the pipeline, and minimum permissible zones and distances;
  • Operative identification of unauthorized activities and movements within the pipeline's protected zone;
  • Inspection and analysis of the technical condition of the pipeline;
  • Detection of theft of material assets;
  • Monitoring the activities of contracting organizations;
  • Discovery of spill and leakage locations;
  • Determining the areas of land reclamation and contamination;
  • Identification of places of illegal activity, etc.

In the pipeline laying zone:

  • Identification of locations with damages to pipeline supports and backfilling;
  • Discovery of pipeline sections not in their planned position;
  • Finding unplanned pipeline surface outcrops;
  • Determining deviations from current requirements for pipeline protection;
  • Collecting and analyzing information on the current state of protective zones, surface objects of the pipeline, and minimum permissible zones and distances;
  • Operative identification of unauthorized activities and movements within the pipeline's protected zone;
  • Inspection and analysis of the technical condition of the pipeline;
  • Detection of spill and leakage locations.

In the protective zone of power transmission lines (PTL):

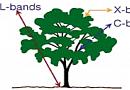
  • Identification of vegetation and determination of their height;
  • Inspection and analysis of the technical condition of supports;
  • Detection of breaks and damage assessment;
  • Obtaining information for making decisions on the operative elimination of accidents on the line;

Protective zone of highways:

The protective zone along highways in Russia currently has an approximate range of 25 to 50 meters, and it is even less when passing through villages, settlements, and cities.

  • Creation of a continuously operating and up-to-date database (thematic maps, geospatial video and photo of the current situation) of Infrastructure Change Detection (PIPELINE Monitoring). Basics of building information modeling: data collection, gradient and distance measurements, expansion through geographical referencing/data. A continuously operating GIS as a geospatial management system for PIPELINE Monitoring.

  • Secondarily, but importantly, an ecological and up-to-date situation depicted on thematic maps.

  • Development and implementation of measures to reduce the negative impact on the environment during construction and operation.

Advantages of Using Remote Sensing Materials

Emissions, for example, carbonaceous pollutants, and noise levels. Emissions from mobile sources on roads have historically been a significant anthropogenic factor in atmospheric air pollution. Concentration of such emissions on road maps will provide answers to cause-effect relationships for their reduction.

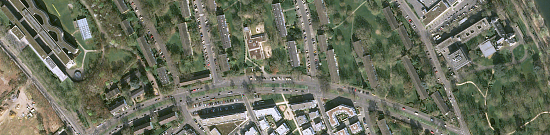
  • Fixation of pollution violations, illegal construction, and suspicious situations within the zone of minimum distances using periodic photo and video imagery.

  • Monitoring of such zones ultimately leads to prevention, emergency situation (ES) recording, and decision-making (ES result logistics modeling) for its elimination. Primarily, assessing the potential destruction of surrounding structures during emergency situations, such as sudden disruptions of roads and protective zones due to earthquakes, floods, landslides, typhoons, falling trees, etc.

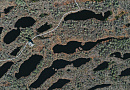
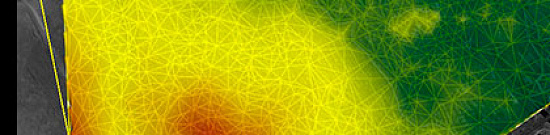
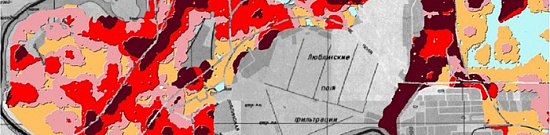
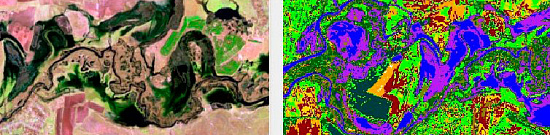
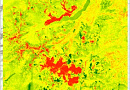
  • Measurement of vegetation levels and moisture conditions within the zone of minimum distances using the Normalized Difference Vegetation Index (NDVI) and Normalized Difference Moisture Index (NDMI) can demonstrate obvious trends of degradation and recovery in buffer zones.

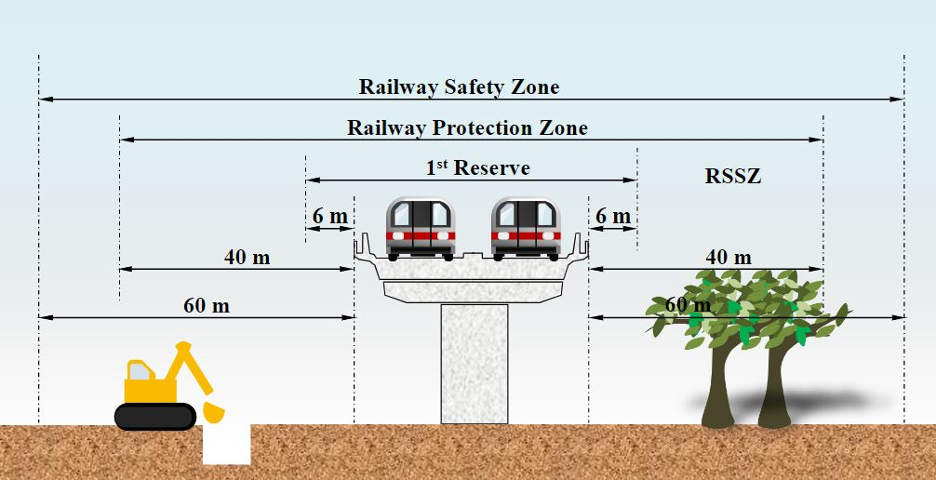
  • Protective Zone of Railways:

    Practically the same as for highways, but taking into account the specific features of railway infrastructure and stricter, regulated rules. However, trains are not cars, and railway tracks are not roads. These statements are obvious, but they are often ignored when assessing the potential and actual impact on biodiversity by railways, which are often equated to the impact of roads.

     Therefore, there are specific approaches for railways, including: 

    • Development and verification of a spectral index based on remote sensing to predict and map soil vulnerability to erosion within railway corridors in semi-arid conditions. The proposed approach is called the Normalized Difference Railway Erosion Liability Index (NDReLI).

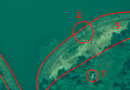
    • Remote monitoring of unstable slopes and infrastructure (landslide monitoring) at risk, using a combination of traditional and new stationary and automated (i.e., remote) technologies.

    • Monitoring of ballast tracks and the zone of minimum distances with minimal vegetation.

    • Monitoring railway track construction and reconstruction, bridges, stations, and other railway infrastructure.

    Advantages of Using Remote Sensing Materials

    The method of monitoring protective zones and determining the zones of minimum distances using Earth remote sensing (RSD) materials offers several advantages compared to traditional field methods. It is faster, more convenient for territories with complex natural and climatic conditions, and more effective for extensive and hard-to-reach hazardous industrial facilities such as main pipelines or power transmission lines. Additionally, it is more cost-effective while maintaining high-quality results.

    image

    Prices for services

    Consultation Free
    Preliminary Analysis Free
    Order of Earth Remote Sensing (ERS) Materials The cost of ERS materials is calculated individually for each order and may vary: minimum cost starts from $6 per 1 km2.
    Work of Technical Specialists and Expert(s) From 50,000 rubles
    TOTAL COST From 50,000 rubles

    The cost of execution is calculated on an individual basis, taking into account a specific of task.

    After receiving the task description, we calculate the cost and send you a commercial offer.

    Period of execution

    The execution period for the works is from 10 (ten) business days from the date of receiving the advance payment.

    The completion time of the works depends on the total area of the territory, requirements for Earth Remote Sensing (ERS) materials, the final product, and is calculated individually for each customer.


    How to place an order:

    1. STEP №1: Leave an application on the website with the following details:
      • Location of the object of interest (coordinates, district name, region, shp-file, etc.);
      • Requirements for the shooting period;
      • Precision of determining the zone of minimum distances;
      • Final deadlines for delivering the finished materials.
    2. STEP №2: Agreement on the technical task and cost:
      • Used Earth Remote Sensing (ERS) materials;
      • Data presentation formats;
      • Technical requirements for ERS materials;
      • Additional requirements for output data (if necessary);
      • Final cost of work and execution time.
    3. STEP №3: Signing the contract and starting the work:
      • Execution period is 10 days from the date of receiving 50% advance payment - payment only by bank transfer. The remaining payment after delivering the materials and signing the certificates of completed work.

    We work with individuals, legal entities, individual entrepreneurs, government and municipal authorities, foreign customers, etc.


    Need for consultation?

    Fill the form and we will contact you

    By clicking the «Send» button, you give your consent to the processing of your personal data, in accordance with Federal Law No. 152-FZ of July 27, 2006 «On Personal Data», on the conditions and for the purposes specified in the Consent to the processing of personal data.

    Stages of service provision

    Stage № 0 (PRE-contract stage):

    • Determination of the shooting area, parameters, and shooting date;
    • Selection of the shooting equipment;
    • Purpose of determining the zone of minimum distances;
    • Determination of the execution period of the works.

    RESULT: Possibility (YES/NO) of providing the service


    Stage № 1 (PRE-contract stage):

    • Agreement with the customer on the parameters of Earth Remote Sensing (ERS) materials;
    • Agreement with the customer on the format of transmitted data;
    • Agreement with the customer on the technology of processing ERS data;
    • Final determination of labor and material costs, agreement on the execution period, and cost of work.

    RESULT: Signed contract

    Stage № 2 (Contract execution):

    1. Receiving advance payment (50%) for the order and purchasing ERS materials;
    2. Creating orthophotoplans;
    3. Processing the received ERS materials, thematic data processing according to the Technical task;
    4. Preparing the report;
    5. Delivery of materials to the customer.

    RESULT: A set of data obtained as a result of processing ERS materials


    The result of the provision of services

    GEO INNOTER provides the customer with Earth Remote Sensing (RSD) materials in the form of orthophotoplans (orthophoto mosaics) along with the original images, materials on thematic processing in vector formats, and a technical report.


    Requirements for Source Data

    Precise coordinates of the area of interest, requirements for RSD materials (resolution on the ground, shooting mode, angles of image inclination, minimum sun angle, shooting period), complete requirements for thematic processing (types of processing required), and output data formats.


    Related services

    Remote sensing imagery Interpretation & spectral analysis
    Remote sensing imagery Interpretation & spectral analysis
    Find out the price
    Photogrammetric processing (Image Processing)
    Photogrammetric processing (Image Processing)
    Find out the price
    Structures and Construction Monitoring
    Structures and Construction Monitoring
    Find out the price
    Environmental Monitoring
    Environmental Monitoring
    Find out the price
    Remote sensing of the earth (RS)
    Remote sensing of the earth (RS)
    Find out the price
    Фотограмметрические работы
    Фотограмметрические работы
    Find out the price
    Дешифрирование данных дистанционного зондирования Земли (ДЗЗ)
    Дешифрирование данных дистанционного зондирования Земли (ДЗЗ)
    Find out the price
    Мониторинг строительства зданий и сооружений
    Мониторинг строительства зданий и сооружений
    Find out the price
    Экологический мониторинг (экомониторинг)
    Экологический мониторинг (экомониторинг)
    Find out the price
    Zazulyak Evgeny Leonidovich
    The material was checked by an expert
    Zazulyak Evgeny Leonidovich
    Engineer, 28 years of experience, Education - Moscow Topographic Polytechnic Technical School, St. Petersburg Higher Military Topographic Command School named after Army General A.I. Antonov, Military Engineering University named after V.V. Kuibyshev. Kuibyshev Military Engineering University.

    Customers

    FAQ

    The question is not an idle one, as it determines the practice of remote sensing in aerial planning (UAV) or satellite imagery. However, in reality, there are certain discrepancies in the concept of the protection area due to the location, the number of railroad or highway infrastructure tracks, the specifics of the pipeline route, the height and magnitude of the transmission voltage of the power lines, and, in general, the need to prevent potential risks. The protection zone of, for example, railroad tracks and highways, in any designation used in regulatory documents, is nothing but necessary precautions. They are taken for the problem-free parallel existence of specific railway and highway transportation, structures and buildings for its functioning with other buildings and areas, surrounding vegetation, natural and geophysical hazards. Example, Distance from railroads : Not less than 50 m - highways, parking lots, warehouses and public utility establishments, garden plots ; at least 100 m - fence, house, garage.
    The terms of work execution depend on the area of the territory, requirements to the survey parameters.

    The minimum period of work execution is from 10 (ten) working days
    100% prepayment on the invoice for remote sensing materials after signing the contract, the rest of the payment after the work is done.
    • location of the object of interest (coordinates, name of the area, region, shp-file, etc.);
    • survey period requirements (period for which archive data can be used or a new survey is required);.
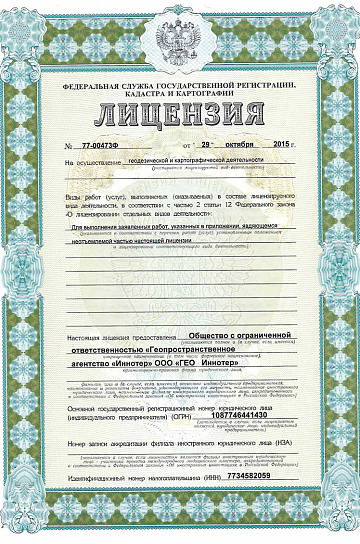
    Infrastructure Change Detection for gas main pipelines is part of the provision established by law in the Russian Federation that regulates the establishment of safety boundaries for the construction and operation of gas pipelines. Compliance with the established rules and conditions is ensured through governmental control and regulation of organizations involved in the industrial use of gas. The zone of minimum distances of gas main pipelines is determined based on information on soil characteristics, gas pressure, gas pipeline diameter and other factors specified in federal level documents. The established procedure for amending these documents must also be observed. According to Russian legislation, the zone of minimum distances of gas trunk pipelines must be determined on a case-by-case basis, based on the specific conditions of construction and construction of facilities. A separate paragraph of the rules stipulates that in the zone of minimum distances of gas trunk pipelines any kind of construction and other ground works that may cause damage to the gas pipelines must be prohibited. This is to ensure the safety of gas pipelines and prevent possible accidents. Thus, theInfrastructure Change Detection of Gas Trunklines plays an important role in ensuring the safety of industrial facilities and land in Russia.
    A gas main Infrastructure Change Detectionis a safety zone that defines the minimum distance from the gas main line within which any construction or other ground work that could damage the pipeline is prohibited.
    Federal regulations controlling the zone of minimum distances of gas main pipelines are part of the legislation of the Russian Federation establishing rules for construction and operation of gas pipelines.

    The main rules are:

    • Russian Government Resolution No. 861 of December 30, 2004, "On Approval of the Rules for Establishing the Boundaries of Safety Zones of Linear Energy and Transport Facilities";
    • Federal Law No. 383-FZ dated December 21, 2013 "On Energy Saving and Increasing Energy Efficiency and on Amendments to Certain Legislative Acts of the Russian Federation".
    These rules determine which objects and works are prohibited in the zone of minimum distances, and also establish the procedure for establishing the boundaries of safety zones.

    In addition, the federal rules establish requirements for control and monitoring of the condition of gas pipelines in the minimum distance zone, as well as for emergency and preventive measures.

    Compliance with these rules is controlled by the relevant state control authorities, and administrative and criminal penalties are envisaged for their violation.
    The legislation of the Russian Federation contains a number of regulatory acts that regulate the issues of control over the minimum distance zone of gas main pipelines. One of such acts is Federal Law No. 190-FZ dated July 27, 2010 "On Gas Supply in the Russian Federation", which establishes requirements for construction and operation of gas pipelines, including the minimum distance zone. According to this law, the construction and operation of gas pipelines must comply with the established safety and environmental protection requirements, as well as ensure efficient utilization of energy resources.
    1. Federal Law "On Gas Supply in the Russian Federation" - defines the legal framework for the construction, operation and safety of gas pipelines in Russia, including minimum distances and requirements for compliance.
    2. Federal Gas Supply Rules and Regulations - defines detailed requirements for gas pipelines, including minimum distances to facilities and buildings.
    3. Technical Documentation Standards - defines requirements for the design and construction of gas pipelines, including minimum distance zones.
    4. Agreements and licenses for gas pipelines operation - contain information on requirements for gas pipelines operation and compliance with minimum distances.
    5. Technical documentation for gas pipelines - includes information on distances to facilities and buildings and safety measures.
    6. Inspection and verification reports and protocols - contains information on the results of inspections of compliance with minimum distances and safety measures.
    7. Maps and diagrams of gas pipelines - includes information on the location of gas pipelines and minimum distances.
    When using RS (remote sensing) and GIS (geographic information systems) to analyze the zone of minimum distances, the following documents can be provided to the customer:

    1. Remote sensing maps and images, which allow to estimate the distance between gas pipelines and other objects such as buildings, roads, power lines, etc.
    2. Analysis reports that provide information on compliance with minimum distances and possible violations, as well as recommendations for safety measures.
    3. Electronic maps and databases created in GIS, which may contain information on gas pipelines, minimum distance zones, facilities, and other important parameters.
    4. Graphical and textual materials that can be used for risk assessment and pipeline management decisions.

    Depending on the terms of the contract between the customer and the RS/GIS provider, other documents and materials may be provided, such as reference books on technical parameters of gas pipelines and facilities, standards and regulations used in the analysis of minimum distance zones, etc.
    The gas trunkline Infrastructure Change Detection is the area established by regulations that covers the territory in which construction and location of facilities must comply with certain requirements established by law and regulations. This zone covers the distance from main gas pipelines to settlements, industrial and agricultural facilities. The distance established for the minimum distance zone is determined on the basis of various regulatory documents. Such documents include SNiP, rules and instructions of ministries and agencies, the Urban Planning Code and others. For example, Order of the Ministry of Fuel and Energy of the Russian Federation No. 176 of March 23, 2016, "On Approval of the Rules for the Location of Trunk Gas Pipelines and Oil Product Pipelines on the Land of Settlements" sets forth the requirements for the distance from gas pipelines to settlements and other objects. This order also states that the zone of minimum distances for gas pipelines should provide for the distance established in accordance with SNiP 2.05.06-85 "Gas Distribution Systems". The grounds for establishing the zone of minimum distances can also be determined on the basis of other sets of normative documents. The zone of minimum distances of the main gas pipeline shall be established in accordance with the legislation and regulations, exceptions may only be cases when the owner of the land plot or the enterprise can ensure safe operation of the gas pipeline. In such cases it is allowed to reduce the distance to the minimum value. Agricultural facilities located in the zone of minimum distances are also subject to relevant requirements and restrictions. In particular, the requirements for the location of agricultural facilities in accordance with the Town Planning Code and other regulations must be complied with
    Remote sensing data contributes to infrastructure change detection in pipeline monitoring by providing visual information on the Earth's surface. It allows for the identification of changes in pipeline routes, land use around pipelines, and potential disturbances. Information extracted includes land cover changes, encroachments, and alterations in the pipeline corridor
    High-resolution satellite imagery plays a crucial role in detecting subtle changes in pipeline infrastructure by providing detailed views of the terrain and pipeline routes. It enhances precision by allowing analysts to identify small-scale alterations, potential leaks, or encroachments that may not be visible in lower resolution imagery, supporting accurate change detection.
    Multispectral and hyperspectral imagery contribute to pipeline monitoring by capturing data in various spectral bands. Specific characteristics, such as vegetation indices, thermal information, and material composition, are valuable for assessing pipeline conditions. This data aids in detecting vegetation stress, identifying leaks, and evaluating the integrity of pipeline materials.
    Remote sensing supports early detection of potential hazards or threats to pipeline infrastructure by identifying changes in the surrounding environment. Early warning allows for preventive maintenance, enabling operators to address issues such as land subsidence, encroachments, or vegetation overgrowth before they escalate, minimizing the risk of pipeline damage and ensuring continued operation.
    The integration of GIS technology enhances infrastructure change detection in pipeline monitoring by providing a spatial context for the collected remote sensing data. It allows for spatial analysis, visualization of pipeline conditions, and decision-making based on accurate geospatial information. This integration supports effective management of pipeline assets and facilitates informed responses to detected changes.
    Change detection in Geographic Information Systems (GIS) involves identifying differences in the state of an object or phenomenon by observing it at different times. This process is crucial for various applications, such as urban development, environmental monitoring, disaster management, and agriculture. 

    Key Concepts and Techniques

    1. Definition of Change Point Detection:

      • Change Point: A point in time where a significant change occurs in the monitored data. This could be due to natural events, human activities, or technological interventions.
      • Detection Methods: Techniques used to identify these points, which can be based on statistical analysis, machine learning, or signal processing methods.
    2. Applications of Change Point Detection in GIS:

      • Environmental Monitoring: Tracking changes in land cover, deforestation, water quality, and other environmental factors.
      • Urban Planning: Monitoring urban sprawl, infrastructure development, and land use changes.
      • Disaster Management: Identifying changes caused by natural disasters such as earthquakes, floods, and hurricanes to aid in response and recovery efforts.
      • Agriculture: Monitoring crop health, detecting changes in vegetation, and managing irrigat

    Techn

    1. Statistical Methods:

      • Time Series Analysis: Analyzing data collected over time to identify trends, seasonal effects, and abrupt changes.
      • Cumulative Sum (CUSUM): A sequential analysis technique used to detect shifts in the mean level of a monitored process.
      • Bayesian Methods: Using Bayesian inference to detect change points by modeling data distributions before and after potential change points.
    2. Machine Learning Techniques:

      • Supervised Learning: Training models on labeled datasets where change points are known, and then applying these models to new data.
      • Unsupervised Learning: Clustering and anomaly detection algorithms to identify unusual patterns or deviations that indicate change points.
    3. Remote Sensing and Image Analysis:

      • Image Differencing: Subtracting pixel values of images taken at different times to highlight changes.
      • Change Vector Analysis (CVA): Measuring the direction and magnitude of change in multi-spectral imagery.
      • Principal Component Analysis (PCA): Reducing the dimensionality of image data to highlight significant changes.

    Implementation Steps

    1. Data Collection and Preprocessing:

      • Remote Sensing Data: Acquire satellite images, aerial photos, or other remote sensing data.
      • Georeferencing: Aligning the images spatially to ensure accurate comparison.
      • Radiometric Correction: Adjusting for sensor differences and atmospheric conditions to ensure consistent image quality.
    2. Change Detection Analysis:

      • Baseline Establishment: Defining a reference period or baseline data against which changes will be measured.
      • Algorithm Application: Applying chosen change detection algorithms to identify potential change points.
      • Validation and Interpretation: Validating detected change points using ground truth data or expert analysis.
    3. Visualization and Reporting:

      • Mapping Changes: Visualizing change points on maps to facilitate understanding and decision-making.
      • Reporting: Generating reports that summarize findings, trends, and implications of the detected changes.

    Challenges and Considerations

    1. Data Quality: Ensuring high-quality, consistent, and temporally matched data is crucial for accurate change detection.
    2. Algorithm Selection: Choosing the appropriate method based on the nature of the data and the type of changes being monitored.
    3. Computational Resources: Handling large datasets and complex algorithms requires significant computational power.
    4. Interpretation: Differentiating between meaningful changes and noise or artifacts in the data.
    • Accurate Monitoring:radiometric correction and georeferencing ensure the highest accuracy in data collection and analysis.
    • Real-Time Data: Support disaster management efforts with real-time data on affected areas, enabling prompt and effective response.
    • Innovative Tools: Discover the benefits of using advanced GIS tools and methods for infrastructure and environmental surveillance.

    Learn more about how our infrastructure change detection services can benefit your organization by contacting us today.

    Our infrastructure change detection services leverage advanced GIS monitoring techniques to provide accurate and timely data.
    Using state-of-the-art remote sensing and geospatial analysis, we help organizations monitor land use changes effectively.
    Our comprehensive approach includes image differencing and post-classification comparison to detect and analyze changes over time.
    We utilize satellite imagery and aerial photography to offer unparalleled insights into urban development and environmental monitoring.
    Our team specializes in radiometric correction and georeferencing to ensure the highest accuracy in infrastructure monitoring.
    Learn how our GIS tools and techniques can support disaster management efforts by providing real-time data on affected areas.
    Discover the benefits of using advanced change detection methods for infrastructure and environmental surveillance.

    Change detection is the process of identifying differences in the state of an object or phenomenon by observing it at different times. This technique is widely used in various fields, such as remote sensing, environmental monitoring, urban planning, and medical diagnostics.
  • Data Collection: Collect data at different time points. This could be satellite images, medical scans, or any other type of data that can be compared over time.
  • Preprocessing: Prepare the data for comparison. This might involve aligning images (registration), correcting for any distortions, and normalizing data to ensure comparability.
  • Comparison: Analyze the differences between the datasets. This can be done using various algorithms and techniques depending on the type of data and the changes being detected.
  • Post-processing: Interpret the differences identified and filter out any noise or irrelevant changes to focus on significant alterations.
  • Remote Sensing and Environmental Monitoring

    • Deforestation: Monitoring forest cover changes over time.
    • Urban Expansion: Tracking the growth of cities and infrastructure development.
    • Disaster Assessment: Evaluating the impact of natural disasters like floods, hurricanes, and earthquakes.

    Medical Imaging

    • Disease Progression: Monitoring the growth or reduction of tumors or other pathological changes.
    • Treatment Effectiveness: Assessing how a patient responds to a particular treatment over time.

    Security and Surveillance

    • Intrusion Detection: Identifying unauthorized access or movement within a secured area.
    • Border Control: Monitoring changes in border regions for illegal activities.

    Agriculture

    • Crop Monitoring: Tracking the growth stages and health of crops.
    • Pest Infestation: Detecting areas affected by pests or diseases.
  • Image Differencing: Subtracting pixel values of one image from another to highlight changes.
  • Change Vector Analysis (CVA): Measuring the magnitude and direction of changes in multi-dimensional data.
  • Principal Component Analysis (PCA): Reducing the dimensionality of the data to identify significant changes.
  • Machine Learning: Using supervised or unsupervised learning techniques to classify changes and predict future trends.
  • Time-Series Analysis: Analyzing patterns and trends over a sequence of data points collected at regular intervals.
  • Noise and Variability: Distinguishing between significant changes and noise or variations due to external factors.
  • Data Quality: Ensuring the data is accurate and consistent across different time points.
  • Scalability: Handling large datasets efficiently, especially in applications like remote sensing.
  • Interpretation: Correctly interpreting the changes detected, which may require domain-specific knowledge.
  • Let's consider an example of using remote sensing data to detect deforestation. The process might involve:

    1. Collecting satellite images of a forest area at different times.
    2. Preprocessing the images to correct for any atmospheric distortions and align them accurately.
    3. Applying an image differencing technique to highlight areas where the forest cover has decreased.
    4. Using a threshold to classify significant changes and filtering out noise.
    5. Post-processing the results to generate maps and reports for further analysis and decision-making.

    Change detection is a powerful tool that enables us to monitor and understand dynamic processes in various fields, providing critical insights for decision-making and problem-solving.

    Let's consider a detailed example of change detection in remote sensing, specifically for monitoring deforestation in a tropical rainforest.

    Example: Change Detection in Remote Sensing for Deforestation

    Objective

    To monitor and quantify deforestation in a tropical rainforest area over a period of time using satellite imagery.

    Steps Involved

    1. Data Collection:

      • Obtain satellite images of the rainforest from two different time points (e.g., January 2020 and January 2023).
      • Use high-resolution images from sources such as Landsat, Sentinel, or commercial satellites like PlanetScope.
    2. Preprocessing:

      • Image Registration: Align the two images to ensure they cover the exact same geographic area.
      • Radiometric Correction: Adjust for differences in lighting conditions, atmospheric effects, and sensor differences to ensure consistency.
      • Normalization: Normalize the images to make them comparable by adjusting for any variations in acquisition conditions.
    3. Comparison:

      • Image Differencing: Subtract the pixel values of the January 2020 image from the January 2023 image. This helps to highlight areas where significant changes have occurred.
      • Thresholding: Apply a threshold to the differenced image to classify pixels as changed or unchanged. For instance, a significant decrease in vegetation indices (like NDVI) can indicate deforestation.
      • Change Vector Analysis (CVA): Use CVA to quantify the magnitude and direction of changes in multi-dimensional space, providing more detailed information on the type and extent of changes.
    4. Post-processing:

      • Noise Filtering: Remove noise by applying filters to eliminate false positives due to clouds, shadows, or sensor noise.
      • Classification: Use machine learning algorithms to classify the detected changes into categories such as deforestation, reforestation, or other land-use changes.
      • Validation: Validate the results using ground truth data or additional high-resolution imagery to ensure accuracy.
    5. Interpretation and Reporting:

      • Generate maps and reports highlighting the areas of deforestation.
      • Calculate the area of deforested land and compare it to previous years to assess trends.
      • Provide actionable insights for conservation efforts, policy-making, and monitoring compliance with environmental regulations.

    Results

    By following these steps, you would obtain a clear picture of how much forest cover has been lost over the three-year period. The results might show specific regions within the rainforest that have experienced significant deforestation, helping to identify hotspots for illegal logging or areas needing urgent conservation efforts.

    Visualization

    You can create visual representations such as:

    • Change Detection Maps: Highlighting areas of significant vegetation loss.
    • Graphs and Charts: Showing the rate of deforestation over time.
    • Reports: Summarizing findings with statistical data and geographical information.

    Real-World Application

    This method is extensively used by organizations like NASA, the European Space Agency (ESA), and environmental NGOs to monitor forests worldwide. For example, the Global Forest Watch platform uses similar techniques to provide real-time data on forest changes, aiding in global efforts to combat deforestation and protect biodiversity.

    Change detection in remote sensing for deforestation provides crucial information for environmental monitoring and helps guide effective conservation strategies.

    Licenses

    Warranty

    We guarantee 100% quality of services. Cooperating with GEO Innoter specialists, you exclude risks and losses!

    Our partners