Satellite monitoring & UAV Monitoring is the monitoring of changes on Earth using remote sensing methods (change detection). It is a system of regular observations from space, airborne and ground-based remote sensing, aimed at monitoring the condition of territories and objects, analyzing ongoing processes on the Earth's surface, and timely detecting changes through remote sensing techniques. Space monitoring involves regular acquisition of information about the state of the Earth's surface from space-based platforms.

Land Use and Land Cover (LULC) is a division in Earth observation practices that focuses on analyzing land use and industrial-economic infrastructure (land cover) objects.

Types of territory remote monitoring include:

  • Baseline monitoring (provides data on the state of the land at the start of monitoring)
  • Periodic monitoring (provides data on the state of the land for a specific period - month, quarter, year)
  • Operational monitoring (provides data on the current state of the land)

Purposes of Satellite monitoring & UAV Monitoring

Satellite imagery and space monitoring are increasingly being used in various industries, including government, regional, and municipal planning and management. Space monitoring enables the acquisition of data over extensive territories and inaccessible areas, which is practically unattainable through ground surveys.

Satellite monitoring & UAV Monitoring allows for the timely detection of environmental changes, assessment of dynamics and quality of changes, and the study of interactions between technological systems at regional and object levels.

For local-level monitoring, the use of drone and UAV imagery is recommended.

In recent years, a combined monitoring approach using both satellite imagery and drone imagery has gained wide popularity.

To achieve sustainable development (ESG), it is essential to monitor the ongoing land use processes and changes in industrial-economic infrastructure over a specific period of time. For sustainable urban development and the prevention of haphazard city growth, urban development agencies need to create planning models that optimize the use of available land.

LULC maps play a crucial role in planning, management, and monitoring programs at the local, regional, and national levels. This information provides a better understanding of land use aspects and contributes to the formulation of policies and programs necessary for development planning.

Работник

Objectives and Tasks of Satellite monitoring & UAV Monitoring

Objective of Satellite monitoring & UAV Monitoring: To create a system for monitoring land changes in the area of interest using remote sensing methods (change detection) and improve decision-making based on situation assessment.

Tasks of Satellite monitoring & UAV Monitoring: Conduct Land Use and Land Cover (LULC) classification of the territory. The most commonly used approaches include:

  • Extracting LULC characteristics and habitat environment from multispectral satellite and aerial/UAV images.
  • Unsupervised classification (performed by software).
  • Supervised classification (human-guided).
  • Image segmentation.
  • Creating and updating topographic maps, plans, and other cartographic products for LULC analysis.
  • Situation assessment of the area for a specific time period, including the analysis of change dynamics.
  • Territorial changes monitoring over 2-7 years.
  • Agricultural research and vegetation phase determination.
  • Monitoring changes in water resources.
  • Industrial-environmental monitoring.
  • Administrative and territorial management, urban and land cadastre changes, infrastructure.
  • And more.

Advantages of Using Remote Sensing Data

  • Satellite imagery provides high- and very-high-resolution images over extensive territories, ensuring a high level of detail in the obtained data.
  • Continuous and repetitive acquisition of information on qualitative and quantitative characteristics of natural and anthropogenic objects and processes with precise geographic referencing through the processing of remote sensing data.
  • Operational monitoring using satellite imagery enables the remote acquisition of real-time information about the situation on the ground, addressing the "human factor" effectively.
  • Objective and up-to-date information about the territory of Russia and other countries without limitations.
  • High frequency of image acquisitions.

LULC mapping cannot be achieved without the assistance of other geospatial datasets. Geospatial data includes not only maps and locations of land use and vegetation cover (LULC), but also numerous data attributes such as socio-economic data from population censuses.

Advancements in the use and accessibility of multi-temporal satellite and aerial (UAV) data, local environmental data, or other thematic raster data contribute to their wider use in environmental modeling.

LULC remote sensing provides synoptic information and point-based indexing (using 12 main indices) of land conditions, particularly vegetation growth conditions (primarily crops), over large geographic areas, almost in real-time.

Importantly, remote sensing methods do not require prior information about vegetation or land use types. They are independent of the people living on the land being studied, making remote sensing a more reliable method compared to paper-based reports.

The data obtained from high- and very-high-resolution satellite imagery for change detection can be obtained more quickly as they may already be available in the archives of the satellite operator, eliminating the need for coordination with government agencies for new acquisitions.

Change detection materials obtained from aircraft or UAV platforms possess high visual informativeness and excellent measurement properties but require more time for image acquisition due to the need for flight permission coordination, aircraft (UAV with operators) deployment to the survey area, and higher (multiple) cost per 1 km2 of data. For change monitoring, multiple acquisitions throughout the year are necessary. Therefore, it is reasonable to execute this approach once a year to confirm the satellite imagery data.

Prices for services

Consultation Free
Preliminary analysis Free
Aerospace imaging The cost of remote sensing materials is calculated individually for each order and may vary. Minimum cost starts from $0.5 per 1 km2.
Execution time Execution of a new imaging task takes at least 5 working days from the moment of prepayment. Execution time may be extended for significant areas and challenging climatic conditions in the area of interest. Delivery of archival data takes approximately 3 days.

The cost of the aerospace imaging depends on the area size, quality requirements, and the type of the final product, such as orthophotoplan, CMM, CMR, 3D model, the need for thematic processing, etc. The cost is calculated individually for each customer.

The cost of execution is calculated on an individual basis, taking into account a specific of task.

After receiving the task description, we calculate the cost and send you a commercial offer.

Period of execution

Agreement on requirements for remote sensing materials: 1 to 5 days*
Contract signing: 1 to 5 days*
Ordering the imaging task (task assignment to the satellite operator): 5 days**
Receiving archival remote sensing materials: 3 days**
Thematic processing of remote sensing materials (if necessary): 15 days*
TOTAL TIME: 15 days

* working days
** from the date of receiving 100% advance payment

The timeline for aerospace imaging depends on the total area of the territory, imaging requirements, and the final product. It is calculated individually for each customer.

How to place an order:

  1. STEP 1: Submit an application on the website with the following information:
    • Description of the task requiring the use of land change monitoring materials or objects obtained through satellite or aerial/drone imagery;
    • Location of the object of interest (coordinates, district or region name, shapefile, etc.);
    • Requirements for the frequency of imaging;
    • Requirements for the imaging period (period for which archival data can be used or the need for new imaging);
    • Requirements for imaging quality (viewing angles, ground resolution, cloud cover, sun angle, panchromatic, multispectral, hyperspectral, lidar imaging, etc.);
    • Deadline for the delivery of final materials.
  2. STEP 2: Technical task and cost coordination:
    • Selection of the remote sensing source and imaging schedule;
    • Formats for delivering the results;
    • Technical requirements for remote sensing materials;
    • Additional requirements for output data (if necessary);
    • Final cost of the work and completion timeline.
  3. STEP 3: Contract signing and commencement of work:
    • Completion within 5 working days from the date of receiving 100% advance payment - payment is accepted only through non-cash transactions.

We work with individuals, legal entities, individual entrepreneurs, government and municipal authorities, foreign clients, etc.

Need for consultation?

Fill the form and we will contact you

By clicking the «Send» button, you give your consent to the processing of your personal data, in accordance with Federal Law No. 152-FZ of July 27, 2006 «On Personal Data», on the conditions and for the purposes specified in the Consent to the processing of personal data.

Stages of service provision

Stage 0 (Pre-contract stage):

  • Agreement on the task requiring the use of imaging materials.
  • Evaluation of the technical feasibility of solving the Client's task through remote sensing methods.
  • Determination of the monitoring area, parameters, and frequency of imaging.
  • Selection of the remote sensing source.
  • Determination of the timeline and types of work.

RESULT: Possibility (YES/NO) of providing the service


Stage 1 (Pre-contract stage):

  • Agreement with the client on the remote sensing data source.
  • Agreement with the client on additional requirements for monitoring results.
  • Agreement with the client on requirements for additional geospatial sources for LULC (Land User and Land Cover) mapping.
  • Agreement with the client on the format of data delivery.
  • Final determination of the labor and material costs, agreement on the timeline and cost of the work.

RESULT: Signed contract


Stage 2 (Contract execution):

  1. Receipt of advance payment (100%) for the order and purchase of remote sensing data.
  2. Execution of aerospace imaging, complying with the timing parameters and requirements for remote sensing materials.
  3. Thematic processing of data (if necessary).
  4. Delivery of materials to the client.

RESULT: Set of data obtained from the satellite imaging.

The result of the provision of services

Creation of the final product based on the imaging materials:

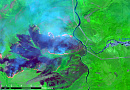
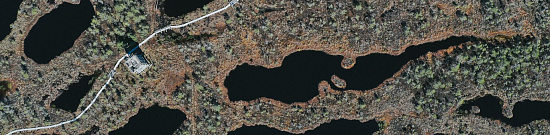
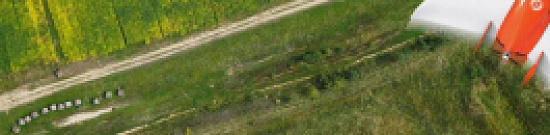
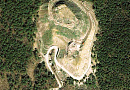
  • Archival images of various types: black and white, color, multispectral, synthesized over the monitoring period, according to the Client's requirements.
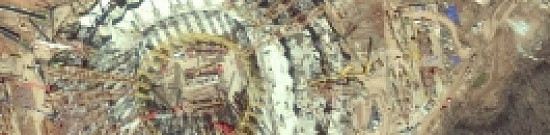
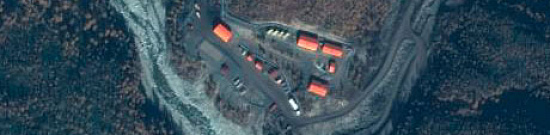
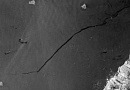
  • Materials from new imaging of various types.
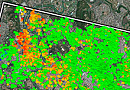
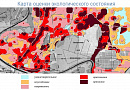
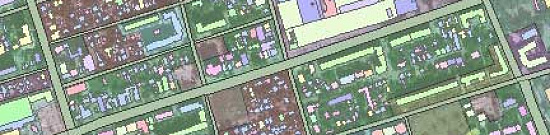
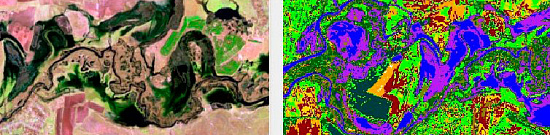
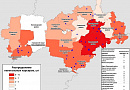
  • Thematic LULC maps.
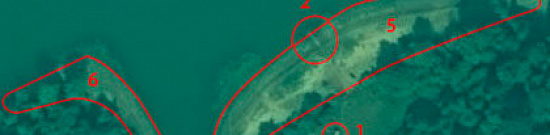
  • Results of LULC analysis in agreed-upon indices and formats.

GEO INNOTER provides the Client who requested the imaging materials with the final product according to the Technical Task on electronic media or via the Internet through FTP servers.


Requirements for Source Data

Accurate coordinates of the area of interest, precise requirements for remote sensing materials (spatial resolution, imaging type, maximum image tilt angle, minimum solar angle, imaging period), additional requirements for the final product (if necessary), output data formats.

If it is not possible to provide the specified information, provide information about the intended use of the remote sensing materials, and the specialists of GEO INNOTER will analyze the requirements and propose the optimal solution.

Related services

Satellite imagery. Satellite data
Find out the price
Digital orthoimagery (Orthorectification)
Find out the price
Satellite Imagery as evidence in legal proceedings
Find out the price
Aerial & UAV imagery
Find out the price
Remote sensing imagery Interpretation & spectral analysis
Find out the price
Thematic mapping. Thematic map
Find out the price
Судебная экспертиза
Судебная экспертиза
Find out the price
Заказ космической съемки. Космоснимки
Find out the price
Создание ортофотопланов
Find out the price
Составление тематических и специальных карт, планов
Find out the price
Дешифрирование данных дистанционного зондирования Земли (ДЗЗ)
Find out the price
Аэрофотосъемка (АФС / БПЛА)
Find out the price
Zazulyak Evgeny Leonidovich
The material was checked by an expert
Zazulyak Evgeny Leonidovich
Engineer, 28 years of experience, Education - Moscow Topographic Polytechnic Technical School, St. Petersburg Higher Military Topographic Command School named after Army General A.I. Antonov, Military Engineering University named after V.V. Kuibyshev. Kuibyshev Military Engineering University.

Customers

FAQ

  • The task that needs to be addressed using the images;
  • Area of interest (location / coordinates of the object in any convenient format, and the area of the object);
  • Date or time interval for which archival imagery can be considered or new imagery can be acquired;
  • Requirements for the imaging (image tilt angle, solar angle, spatial resolution, imaging type, cloud cover, tolerance for snow cover).

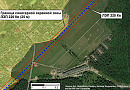
  • As a rule, the minimum area for ordering archival satellite images is 25 km2, and for a new satellite survey, it is 100 km2. The minimum strip width (distance between two closest points) depends on the satellite operator, survey mode, and product, and can range from 2 to 5 km.

Land User and Land Cover – «Land use and land cover (soil cover)»

Selected examples:
  • Urban or developed land (Residential / Commercial and other services / Industrial areas / Communications and utilities / Mixed urban or developed land)
  • Agricultural land (Arable land and pastures / Gardens, groves, vineyards, nurseries and ornamental garden plots)
  • Grassland (Grassland / Shrub and bush pasture / Mixed pasture)
  • Forest fund lands (Deciduous forests / Evergreen forest land / Mixed forests)
  • Water Resources (Rivers / Streams and Canals / Lakes / Reservoirs / Bays)
  • etc.
The study of land cover is part of broad scientific programs of many countries, e.g. UN, NASA, ESA, etc. to monitor the Earth's vital signs from land, air and space, using a multitude of satellites and instruments (sensors), including the International Space Station to better understand our home planet.
Monitoring of changes in the territory of license areas is a comprehensive system of regular observations of the state of land and the environment, collection of information, assessment and forecasting of spatial and temporal changes in the state of environmental components under the influence of natural and anthropogenic factors within the boundaries of the licensed subsoil area during the development, development, operation and liquidation of deposits
  • Timely identification of changes in land and environmental conditions within the boundaries of the licensed area.
  • Identification of accumulated environmental damage, determination of the extent of its spread, and potential sources of negative impact.
  • Evaluation of the dynamics of environmental changes within the boundaries of the licensed areas.
  • Assessment of changes in land conditions, forecasting, and development of recommendations for preventing and mitigating the consequences of negative processes.
  • Organization of data collection, transmission, processing, systematization, and storage of information on land and environmental conditions.
  • Monitoring changes in the condition of industrial facilities, intra-field pipelines, exploration wells, and other infrastructure objects whose location is lost; identification of objects in non-design positions.
  • Control over compliance with land use conditions - correlating the actual boundaries of industrial facilities with the boundaries stipulated in land allocation acts, and identifying unregistered objects for inventory and cadastral registration of real estate.
  • Monitoring the condition of slurry barns, monitoring the pace of slurry barn reclamation, and the condition of slurry reservoirs and slurry processing plants.
  • Monitoring the integrity of spoil heaps, embankments, hydraulic structures, and roads within licensed areas.
  • Inventory of flare systems for associated petroleum gas combustion, monitoring the volume of gas burned.
  • Inventory of common mineral extraction sites, the condition of their extraction areas to ensure industrial and environmental safety.
  • Identification and control of additional industrial activities at the field - power line installation, selective and clear-cut logging, monitoring the condition of access roads, subcontractor activities.
  • Monitoring the environment within licensed areas (deforestation, oil spills, etc.).
Satellite monitoring plays a crucial role in environmental surveillance by capturing various types of data, including imagery, thermal data, and spectral information. Satellites provide a wide-scale view of the Earth's surface, enabling monitoring of land cover changes, deforestation, urban growth, and environmental conditions.
UAVs, or drones, are employed for monitoring purposes in applications such as agriculture, infrastructure inspection, and disaster response. They offer advantages over traditional methods by providing high-resolution, real-time data, accessibility to hard-to-reach areas, and the ability to customize flight paths for specific monitoring needs.
Satellite monitoring aids disaster management by providing rapid and comprehensive assessments of disaster-affected areas. Satellites capture imagery before and after a disaster, facilitating damage assessment, identification of impacted regions, and helping to plan effective emergency responses.
Multispectral and hyperspectral sensors on satellites and UAVs capture information beyond what the human eye can see. These sensors measure specific wavelengths of light, enabling the monitoring of vegetation health, identifying stress factors, and assessing environmental changes based on unique spectral signatures.
Satellite and UAV monitoring in precision agriculture involves capturing detailed data on crop health, soil conditions, and irrigation needs. This information helps farmers optimize resource usage, increase crop yields, and make informed decisions about fertilization, pest control, and overall farm management.
Satellite monitoring involves the use of satellites orbiting the Earth to gather data and information about various aspects of the planet's surface, atmosphere, and oceans. 
Weather satellites monitor atmospheric conditions, cloud cover, temperature patterns, and other meteorological parameters. They provide data for weather forecasting, climate research, and monitoring of severe weather events. Examples include the NOAA GOES (Geostationary Operational Environmental Satellite) series and the European Meteosat satellites.
Environmental monitoring satellites track changes in the Earth's environment, including deforestation, desertification, pollution, and biodiversity loss. They provide data for environmental management and conservation efforts. Examples include the NASA/USGS Landsat series and the European Copernicus program's Sentinel satellites.
Earth monitoring satellites are spacecraft specifically designed and equipped to observe and collect data about the Earth's surface, atmosphere, oceans, and other environmental features. These satellites utilize various sensors and instruments to capture data in different wavelengths of electromagnetic radiation, including visible light, infrared, microwave, and radio waves.

Satellite fire monitoring involves the use of satellite technology to detect, track, and monitor wildfires across the globe. These satellites are equipped with sensors capable of detecting various aspects of wildfires, including heat signatures, smoke plumes, and changes in land surface temperature. Here's how satellite fire monitoring typically works:

  1. Detection: Satellites equipped with thermal sensors can detect heat signatures associated with wildfires. These sensors measure the infrared radiation emitted by the Earth's surface, allowing them to identify areas of intense heat, such as active fires. When a fire occurs, the satellite detects the increased temperature in the affected area.

  2. Imaging: Satellites capture images of the Earth's surface, including areas affected by wildfires. Optical sensors onboard satellites can provide high-resolution images of smoke plumes, burned areas, and the spread of fires. These images help assess the extent and severity of wildfires.

  3. Monitoring: Satellites continuously monitor wildfires over time, providing valuable information on their behavior, growth, and movement. By tracking changes in fire intensity and spread, satellite data can help firefighters and emergency responders make informed decisions about resource allocation and evacuation efforts.

  4. Mapping: Satellite imagery is used to create maps of wildfire-affected areas, including burned scars and fire perimeters. These maps are essential for assessing damage, estimating the impact on ecosystems and communities, and planning post-fire recovery and rehabilitation efforts.

  5. Early Warning: Satellite fire monitoring systems can provide early warning of potential wildfire outbreaks by detecting signs of ignition, such as hotspots or unusual heat patterns. This early detection allows for prompt response and mitigation measures to prevent fires from spreading out of control.

  6. Integration with Ground-based Data: Satellite data is often integrated with ground-based observations, weather forecasts, and other sources of information to enhance the accuracy and effectiveness of wildfire monitoring and management.

Several satellite systems and programs are dedicated to fire monitoring, including:

  • NASA's MODIS (Moderate Resolution Imaging Spectroradiometer) and VIIRS (Visible Infrared Imaging Radiometer Suite) instruments, which provide daily observations of wildfires worldwide.
  • ESA's (European Space Agency) Sentinel-2 and Sentinel-3 satellites, which offer high-resolution optical and thermal imagery for fire detection and monitoring.
  • Commercial satellite companies such as Maxar Technologies, Planet Labs, and Airbus, which provide satellite imagery and monitoring services for wildfire management.

Overall, satellite fire monitoring plays a crucial role in wildfire management and helps protect lives, property, and ecosystems from the devastating effects of wildfires.

Satellite groundwater monitoring is a method of assessing and tracking groundwater resources using satellite-based technology. Groundwater is a critical natural resource that provides drinking water for billions of people and supports various ecosystems and agricultural activities. Here's how satellite groundwater monitoring typically works:

  1. Remote Sensing: Satellites equipped with remote sensing instruments, such as radar and optical sensors, collect data on the Earth's surface and subsurface characteristics. These sensors can penetrate the Earth's surface to some extent, allowing them to detect changes in soil moisture and groundwater levels.

  2. Interferometric Synthetic Aperture Radar (InSAR): InSAR is a technique that uses radar waves emitted by satellites to measure ground deformation with high precision. By comparing radar images acquired at different times, scientists can detect changes in land surface elevation caused by groundwater extraction or recharge.

  3. Gravity Recovery and Climate Experiment (GRACE): The GRACE satellite mission, operated by NASA and the German Aerospace Center (DLR), used a pair of satellites to measure variations in Earth's gravity field. Changes in groundwater storage affect the mass distribution on Earth's surface, which in turn causes slight variations in the gravity field. GRACE data can thus be used to estimate changes in groundwater storage over large regions.

  4. Thermal Infrared Imaging: Thermal infrared sensors onboard satellites can detect subtle changes in land surface temperature, which can be indicative of groundwater discharge areas, such as springs and seeps. By analyzing thermal imagery over time, scientists can identify patterns related to groundwater flow and discharge.

  5. Integration with Ground-based Data: Satellite observations are often combined with ground-based measurements from wells, boreholes, and other monitoring stations to calibrate and validate the satellite data. Ground-based data provide detailed information on groundwater levels, quality, and hydrological characteristics at specific locations.

  6. Modeling and Analysis: Scientists use hydrological models and data assimilation techniques to integrate satellite observations with groundwater models. These models simulate the movement of groundwater within aquifers and can be used to estimate groundwater recharge rates, depletion rates, and future trends under different scenarios.

Satellite groundwater monitoring offers several advantages, including its ability to provide large-scale and continuous coverage of groundwater resources, even in remote or inaccessible areas. It can also complement traditional ground-based monitoring efforts by providing information on regional groundwater dynamics and trends. However, satellite-based techniques may have limitations in areas with dense vegetation or complex geological conditions that can interfere with remote sensing measurements. Ongoing advancements in satellite technology and data processing techniques are continuously improving the accuracy and reliability of satellite groundwater monitoring methods.

Satellite agriculture monitoring involves the use of satellite technology to observe, analyze, and manage agricultural activities and resources. This approach offers numerous benefits, including improved crop management, resource optimization, and early detection of issues such as drought, pests, and diseases. Here's how satellite agriculture monitoring typically works:

  1. Crop Health Monitoring: Satellites equipped with multispectral or hyperspectral sensors capture images of agricultural fields in different wavelengths of light. These images can reveal valuable information about crop health, including vegetation vigor, chlorophyll content, and stress levels. By analyzing these images, farmers and agronomists can identify areas of the field that may require attention, such as nutrient deficiencies, water stress, or pest infestations.

  2. Yield Estimation: Satellite imagery can be used to estimate crop yields by monitoring crop growth and development throughout the growing season. By tracking changes in vegetation indices such as NDVI (Normalized Difference Vegetation Index), scientists can make predictions about crop productivity and potential harvest yields. This information can help farmers make informed decisions about crop management practices, planting schedules, and marketing strategies.

  3. Crop Type Mapping: Satellite imagery can differentiate between different types of crops based on their spectral signatures. This capability enables the mapping of crop types at a regional or global scale, providing valuable information for agricultural planning, land use management, and crop rotation strategies. Crop type maps can also be used to monitor changes in land cover over time and assess the impact of land use changes on ecosystems and biodiversity.

  4. Soil Moisture Monitoring: Satellites equipped with microwave sensors can measure soil moisture content across large areas of agricultural land. Soil moisture data is crucial for optimizing irrigation scheduling, managing water resources, and mitigating the effects of drought. By monitoring changes in soil moisture levels over time, farmers can adjust their irrigation practices to ensure efficient water use and maximize crop yields.

  5. Pest and Disease Detection: Satellite imagery can detect changes in vegetation health caused by pests, diseases, or other stressors. By analyzing these images, farmers can identify areas of the field that may be affected by pest infestations or disease outbreaks and take appropriate action, such as applying pesticides or implementing integrated pest management strategies.

  6. Field Boundary Mapping: Satellite imagery can be used to delineate field boundaries and track changes in land use and land cover over time. Accurate mapping of field boundaries helps farmers optimize field operations, monitor crop rotations, and comply with agricultural regulations and subsidy programs.

Overall, satellite agriculture monitoring provides valuable insights and decision support tools for farmers, agronomists, policymakers, and other stakeholders involved in agricultural production and land management. By harnessing the power of satellite technology, agriculture can become more efficient, sustainable, and resilient in the face of environmental challenges.


Satellite crop monitoring is a method of using satellite imagery and data to observe and analyze agricultural fields and crops from space. This technology provides valuable insights into crop health, growth, and development, allowing farmers, agronomists, and policymakers to make informed decisions about crop management, resource allocation, and food security. Here's how satellite crop monitoring typically works:

  1. Remote Sensing: Satellites equipped with optical and/or radar sensors capture images of agricultural fields in various wavelengths of light, including visible, near-infrared, and microwave. These images provide detailed information about crop characteristics, such as vegetation vigor, biomass, and moisture content.

  2. Vegetation Indices: Vegetation indices, such as the Normalized Difference Vegetation Index (NDVI) or Enhanced Vegetation Index (EVI), are derived from satellite imagery to assess crop health and vigor. These indices quantify the amount of photosynthetically active vegetation in a given area and can indicate stress, disease, or nutrient deficiencies in crops.

  3. Crop Growth Monitoring: Satellite imagery is used to monitor crop growth and development throughout the growing season. By tracking changes in vegetation indices over time, farmers can assess crop progress, identify growth stages, and predict potential yields. This information helps optimize crop management practices, such as irrigation, fertilization, and pest control.

  4. Yield Estimation: Satellite data can be used to estimate crop yields by correlating vegetation indices with ground-based yield measurements. By analyzing satellite imagery and historical yield data, farmers and policymakers can make predictions about crop productivity, plan harvest schedules, and assess overall food production trends.

  5. Field Boundary Mapping: Satellite imagery is used to delineate field boundaries and track changes in land use and land cover over time. Accurate mapping of field boundaries helps farmers optimize field operations, monitor crop rotations, and comply with agricultural regulations and subsidy programs.

  6. Pest and Disease Monitoring: Satellite imagery can detect changes in crop health caused by pests, diseases, or other stressors. By analyzing these images, farmers can identify areas of the field that may be affected by pest infestations or disease outbreaks and take appropriate action, such as applying pesticides or implementing integrated pest management strategies.

  7. Drought Monitoring: Satellite data is used to monitor soil moisture levels and assess drought conditions in agricultural regions. By tracking changes in soil moisture over time, farmers can anticipate water stress, adjust irrigation practices, and mitigate the impact of drought on crop yields.

Overall, satellite crop monitoring provides valuable information for optimizing agricultural production, enhancing food security, and promoting sustainable land management practices. By leveraging the capabilities of satellite technology, farmers and stakeholders can make data-driven decisions to improve crop yields, minimize environmental impact, and ensure the long-term viability of agricultural systems.


Ocean monitoring satellites are critical tools for observing and studying various aspects of the world's oceans. They provide data on sea surface temperatures, sea level rise, ocean color, and marine ecosystems, among other variables. Here are some key points and examples of ocean monitoring satellites:

Key Functions of Ocean Monitoring Satellites

  1. Sea Surface Temperature (SST):

    • SST is crucial for understanding weather patterns, climate change, and marine ecosystems. Satellites equipped with radiometers can measure the temperature of the ocean surface with high precision.
  2. Sea Level Rise:

    • Satellites with altimeters measure the height of the ocean surface, providing data on sea level rise, which is a critical indicator of climate change.
  3. Ocean Color and Chlorophyll:

    • Ocean color sensors measure the amount of chlorophyll in the water, indicating the health and productivity of marine phytoplankton, the base of the marine food web.
  4. Wave Heights and Ocean Currents:

    • Synthetic Aperture Radar (SAR) and scatterometers provide data on wave heights and ocean surface winds, which help in understanding ocean currents and their effects on global climate.
  5. Ice Monitoring:

    • Satellites monitor sea ice extent and thickness, providing data crucial for understanding polar climate and its global implications.

Examples of Ocean Monitoring Satellites

  1. Sentinel-6 Michael Freilich:

    • Part of the European Union's Copernicus program, Sentinel-6 is designed to measure sea level rise and improve weather forecasting and climate monitoring.
  2. Jason-3:

    • A collaboration between NASA, NOAA, CNES (France's space agency), and EUMETSAT (European Organization for the Exploitation of Meteorological Satellites), Jason-3 measures sea surface height, ocean currents, and wave height.
  3. Aqua:

    • Part of NASA's Earth Observing System (EOS), Aqua carries instruments that measure sea surface temperature, ocean color, and the water cycle.
  4. Suomi National Polar-orbiting Partnership (Suomi NPP):

    • A joint mission by NASA, NOAA, and the Department of Defense, Suomi NPP provides data on sea surface temperature, ocean color, and other environmental variables.
  5. Copernicus Sentinel-3:

    • This mission includes two satellites, Sentinel-3A and Sentinel-3B, which measure sea surface topography, sea and land surface temperature, and ocean color.

Importance and Applications

  • Climate Monitoring:

    • Long-term data from ocean monitoring satellites is essential for understanding climate change and its impacts on global sea levels, weather patterns, and marine ecosystems.
  • Weather Forecasting:

    • Accurate and timely data on sea surface temperatures and ocean currents improve weather prediction models.
  • Marine Biology:

    • Monitoring ocean color and chlorophyll concentrations helps scientists track the health of marine ecosystems and predict events like algal blooms.
  • Disaster Response:

    • Satellites provide critical data for responding to natural disasters such as hurricanes and tsunamis by monitoring ocean conditions in real-time.
  • Navigation and Fisheries:

    • Data on ocean currents and sea surface temperatures assist in navigation and optimizing fishing operations.

Ocean monitoring satellites are indispensable for understanding and managing the Earth's oceans, providing data that supports environmental protection, resource management, and scientific research.

Licenses

Warranty

We guarantee 100% quality of services. Cooperating with GEO Innoter specialists, you exclude risks and losses!

The availability of qualified personnel able to work with specialized equipment, software and experience allows us to provide these guarantees!

Our partners