A report on the environmental status of the territory, dynamics and forecast maps, GeoTIFF and vector layers of identified objects.
Search the site
What the service is used for
Environment observation
Observation of the state of the environment.
Pollution data
Formation of information on the current state of the external environment and the degree of its pollution.
Anthropogenic impact
Large-scale observations of anthropogenic impact factors.
Change forecast
Forecasting trends in the state of the natural environment.
Sources of impact
Identification of anthropogenic impact sources and organisation of observation of them.
Did not find your task?
Describe the site coordinates, type of monitoring and analysis dates — we will assess the remote sensing archive and the scope of work.
What you will receive as a result of the work
01
Environmental status report
A report on the environmental status of the territory, presentation materials; text materials are delivered electronically and in printed form.
Based on the work, a report on the environmental status of the territory is delivered. Forensic imagery analysis of the environmental status of the territory can be performed on the basis of the study.
What you get
- a report on the environmental status of the territory
- presentation materials
- text materials in electronic and printed form
The report composition and delivery form are fixed in the contract and the terms of reference.
02
Dynamics and forecast maps
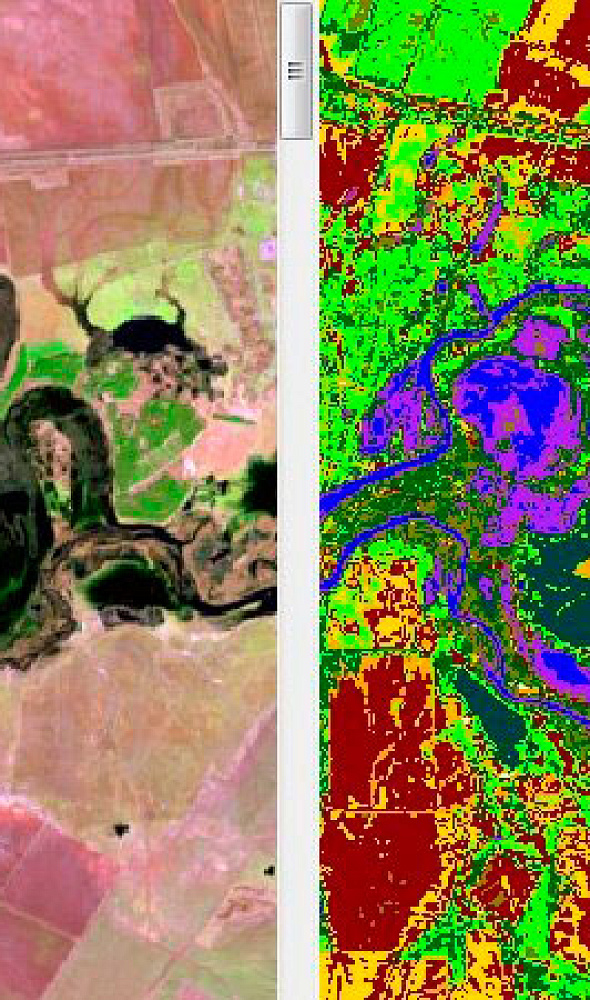
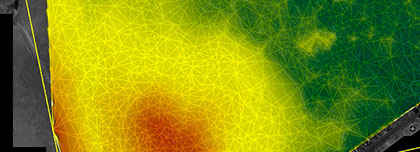
Special maps of the dynamics and forecast of natural processes; environmental and schematic maps per the terms of reference.
Environmental maps reflect habitat conditions and their dynamics. The purpose of mapping is to analyse the situation: spatial and temporal variability of factors affecting ecosystems. Schematic environmental maps are created at scales of 1:25 000 and smaller.
What you get
- special maps of the dynamics and forecast of natural processes
- an environmental map or a layer for GIS display
- schematic environmental maps for engineering and environmental surveys
Map content and scale depend on the terms of reference and the size of the work area.
03
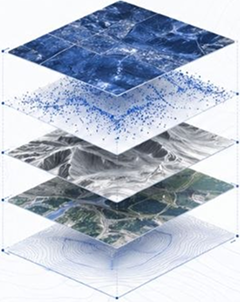
GeoTIFF and vector layers
A georeferenced TIFF (GeoTIFF) and vector layers of identified objects in Mid/Mif format.
Results are delivered on electronic media or via FTP. One of the results is a database for display as a GIS layer.
What you get
- a georeferenced GeoTIFF
- vector layers of identified objects in Mid/Mif format
- a database for a GIS layer
Formats and the coordinate system are agreed in the terms of reference.
How the work goes
Cost and timeline
The cost depends on the area and type of environmental observation and is calculated individually for each customer.
- consultation — free of charge
- image selection, preliminary analysis — free of charge
- image order — from 300 to 600 US dollars per image (the number of frames depends on the area)
- work of technical specialists — from 70 000 rubles (calculated individually)
- report preparation — from 50 000 rubles (calculated individually)
- total in the table and the card — from 120 000 rubles (calculated individually)
- timeline in the card — from 20 days; in the order steps — from 20 working days from receipt of a 100% advance; overall in the schedule block — from 20 working days
- agreement of issues and images to be used — from 1 to 15 working days; contract signing — from 1 to 3 days
- receipt of images — from 1 to 5 days from the 100% advance date (timelines increase for a new survey)
- image processing — from 10 to 35 days; in-depth automated analysis of remote sensing data — from 1 to 20 days
- analysis of collected information and assessment of the environmental situation — from 1 to 5 days; report preparation — from 2 to 15 days
- in the order steps: 100% advance, payment by bank transfer only; images are paid separately (very high resolution from 300–600 USD); specialist work from 70 000 RUB
- in the FAQ: 100% prepayment on the invoice for remote sensing materials after the contract is signed, the rest of the payment after completion
Order cost — from 120 000 ₽
Timeline — from 20 working days
Consultation and image selection — free of charge
What data is needed for a quote
To assess feasibility, cost and timeline, provide:
- object location (coordinates, cadastral number, district or region name, shapefile)
- type of environmental monitoring
- dates for which the analysis is needed
- survey period requirements: archival data or a new survey
- whether environmental monitoring has already been carried out in this territory
- if available — images with the required acquisition time, spatial resolution, spectral bands and source georeferencing by RPC
If the listed information cannot be provided, specify the intended use of the remote sensing materials — specialists will analyse the requirements and propose an option.
Describe the site, survey period and task — we will assess the archive and the scope of work.
Why Innoter
Prompt access to archives
Suitable archive imagery can be obtained faster when the required area and date are already available from operators.
No aviation clearances
A new satellite survey does not require the flight clearances typical of aerial surveys.
Large and remote areas
A single satellite pass covers large areas and makes it possible to work in hard-to-reach regions.
Direct agreements with operators
Distributor agreements help select archival imagery and order new surveys from different suppliers.
Software and server infrastructure
Modern software and computing capacity for quality control and processing of large data volumes.
Experienced specialist team
Many years of experience in complex projects and specialists in cartography, photogrammetry and remote sensing.
Monitoring levels, maps and source data
The composition depends on the observation level, area, archive or new survey, and requirements for thematic maps.
1
Environmental monitoring is comprehensive observation of the state of the environment, natural ecosystems and components of the natural environment, assessment and forecast of changes.
Observation covers all components: soil and water resources, the air environment, biological resources and mineral resources. Environmental components include air, water, mineral and energy resources, bioresources and soils.
2
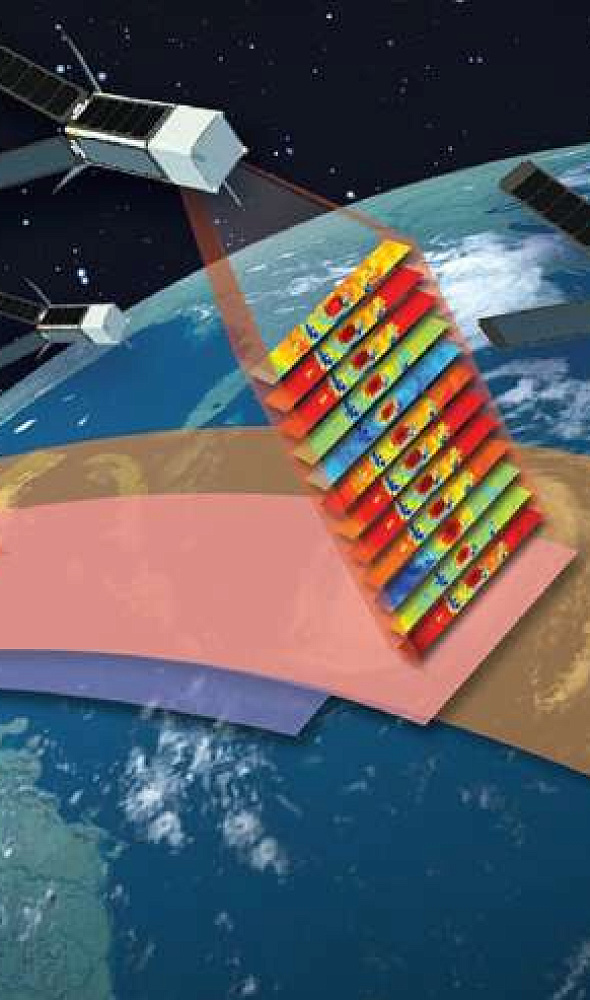
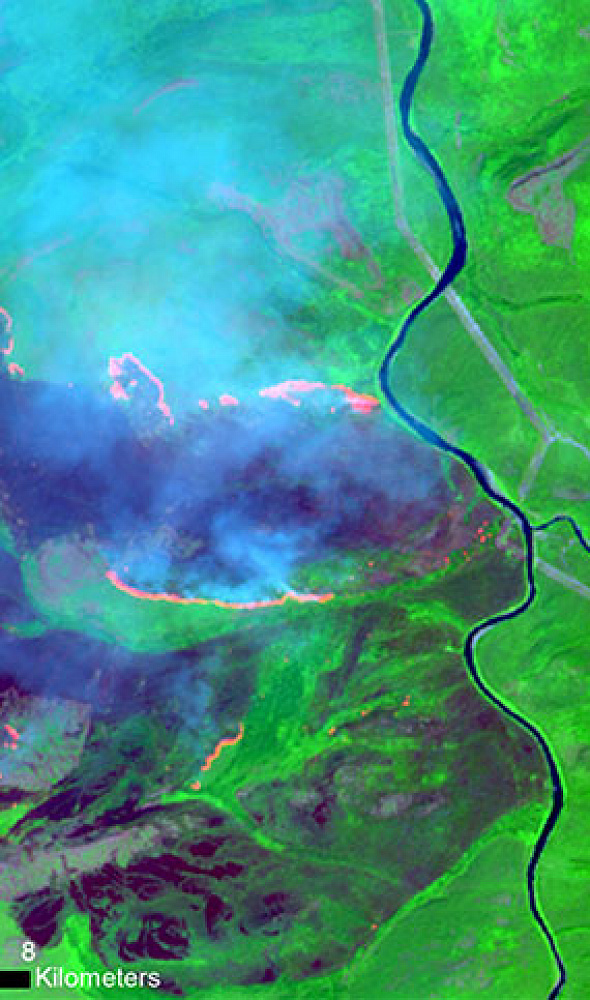
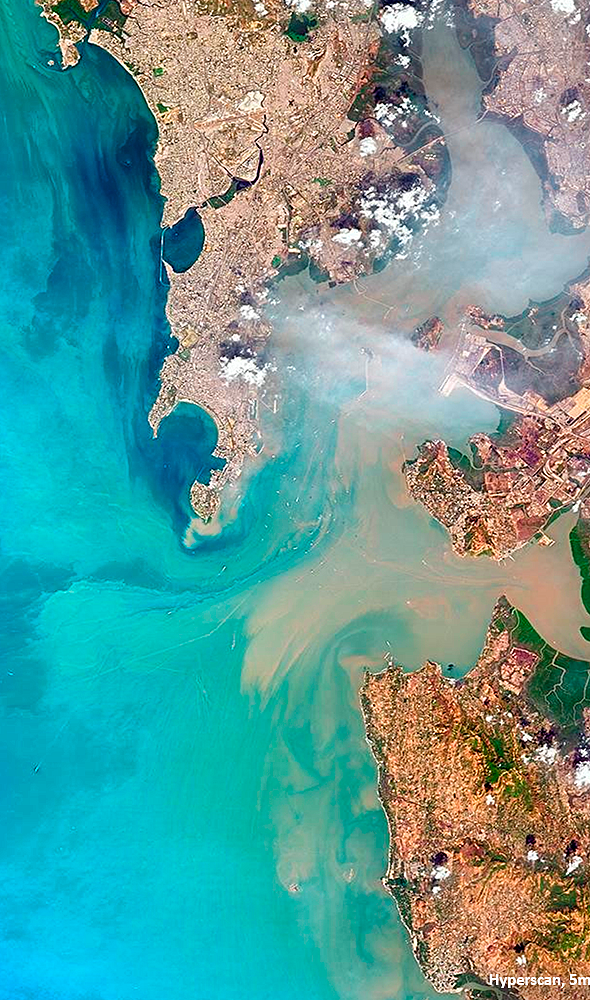
Spaceborne remote sensing from satellite images makes it possible to promptly detect the foci and nature of environmental changes; cover large, including hard-to-reach, territories at one moment in time; and almost continuously track changes and the dynamics of ecological processes.
Satellite survey materials are the main source of environmental maps: multi-aspect interpretation, a unified photogrammetric base, simultaneity of source information, shorter data-collection times and the ability to re-record the state of natural complexes.
3
Remote sensing using UAVs makes it possible to promptly detect the foci and nature of changes on small areas of the Earth's surface. It is appropriate for local environmental monitoring — monitoring the impact of a specific anthropogenic source. Territories are surveyed in minutes instead of several months with traditional methods.
4
Environmental maps include maps that reflect habitat conditions and their dynamics, the relationships of biocenoses with the environment, and ecological factors that determine the conditions of existence of organisms.
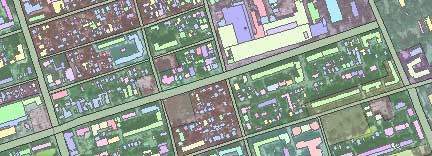
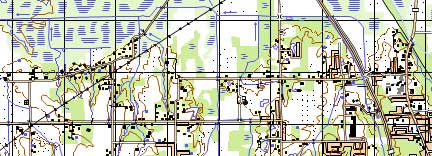
Schematic environmental maps are created during environmental monitoring and engineering and environmental surveys for the design and construction of oil and gas facilities, at scales of 1:25 000 and smaller. The base is topographic maps adapted to the study area. The schematic shows the hydrographic network, built-up lines, protection zones, site boundaries, roads, settlements and utilities, and sources of emissions or pollution.
5
Exact geographic coordinates of the object in the required coordinate system are needed. Images — by acquisition time, spatial resolution, required spectral bands and source georeferencing by RPC.
If the information cannot be provided, it is enough to specify the intended use of the remote sensing materials: specialists will analyse the requirements and propose an option.
6
The main legal documents that define the tasks and procedure of environmental monitoring are:
- Federal Law No. 7-FZ of 10.01.2002 (as amended on 30.12.2021) “On Environmental Protection”.
- Decree of the Government of the Russian Federation No. 681 of 09.08.2013 (as amended on 30.11.2018) “On state environmental monitoring (state monitoring of the environment) and the state data fund of state environmental monitoring”.
Separate provisions apply to individual types of monitoring (for example, subsurface condition monitoring: the Regulation approved by Order of the Ministry of Natural Resources of Russia No. 433 of 21.05.2001).
7
The purpose of environmental observation is prompt tracking of anthropogenic and non-anthropogenic changes in the state of the environment.
Tasks: observation of the state of the environment; formation of data on the current state and degree of pollution; large-scale observations of anthropogenic impact factors; trend forecasting; identification of anthropogenic impact sources and observation of them; forecasting and control of natural disasters and man-made accidents.
Frequently asked questions
Answers to key questions about service parameters, timelines, deliverable formats and workflow. If you did not find what you need — contact us and we will help.
- Location of the object of interest (coordinates, district name, region, shapefile, etc.);
- Requirements for the survey period (period for which archive data can be used or the need for a new survey);
- Whether environmental monitoring has been conducted in this area;
100% prepayment on the invoice for RS materials after signing the contract, the rest of the payment after execution.
Monitoring is a multi-level system. In the chronological aspect, the following systems (or subsystems) are usually distinguished: detailed, local, regional, national, and global levels.
Local systems can be combined into larger systems, such as regional monitoring systems, which cover territories of regions within a territory or several regions. These regional monitoring systems, by integrating data from observation networks with different approaches, parameters, monitoring areas, and frequencies, allow for comprehensive assessments of territory conditions and provide forecasts of their development.
Regional monitoring systems can be further combined within a country into a unified national (or state) monitoring network, forming a national level of monitoring. An example of such a system was the "Unified State System of Environmental Monitoring of the Russian Federation" (UGSEMR) and its territorial subsystems, which were successfully created in the 1990s to address the tasks of territory management adequately. However, in 2002, the UGSEMR was abolished along with the Ministry of Ecology, and currently, Russia only has departmentally scattered observation networks, which do not allow for adequate resolution of strategic territory management tasks considering environmental imperatives.
Global monitoring is a system of monitoring and forecasting possible changes in global processes and phenomena, including anthropogenic impacts on the Earth's biosphere as a whole. Currently, the full-scale creation of such a system, operating under the auspices of the United Nations, remains a task for the future, as many countries do not yet have their own national systems.
The global environmental and resource monitoring system is intended to address global ecological problems across the entire Earth, such as global warming, ozone layer preservation, earthquake prediction, forest conservation, global desertification and soil erosion, floods, food and energy resource reserves, etc. An example of such a subsystem of environmental monitoring is the global seismic monitoring network of the Earth, operating within the framework of the International Program for Earthquake Foci Control.
At the regional level, the monitoring approach is based on the fact that pollutants, when released into the environment, disperse and become part of the substance cycle in the biosphere. As a result, changes occur in the main components of the biosphere: abiotic and biotic components.
Local monitoring involves studying the space of one source under the influence of a group of enterprises in an industrial zone or a municipal entity (city, district).
Environmental control is an activity of state bodies, enterprises and citizens on observance of environmental norms and rules. There is a distinction between state, industrial and public environmental control.
The environmental monitoring system should accumulate, systematize, and analyze information:
- about the state of the environment;
- about the reasons for observed and probable changes in the state (i.e., about sources and impact factors);
- about the admissibility of changes and loads on the environment as a whole;
- about the existing reserves of the biosphere.
Thus, the environmental monitoring system includes observations of the state of elements of the biosphere and observations of sources and factors of anthropogenic impact.
In accordance with the given definitions and functions assigned to the system, monitoring involves three main directions of activity:
- Observations of influencing factors and the state of the environment;
- Assessment of the actual state of the environment;
- Forecasting the state of the surrounding natural environment and evaluating the predicted condition.
The information about the state of the environment obtained in the environmental monitoring system is used by the management system to prevent or eliminate negative environmental situations, assess the adverse consequences of environmental changes, as well as to develop forecasts for socio-economic development, design programs in the field of environmental development, and environmental protection.
One of the important components of the regional environmental monitoring system is monitoring of soil horizon condition for contamination with pesticides and heavy metals. The importance of this type of observation is explained by the fact that soils are significantly involved in the life activity of plants, animals and humans. The interaction of soils with human economic activity, expressed through various types of construction and agricultural production, motor vehicles leads to the accumulation of toxic chemicals. Monitoring studies of soils are necessary to determine the changes that occur with soils in order to identify and prevent negative processes that lead to their chemical and mechanical degradation
According to natural components, geological, atmospheric, hydrological, geophysical, soil, forest, biological, geobotanical, zoological are distinguished. Atmospheric air monitoring is a system for observing the state of atmospheric air, its pollution and natural phenomena occurring in it, as well as the assessment and forecast of the state of atmospheric air, its pollution. Other component monitoring can be defined similarly.
Subsystems of environmental monitoring differ by objects of observation. Since the components of the environment are air, water, mineral and raw material and energy resources, bioresources, soils, etc., the monitoring subsystems corresponding to them are distinguished. However, monitoring subsystems do not have a unified system of indicators, unified zoning of territories, unity in the frequency of monitoring, etc., which makes it impossible to take adequate measures in managing the development and environmental condition of territories. Therefore, when making decisions, it is important to focus not only on the data of "private systems" of monitoring (hydrometeorological, resource, socio-hygienic, biota, etc.), but to create integrated environmental monitoring systems on their basis.
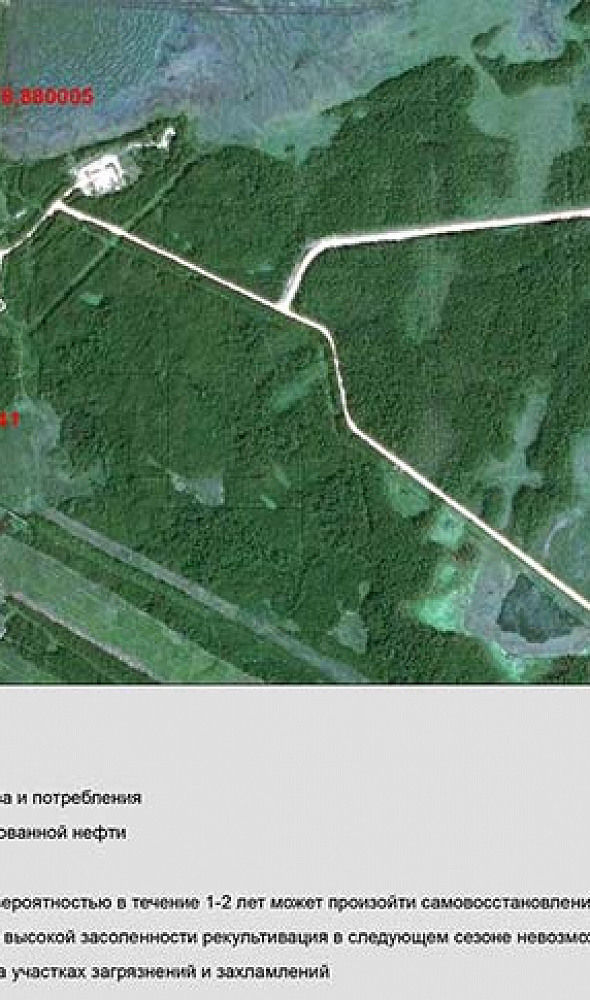
emissions of pollutants into the atmosphere by industrial, energy, transport and other industries leading to the release of hazardous substances into the atmosphere and spills of liquid pollutants and hazardous substances, etc.
monitoring the impact of environmental factors on the health of the population.
The main objects of research are small (local) rivers and lakes.
When sampling, special attention should be paid to the fact that water sampling should be carried out 15 - 30 cm below the water table. This is due to the fact that the surface film is a boundary medium between air and water and the concentration of most pollutants (pollutants) in it is 10-100 or more times higher than in the water column itself. The pollution of stagnant water bodies can be judged by bottom sediments. When sampling, it is important to consider the season in which the sampling takes place.
When sampling, special attention should be paid to the fact that water sampling should be carried out 15 - 30 cm below the water table. This is due to the fact that the surface film is a boundary medium between air and water and the concentration of most pollutants (pollutants) in it is 10-100 or more times higher than in the water column itself. The pollution of stagnant water bodies can be judged by bottom sediments. When sampling, it is important to consider the season in which the sampling takes place.
According to the Law, environmental expertise is based on the principle of presumption of potential environmental danger of any planned economic or other activity. This means that the customer (the owner of the proposed activity) is obliged to forecast the impact of the proposed activity on the environment and justify the permissibility of this impact. The customer is also obliged to provide for the necessary measures to protect the environment, and it is the customer who has the burden of proving the environmental safety of the proposed activity. Foreign experience testifies to the high economic efficiency of environmental expertise. The U.S. Environmental Protection Agency carried out a sample analysis of environmental impact statements. In half of the cases studied, the total cost of projects was reduced due to the implementation of constructive environmental protection measures. According to the International Bank for Reconstruction and Development, the possible increase in project costs associated with environmental impact assessments and subsequent incorporation of environmental constraints into working projects pays for itself in an average of 5-7 years. According to Western experts, the inclusion of environmental factors in the decision-making process at the design stage turns out to be 3-4 times cheaper than the subsequent one before the installation of treatment equipment. Today, the network of observations of sources of impact and the state of the biosphere covers the entire globe. The Global Environment Monitoring System (GEMS) was created by joint efforts of the world community (the main provisions and objectives of the program were formulated in 1974 at the First Intergovernmental Meeting on Monitoring).
The organization of monitoring of environmental pollution and the factors causing its impact was recognized as the primary task.
Translated with www.DeepL.com/Translator (free version)
covers the development and use of means, systems and methods of observation, assessment and development of recommendations and controlling influence in the natural-technogenic sphere, forecasts of its evolution, energy-ecological and technological characteristics of the production sphere, medical-biological and sanitary-hygienic conditions of human and biota existence. The complexity of environmental problems, their multidimensionality, their close connection with the key sectors of the economy, defense and ensuring the protection of health and welfare of the population requires a unified systematic approach to solving the problem. Monitoring in general is created to prevent various environmental problems as well as the destruction of ecosystems.
Translated with www.DeepL.com/Translator (free version)
The term "monitoring" first appeared in the recommendations of the Special Commission of SCOPE (Scientific Committee on Problems of the Environment) of UNESCO in 1971, and then environmental monitoring was considered at the 1972 Stockholm Conference of the United Nations Organisation on the Environment.

Need satellite imagery or help choosing the right data?
Describe your task, area of interest, and desired outcome. We will check data
availability, assess new acquisition options, and propose the optimal solution in terms of timelines, cost,
and quality.
Discuss the project
clients who trust us
25+ years in the geodata market