A displacement map, models of vertical and horizontal deformations, a report and proposals for regular monitoring.
Search the site
What the service is used for
Mineral deposits
Monitoring of ground deformation and displacement at mineral deposits.
Urban structures
Observation of structure deformations in cities.
Critical industrial facilities
Monitoring of critical industrial facilities.
Pipelines
Pipeline monitoring.
Roads and railways
Monitoring of roads, railways and other facilities.
Did not find your task?
Send the site coordinates, questions and analysis dates — we will assess the radar archive and the scope of work.
What you will receive as a result of the work
01
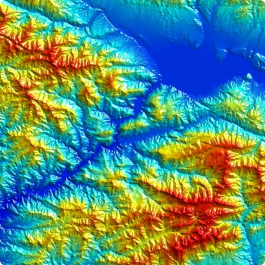
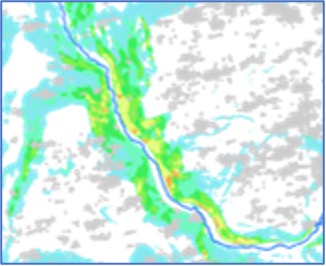
Displacement map
Ground displacement map: displacements of the surface and structures as of each survey date — in visual and numerical form.
Maps are provided in pdf, GeoTIFF and contour (shp) formats. Displacement maps for each direction, including the horizontal component, can additionally be calculated.
What you get
- a displacement map of the ground surface and structures for each survey date
- visual and numerical representation of displacements
- pdf, GeoTIFF and contour shp formats
The map composition and set of survey dates are fixed in the contract and the terms of reference.
02
Displacement models
Digital models of vertical and horizontal (west–east) displacements of the ground surface, as well as of objects and structures.
Models are built by radar differential interferometry for the customer's areas of interest over the period of spaceborne radar surveys.
What you get
- vertical displacement models of the ground surface, objects and structures
- horizontal displacement models (west–east)
- results for the period of spaceborne radar surveys
The horizontal component and set of directions are calculated if included in the terms of reference.
03
Interferometry and report
Results of interferometric processing of radar satellite surveys and a technical report.
The report includes models of displacements of the ground surface, objects and structures that occurred over the survey period, and a description of the processing method.
What you get
- results of interferometric processing of radar surveys
- technical report
- if required — a conclusion on the link between the changes and economic activity
The list of analysis parameters and the report form are fixed in the contract and the terms of reference.
04
Regular monitoring
Proposals for organising targeted regular spaceborne radar displacement monitoring by radar differential interferometry.
The results are used to complement and verify traditional geodynamic and geodetic monitoring, control linear facilities, calibrate deposit models, control underground gas storage, assess infrastructure stability and the impact of new construction.
What you get
- proposals for regular radar monitoring of sites, objects and structures
- a basis for risk control of linear facilities
- assessment of the territory at the design stage, including from archival satellite images
The regular monitoring programme is agreed separately after analysis of the first survey series.
How the work goes
Cost and timeline
The cost depends on the site area, type and number of images, terrain, work season and whether the customer provides materials.
- consultation — free of charge
- image selection, preliminary analysis and preparation of the terms of reference — free of charge
- radar image order: free satellite images and/or commercial ones (minimum cost from 1000 USD per scene, minimum of 5 scenes); if the customer does not provide their materials or free images cannot be used
- work of technical specialists and expert(s) — from 1 000 000 RUB
- total cost — from 1 000 000 RUB; card guide — from 1 000 000 RUB
- timeline in the card — 20 days; in the schedule block and order steps — from 20 working days from the advance-payment date
- the timeline depends on the total area of interest, availability of archival remote sensing materials or a new survey, requirements for remote sensing materials and the end product, and work complexity
- cost also depends on the area of interest, survey type (archival / new, free / paid), number and quality of images, terrain complexity, seasonality, advance size and whether materials must be purchased
- in the order steps: study from 1 000 000 RUB; images are paid separately (one radar image from 1000 USD); payment by bank transfer only
Total cost — from 1 000 000 ₽
Timeline — from 20 working days
Consultation and preliminary analysis — free of charge
What data is needed for a quote
To assess feasibility, cost and timeline, provide:
- exact geographic coordinates of the object in the required coordinate system (specialists will refine coordinates provided in any convenient form)
- location of the study object and the questions to be addressed
- dates for which the analysis is needed
- a set of multi-temporal images (at least 12 depending on the task) or consent to select an archive or a new survey
- size, terrain character and product creation requirements
If the listed information cannot be provided, describe the plot, the task and the period — specialists will analyse the need and propose an option.
Describe the territory, questions and analysis dates — we will assess the radar archive and the scope of work.
Why Innoter
Prompt access to archives
Suitable archive imagery can be obtained faster when the required area and date are already available from operators.
No aviation clearances
A new satellite survey does not require the flight clearances typical of aerial surveys.
Large and remote areas
A single satellite pass covers large areas and makes it possible to work in hard-to-reach regions.
Direct agreements with operators
Distributor agreements help select archival imagery and order new surveys from different suppliers.
Software and server infrastructure
Modern software and computing capacity for quality control and processing of large data volumes.
Experienced specialist team
Many years of experience in complex projects and specialists in cartography, photogrammetry and remote sensing.
Radar interferometry, source data and regulations
The composition depends on the area, archive or new survey, number of scenes and requirements for displacement models.
1
Monitoring of displacements and deformations of the ground surface and structures is performed by interferometric processing of multi-pass radar images of the same territory with the same technical parameters and imaging geometry.
Radar interferometry detects displacements of the ground surface and objects on it with centimetre accuracy for the Earth's surface and several millimetres for buildings and structures from spaceborne radar images.
2
The radar interferometry method provides millimetre measurement accuracy over large areas, comparable to GPS monitoring, without expensive field infrastructure.
The method is used for timely detection of shifts above underground mining areas; mapping deformations of pit walls and benches; monitoring natural and man-made displacements of buildings and structures; monitoring critical industrial facilities, pipelines, roads and railways.
3
Use of radar images in mining:
- identification of deformation zones on the ground surface;
- observation of subsidence and displacements of the ground surface in undermined territories;
- observation of deformations of buildings and structures;
- observation of the stability of pit walls, benches and dumps;
- observation of hydraulic dumps and tailings storage facilities, including protective structures;
- observation of mining transport equipment at open pits;
- environmental monitoring of reclaimed land.
4
Exact geographic coordinates of the object in the required coordinate system and a set of multi-temporal images (at least 12 depending on the task) are needed.
Software: GIS — QGIS, ArcGIS and others; processing — ERDAS, ENVI SARscape, SNAP and others.
The monitoring period may range from a pair of images (differential interferometry D-InSAR) to several months and years (persistent scatterer interferometry).
5
Work is carried out in accordance with SNiP, GOST and SP, using specialised software. The source lists:
- Federal Law “On Subsoil” of 21.02.1992;
- Federal Law “On Industrial Safety of Hazardous Production Facilities” of 21.07.1997;
- “Instruction on the procedure for approving measures to protect buildings, structures and natural objects from the harmful effects of mining”, RD 07-113-96, Gosgortekhnadzor;
- customer regulations.
6
The results are used to complement and verify traditional geodynamic and geodetic monitoring technologies; risk monitoring and control of linear facilities (bridges, pipelines, above-water crossings); calibration of deposit models; control of underground gas storage; ensuring mining safety; assessing infrastructure stability; assessing the territory when designing new facilities, including from archival satellite images; controlling the impact of new construction on existing infrastructure.
Frequently asked questions
Answers to key questions about service parameters, timelines, deliverable formats and workflow. If you did not find what you need — contact us and we will help.
Seismic monitoring provides information that is a short-term precursor to the oncoming deformation of rocks at local sites. Space monitoring provides information in the long term about the processes occurring both in local observation sites and over a large area. Thus, these methods do not exclude, but complement each other.
The main advantage is that space monitoring can cover large areas. At medium and large fields, there are long geodetic lines with thousands of reference points. As a rule, they are surveyed once or twice a year at each point where a reference is laid. Thus, information on displacements is available at intervals of once a year or once in a week. During this time, deformation may develop outside of the Customer's control. Space radar monitoring allows the site to be evaluated on a monthly basis.
The main data extracted from a radar survey are amplitude and phase. Repeated radar survey allows to determine phase differences caused, for example, by shifts of the earth's surface. Such shifts can be identified when processing radar survey data in specialized software products using various methods. The principal advantage of radar interferometry over other methods of monitoring vertical and lateral deformations is the direct measurement of differences in relief that occurred between two (three, five) surveys. The resulting interferometric displacement file usually shows an integral picture of displacements.
On the present day, there is no method that can guarantee the prediction of ground surface collapse. There are criteria for the occurrence of such catastrophes, some of which (such as ground surface displacement rate, its spatial gradient, displacement acceleration) can be assessed using data from spaceborne radar imaging. In combination with other methods (repeated leveling, satellite geodesy, seismic monitoring), radar imaging allows for obtaining comprehensive and systematic information about ground surface displacements, evaluating the mentioned criteria, and spatially identifying hazardous areas.
The number of satellites, the quality and variety of the data received are increasing, the technical characteristics of imaging systems and methods of processing the data received are being improved, and new software for processing data from remote sensing radar satellites is constantly being updated and developed.
Geodetic monitoring is a system of permanent and/or continuous observations, analysis and forecasting of the current geodynamic state of the geological environment, carried out within the specified regulations within the considered natural-technical system.
Geodetic monitoring is required in the following cases:
- During the construction, reconstruction, and restoration of buildings and structures;
- When using industrial, hydro, or energy technical facilities;
- When intervening in the geological or hydrological conditions of a site.
Geodetic monitoring is conducted during the construction of new structures or the restoration of existing ones to monitor settlement, deformation, and tilt. Permissible limits for these parameters are specified in construction codes, standards, regulations, and building rules. These limits should not be exceeded. The goal of geodetic monitoring is to track these values and prevent their exceedance.
Geodetic monitoring is performed throughout the year following the completion of construction or reconstruction works. During the observations, the following processes are monitored:
- Settlement - vertical displacement;
- Shifts - horizontal displacement;
- Tilts - deviations from the vertical.
This helps to prevent deformations, collapses, and other adverse events. If the changes do not stabilize, monitoring is extended and continued beyond the initial year.
The frequency depends on the construction and erection cycles. After completion of construction works on the site, monitoring is usually carried out until the settlement stabilizes. Geodetic monitoring cycles are usually conducted once per calendar month, in case of intensive growth of settlement the frequency of cycles can be increased up to 3 times per month (and more).
The purpose of geodetic monitoring is to obtain data on critical deviations of buildings and structures from those specified in the project, with the determination of the time interval of occurrence of these changes.
Geodetic monitoring of buildings is a periodic check for deformations, which is carried out by geodetic methods, through inspection and calculations, during the construction of buildings and structures.
- Regular monitoring of the current natural and man-made geodynamic state of the subsurface within the territory of deposits using modern high-tech equipment and efficient measurement techniques.
- Identification of patterns of occurrence and spatial-temporal development of various manifestations of natural and man-made subsurface geodynamics, including establishing the nature and mechanism of relationships between these manifestations and spatial-temporal changes in the parameters of deposit development. Conduct and systematically update the geodynamic zoning of the deposit territory (with necessary revisions as new geodynamic information is obtained), identifying potential areas of increased geodynamic risk within the deposit territory.
- Providing recommendations for optimizing the prospective placement of systems and facilities on the deposit territory to avoid potential emergency situations related to geodynamic factors.
- Systematically compile information and annual comprehensive reports with necessary attachments, recommendations, and programs for subsequent monitoring cycles.
- Quantitative assessment of the degree of modern activity of faults within the developed hydrocarbon deposit territory and adjacent areas, as well as the temporal changes in fault activity.
- Monitoring possible ground subsidence associated with deposit development (fluid extraction, reservoir pressure depletion) in the early stages of their development.
- Detection of local variations in gravity reflecting deformation processes and fluid dynamics within the geological environment occurring in the geological intervals, including potential compaction of reservoir rocks due to hydrocarbon extraction, temporal changes in reservoir pressure, and fluid withdrawal/injection balance.
- Identification of local areas with anomalous deformation processes and estimation of parameters of sources of local anomalous movements.
- Development of possible prognostic signs of hazardous geodynamic processes.
- Prediction of areas with increased geodynamic risk within the deposit territory.
Need satellite imagery or help choosing the right data?
Describe your task, area of interest, and desired outcome. We will check data
availability, assess new acquisition options, and propose the optimal solution in terms of timelines, cost,
and quality.
Discuss the project
clients who trust us
25+ years in the geodata market