Panchromatic, multispectral, hyperspectral, radar, thermal data and LiDAR: orthophotomaps, indices, DEM and 3D models.
Search the site
What the service is used for
Environment and climate
Climate, atmosphere, vegetation, hydrology; monitoring of ice caps and ice extent in the Arctic.
Weather and navigation
Forecast of events, hurricane development, icebergs and ice on the Northern Sea Route.
Maps and infrastructure
Maps and terrain models for cities, agriculture, transport and geodesy.
Natural resources
Resource optimisation, forest-fire hotspots, water pollution and sustainable environmental management.
Disasters and anthropogenic impact
Earthquakes, eruptions, floods, tsunamis; pollution, land use and cities.
Did not find your task?
Describe the territory, period and data type. A specialist will advise on survey and processing.
What you will receive as a result of the work
01
Panchromatic data
Black-and-white images of the visible spectrum with a wavelength of 400–700 nm, one channel, high spatial resolution.
WorldView-3, Pleiades and QuickBird satellites provide panchromatic data with resolution down to 30 cm on the ground. For UAV — DJI Phantom 4 Pro, senseFly eBee X, WingtraOne (2–5 cm); in aerial photography from a helicopter or aircraft — Phase One iXU-RS1000 cameras (10–20 cm). Used in mapping, urban planning and environmental monitoring.
What you get
- orthophotomaps
- digital elevation models
- classified land-use maps
The information spectrum is limited to working in the panchromatic channel only.
02
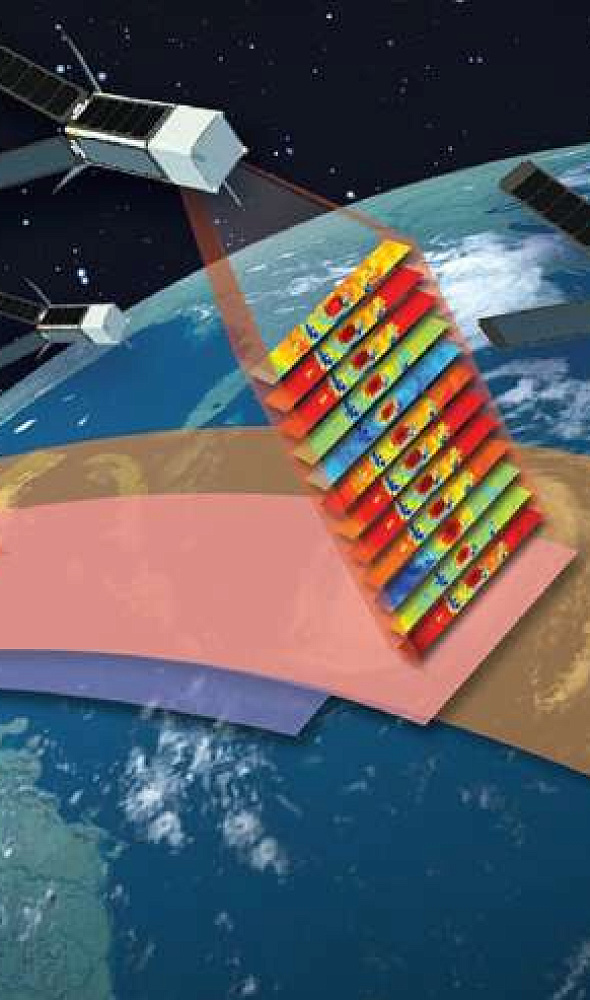
Multispectral data
Earth observation in several broad spectral bands — usually visible and infrared: vegetation cover, soils.
The best-known spacecraft are the Landsat and Sentinel-2 series. Each band gives its own surface characteristics. Products: thematic maps, vegetation indices (for example NDVI), mineral indices, land-use maps, detection of plant diseases.
What you get
- specialised thematic maps
- vegetation indices (NDVI), mineral indices, land-use maps
A larger data volume sometimes complicates processing and analysis.
03
Hyperspectral data
Measuring light in discrete spectral channels with very narrow intervals — detailed information about the Earth's surface.
Used to detect minerals, determine soil composition and analyse plant health. Spacecraft: Resurs-P, Earth Observing-1, CartoSat 3, 3A, 3B and others.
What you get
- determination of mineralogical composition
- mapping of biological species
- diagnosis of plant diseases
More complex processing is required; a larger data volume needs increased computing resources.
04
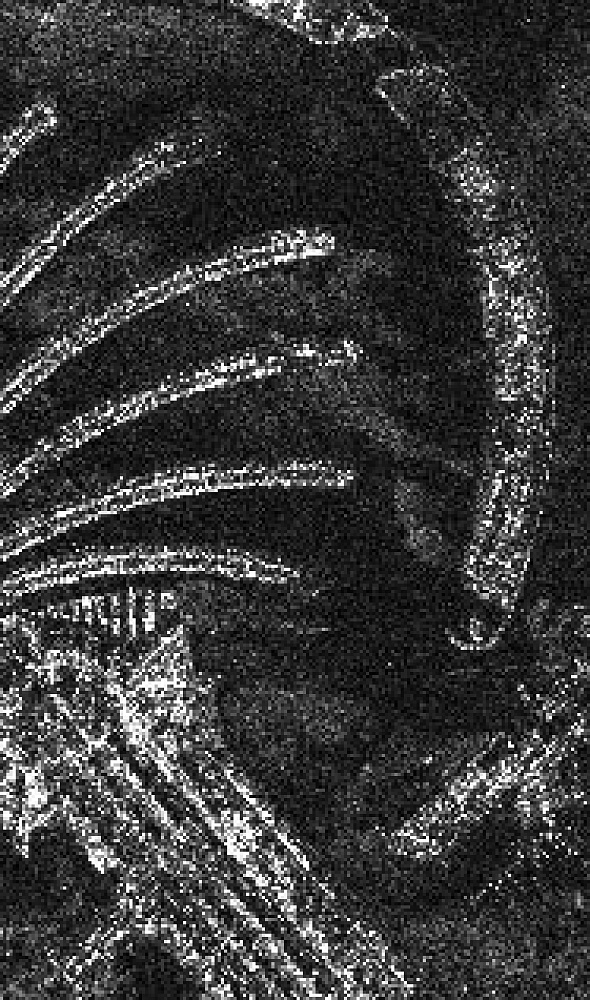
Radar data
Radar system information: emission of radio waves and measurement of reflection from objects on the Earth's surface.
Used for surface images, determining object heights, monitoring environmental changes and detecting underground structures. Main satellites: Sentinel-1, Terrasar-X/TanDEM-X/PAZ, ALOS-2. Survey is possible in different lighting and weather conditions and through cloud cover.
What you get
- radar maps and landscape change monitoring
- digital elevation and terrain models, determination of object heights
Spatial resolution is lower than that of optical sensors; electromagnetic phenomena affect quality.
05
Thermal data and LiDAR
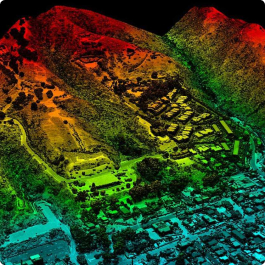
Thermal IR radiation of objects and laser ranging: thermal maps, anomalies and three-dimensional terrain models.
Landsat-8 has a thermal channel; MODIS on Terra and Aqua and Sentinel-3 provide medium-resolution thermal measurements. LIDAR builds point clouds of object heights: aerial and ground (terrestrial) acquisition; examples of space systems are GEDI on the ISS and ATLAS on ICESat-2. LIDAR processing is in ArcGIS, QGIS and cloud platforms AWS and Google Cloud.
What you get
- thermal maps, detection of thermal anomalies and temperature regime monitoring
- digital elevation models and height maps from LIDAR
Thermal data have lower resolution than optics; LIDAR has high equipment and processing cost, and distortions due to the atmosphere are possible.
How the work goes
What is needed for a quote
To select the survey and the RS data processing level, provide:
- area of the site of interest
- survey accessibility and survey period
- archival or new survey
- required spectral channels
- project budget
- requirements for spatial resolution, survey angles and processing option, if they are already known
If the survey type has not been selected yet, describing the territory and the task is enough.
A specialist will clarify the platform, sensors and data processing level.
Why Innoter
Prompt access to archives
Suitable archive imagery can be obtained faster when the required area and date are already available from operators.
No aviation clearances
A new satellite survey does not require the flight clearances typical of aerial surveys.
Large and remote areas
A single satellite pass covers large areas and makes it possible to work in hard-to-reach regions.
Direct agreements with operators
Distribution agreements help select archive imagery and order new surveys from different providers.
Software and server infrastructure
Modern software and computing capacity for quality control and processing of large data volumes.
Experienced specialist team
Years of experience on complex projects and specialists in cartography, photogrammetry and remote sensing.
Data types, sensors and processing
The composition depends on the task, survey platform, spatial resolution and spectral bands.
1
Remote sensing of the earth (RS) is a type of geospatial technology that collects samples of emitted and reflected electromagnetic radiation from terrestrial, atmospheric and aquatic ecosystems to detect and monitor the physical characteristics of an area without physical contact.
Most commonly, data collection is performed by aerial (at this stage exclusively UAVs) and satellite sensors — passive or active. Ground-based sensors are used locally and to enhance the quality of satellite and airborne data. In recent years, ground-based sensors have been included in RS, which together with space and aviation gives a new level of quality for the investigated area or object.
Passive sensors respond to external stimuli by collecting radiation that is reflected or emitted by an object or the surrounding environment. The most common source is reflected sunlight. Examples: charge-coupled devices, digital photographs and video, radiometers, hyperspectral and infrared sensors.
2
Classification by electromagnetic radiation bands: visible light, infrared and ultraviolet radiation, microwaves and radio waves. RS types are divided into active and passive and by platform type.
- Optical sensing. Visible and infrared spectrum; high spatial resolution, detailed surface images.
- Thermal. Surface thermal radiation; temperature changes, hot spots, including oil leaks.
- Radar. Radio band, penetrates clouds, coverage in various weather conditions, changes in relief and surface structure.
- Hyperspectral. Discrete wavelengths of a wide spectrum with narrow bands; high ability to distinguish surface types and substances.
3
Classification by spatial resolution type of aerospace images:
- very low (worse than 100 m);
- low (15–100 m);
- medium (5–15 m);
- high (1–2.5 m);
- very high (0.3–0.5 m);
- ultra-high (0.02–0.5 m).
Satellite imagery of medium spatial resolution (10 m) is the most popular because of the publicly available USGS and Sentinel Hub portals. Engineering works require higher-resolution data (from 0.15 m to 1 m).
4
In passive sensing, measurements are made using radiation from objects on the Earth's surface; a dedicated radiation source in the required part of the spectrum is not needed.
In active sensing, the system illuminates the surface and records the returned signal. RADAR and LiDAR sensors are typical active instruments: they measure the time delay between emission and return to establish the location, direction and speed of an object.
Collected data are processed with RS equipment and software; the most advanced solution is quasi-real-time analytical products, primarily in GIS.
5
Classification by platform: satellites, unmanned aerial vehicles or aerostats; also aerial photography from piloted aircraft.
- Satellite sensing — spacecraft for recognising surface objects, weather conditions and other parameters; wide scale of studies, monitoring and mapping. Optimal survey area >100 km², spatial resolution 0.25 m to 10 m.
- Aerial photography — a camera on board an aircraft, helicopter or other piloted platform. Optimal area 50–1000 km², resolution 0.1 m to 1.5 m.
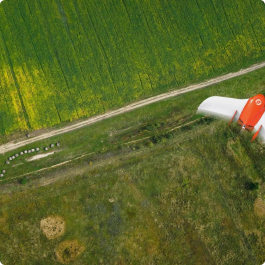
- UAV survey — aerial photography without a person on board; monitoring of fields, forests, timber industry areas. Highest spatial resolution: 0.02 to 1 m. Optimal area <100 km².
On all three platforms the source lists sensors: multispectral, hyperspectral, thermal, radar, LIDAR (laser scanning).
Image cost per area benchmarks (USD) from the source table: UAV — 200 (1 km), 500 (5 km), 1 250 (25 km), 1 750 (50 km), 3 000 (100 km); satellite — 200 (25 km), 500 (50 km), 1 000 (100 km), 10 000 (1000 km), 70 000 (10 000 km); piloted aviation — 6 250 (50 km), 10 000 (100 km), 40 000 (1000 km), 150 000 (10 000 km). Dashes in the table were left unfilled. These are image cost benchmarks, not a price list for delivery and processing services.
6
Data quality is determined by spatial, spectral, radiometric and temporal resolution. The customer's tasks determine the choice of sensor characteristics.
- Spatial resolution — raster pixel size; usually square areas with a side from 0.15 to 1000 m. For satellite sensors it reaches 15–25 cm; aerial and UAV — down to 3–5 cm; ground LiDAR survey — down to 3–5 mm.
- Spectral — the number of recorded bands. Panchromatic, multispectral, superspectral and hyperspectral images are used. RGB is enough for a background; for vegetation and impermeable surfaces — NIR or thermal IR. MODIS — 36 spectra (0.4–14.4 µm); Landsat 8/9 — 10 (up to 11 with Cirus); WorldView-2/3 — 9 bands. WV3 data are in the highest demand.
- Radiometric — usually 8–14 bits (256 grey levels up to 16 384 intensities in each band), depends on sensor noise.
- Temporal — the frequency of passes over the same territory. In military applications down to 15 min, in civilian 1–2 hours; seasonal — annual (archive); an archive for in-depth study of changes may be ten years old.
Raw data are referenced to ground control; photogrammetry is important. Radiometric correction (pixel scale to actual brightness), topographic correction in mountains and atmospheric haze correction may be required. The rule is to supply weather conditions for the date and time of survey.
7
RS data processing levels were first defined by NASA in 1986; the definition and technology are used in global standardisation, and changes are approved at the UN. Primary processing (from raw images to georeferencing to a coordinate system) is levels 0–3, then thematic processing: more than 250 domains, expanded every year. The main product is analytics. The most requested domains are military, agriculture and construction.
Raw data (in 80% of cases images from RS sensors), processed data (RS products, usually in a GIS shell) and analytical data — information on an industry, task or military system. The two main types of spatial data are geometric and geographic; common storage formats are vector (points, lines, polygons; shapefiles) and raster (pixel grid, orthoimage).
The share of map creation from RS data in 2021 is 60% (in 2000 — 95%); the data are also used in BIM, SMART, IoT, OutDoor/InDoor.
8
RS applications and services are used in science, ecology, geography, agriculture, urban planning, transportation and other industries.
- Environmental studies: climate, atmosphere, surface, vegetation, hydrology; satellite data track ice caps and the shrinking ice area in the Arctic.
- Weather analysis and forecasting: hurricane development, evacuation; tracking icebergs and ice on the Northern Sea Route.
- Maps and terrain models for urban development, agriculture, transport infrastructure and geodesy.
- Natural resource monitoring: forest fires, water pollution, sustainable environmental management.
- Climate change: ice cover, sea level, surface temperature; assessment of Antarctic ice melt.
- Disaster warning: earthquakes, eruptions, floods, tsunamis.
- Ecosystems: forest degradation, biodiversity, restoration.
- Anthropogenic impact: air and water pollution, land use, cities and infrastructure, greenhouse gas emissions.

Frequently asked questions
Answers to key questions about service parameters, timelines, deliverable formats and workflow. If you did not find what you need — contact us and we will help.
Spatial data is any type of data that relates directly or indirectly to a specific geographic area or location. Now more commonly referred to as geospatial data or geospatial information, spatial data can also numerically represent a physical object in a geographic coordinate system.
However, the concept of geospatial data is much more than a spatial component such as maps.
One should realize that there is raw data (80% of it is imagery) obtained from remote sensing sensors, processed data (remote sensing products, usually in a GIS shell) and analytical data - information, clues about a particular industry, task or military system.
There is a huge difference between data and information. Data is raw, voluminous, and often useless. On the other hand, information is power. Information is useful to the end user and helps make informed decisions that can be the difference between success and failure.
Speaking from the perspective of the geospatial industry, remote sensing analytics companies represent the difference between data and information. Using powerful algorithms, they can transform large amounts of data into information that is used by organizations of all sizes and shapes to make decisions.
Users can store spatial data in a variety of formats, as it can contain more than just location data. Analyzing this data allows for a better understanding of how each variable affects individuals, communities, populations, territories, facilities, etc.
There are several types of spatial data, but the two main types of spatial data are geometric data and geographic data.
Geometric data is a type of spatial data displayed on a flat two-dimensional surface. An example of this could be the geometric data found in floor plans. Google Maps is an application that utilizes geometric data to determine precise directions. In fact, this is one of the simplest examples of spatial data usage in action.
Geographic Referencing and Geocoding
Similar processes, geographic referencing, and geocoding are important aspects of geospatial analysis. Both geocoding and geographic referencing involve aligning data to the real world using appropriate coordinates, but the similarity ends there.
Geographic referencing focuses on assigning coordinates to vector or raster data, helping accurately model the Earth's surface.
Photogrammetry uses visualization rather than collecting data on the wavelength of light. It involves determining the spatial properties and dimensions of objects captured in digital photographs.
Vector and raster (Fig. 1) are common data formats used for storing geospatial data.
Vectors are a graphic representation of the real world. There are three main types of vector data: points, lines, and polygons. Points help create lines, and connecting lines form closed areas or polygons. Vectors often represent the generalization of features or objects on the Earth's surface. For example, vector data (used by over 78% of users) is stored in shapefiles, sometimes referred to as shp files (used in ArcGIS software).
Raster represents information presented in a grid of pixels. Each pixel stored in the raster has a value. This value can be anything from a measurement unit, color, or information about a specific element. Typically, raster refers to images, but in spatial analysis, it often refers to orthoimages or satellite images taken and preprocessed from aerial devices or satellites.
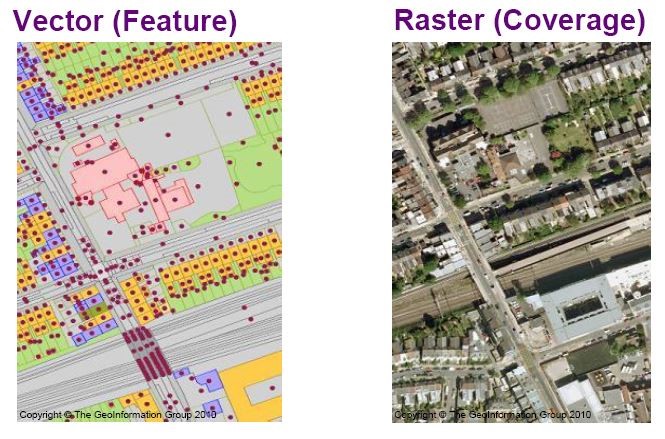
Fig. 1.
There is also something called an attribute. Whenever spatial data contains additional information or non-spatial data, they are referred to as attributes. Spatial data can have any number of location attributes. For example, this could be a map, photographs, historical references, or anything else deemed necessary.
The field of spatial data technology focuses on extracting a deeper understanding from data using a complete set of spatial algorithms and analytical methods. Modern methods include the use of machine learning and deep learning to uncover hidden patterns in data, improving predictive models.
Spatial data can also include attributes that provide additional information about the object they represent. This helps users understand where things are happening and why. Geographic Information Systems (GIS) and other specialized software applications help access, visualize, manipulate, and engage in spatial analysis.
Experts expect spatial data science to become more important as government agencies and businesses seek to make more informed decisions based on data.
Other aspects of spatial data science include spatial data analytics and data visualization.
Spatial data analytics involves the process of discovering hidden patterns in large spatial datasets. As a key factor in GIS application development, spatial data analytics allows users and geospatial professionals to extract valuable data about neighboring regions and explore spatial patterns. In this scenario, spatial variables such as distance and direction are taken into account.
Data visualization software allows various spatial data files to be connected in geospatial technology, such as Esri File geodatabases in ArcGIS, GeoJSON files, Keyhole Markup Language (KML) files, MapInfo tables, shapefiles, TopoJSON files, etc.
After connecting, GIS specialists or users can create maps of points, lines, and polygons using information from spatial data files, LiDAR data files, and geospatial data files.
Over the past 20 years, spatial data has been used not only for cartography (the share of map creation based on remote sensing data was 60% in 2021, compared to 95% in 2000) but also for new areas such as BIM, SMART, IoT, OutDoor/InDoor.
Navigational and mobile technologies form the foundational basis for spatial data. For example, popular mobile applications allow data developers to create complex integrated applications using sets of geospatial and temporal data from IoT data, maps, weather data, UAVs, satellites, etc.
Today, spatial data plays a leading role in managing and selecting the necessary information components in the BIG DATA environment, machine reading ("artificial intelligence"), neural network analysis, and other promising fields of science and IT technologies.
In practice, the ecosystem of human habitation and development is connected with spatial data - land, water, ocean, atmosphere, nature, resources, cities, roads, any infrastructure, social, political, and military interactions.
The quality and technical characteristics of sensors, as well as the conditions for Earth remote sensing, are determined based on their spatial, spectral, radiometric, and temporal resolution (sampling frequencies), which are defined by the task of processing data and obtaining the final product or service of remote sensing (RS). The Client's tasks determine the choice of sensor data characteristics.
Spatial Resolution
The size of a pixel recorded in a raster image. Usually, pixels can correspond to square areas with sides ranging from 0.15 to 1000 meters.
The ability to capture the Earth's surface in one pixel, for example, of satellite sensors, is called spatial resolution (commonly referred to as geometric resolution on the Earth's surface). In some cases, spatial resolution depends on the orbit on which the spacecraft flies.
Currently, great attention is paid to increasing the spatial resolution of satellite sensors. It reaches 15-25 cm. Increasing spatial resolution improves the quality of images.
Aerial and UAVs have a resolution of up to 3-5 cm, while ground lidar surveys have a resolution of up to 3-5 mm.
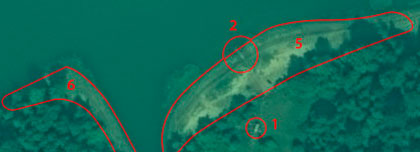
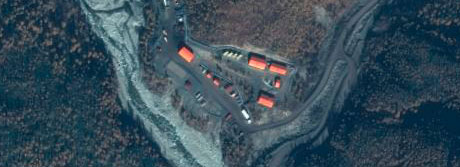
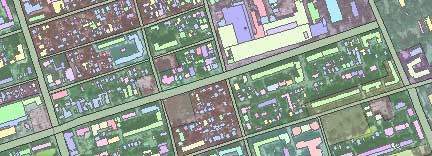
Visual comparative images to understand spatial resolution are shown in figures 2, 3, 4, 5.
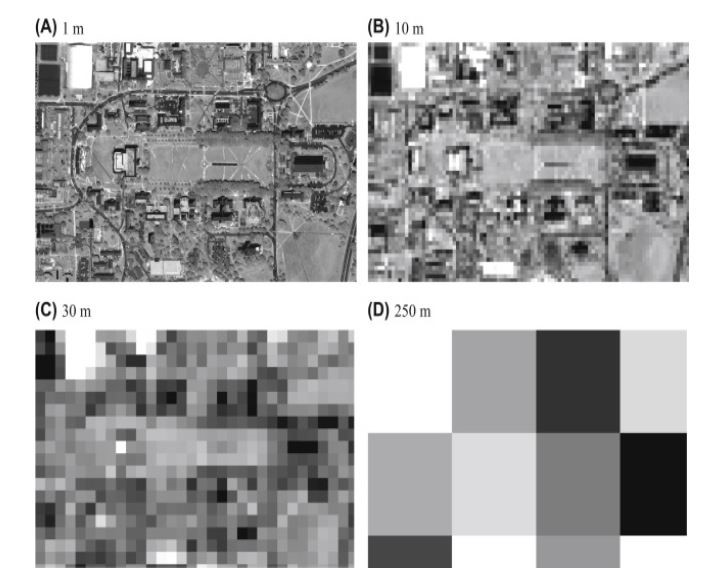
Figure 2 Satellite Sensors
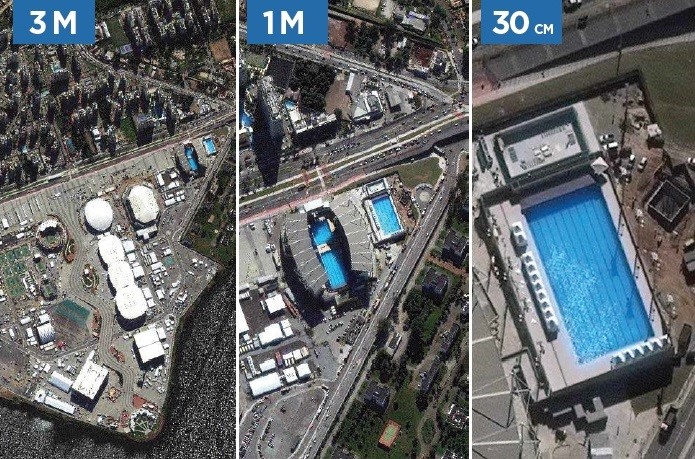
Figure 3 Satellite Sensors
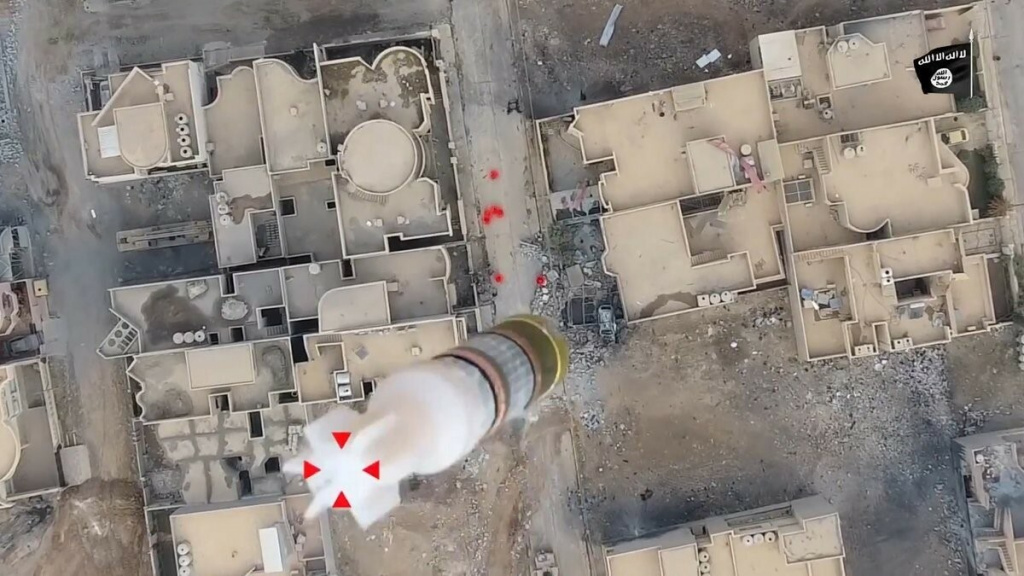
Figure 4 UAV Sensors (Resolution on the Ground 3-5 cm)
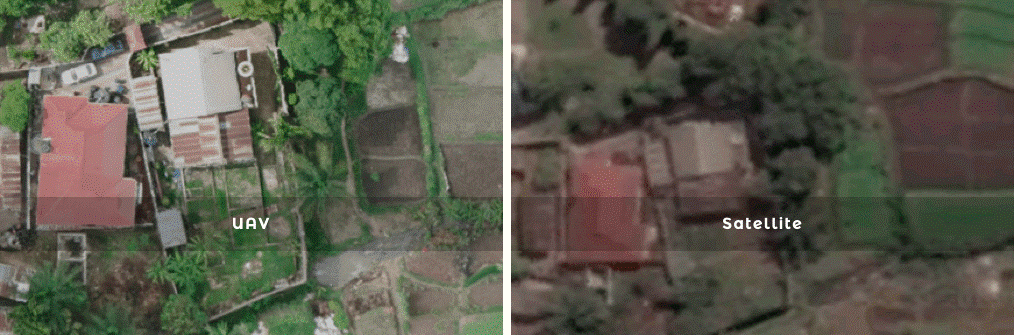
Figure 5 Comparative Image from Satellite and UAV
Spectral Resolution
The wavelength of various recorded frequency ranges - usually associated with the number of frequency ranges of the electromagnetic spectrum recorded by the sensor platform (Figure 6).
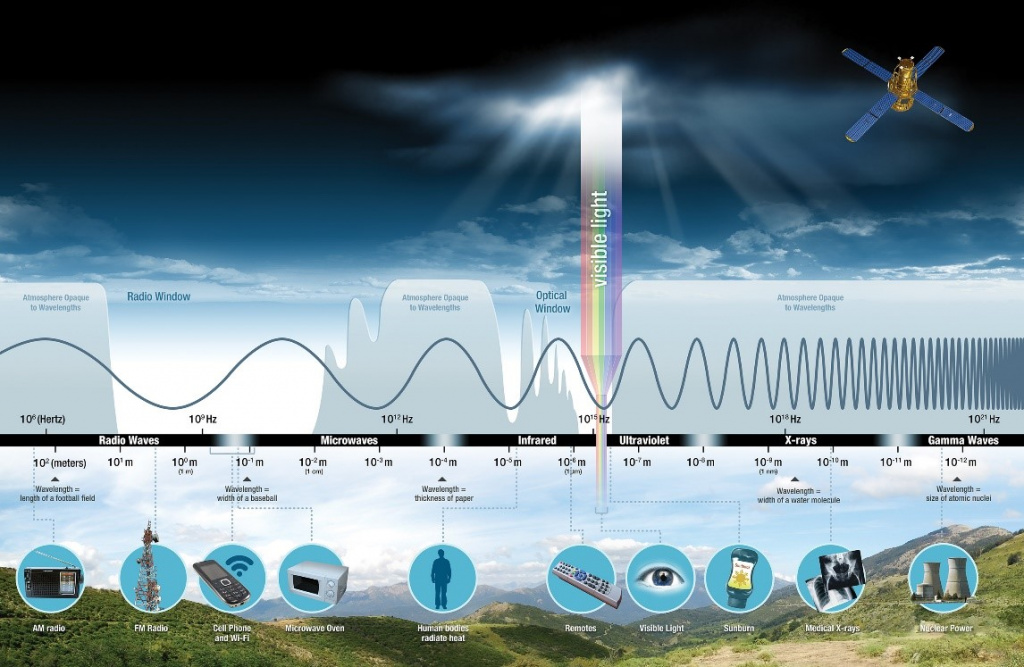
Figure 6
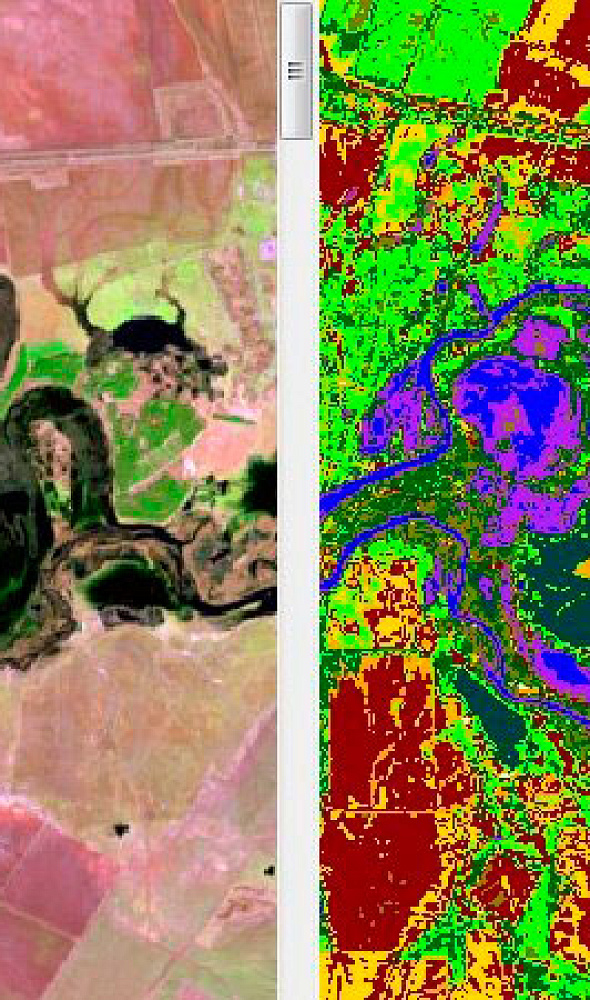
Spectral resolution is a characteristic of a sensor that captures images in different wavelengths of the spectrum. Currently, in modern remote sensing, panchromatic, multispectral (Figure 7), hyperspectral, and super-spectral images based on this characteristic are used. Different objects reflect rays in different wavelengths. Therefore, to determine any characteristic of an object, its reflective properties in different wavelengths of the spectrum must be studied. For example, to use an image as a background, it is sufficient to have its image taken in three spectral ranges: green, blue, and red (RGB).
However, if we want to obtain more data from it, such as expressing impermeable surfaces or vegetation classification, we need to use the near-infrared (NIR) or thermal infrared (IR) range. In this case, the possibilities of the MODIS scanner are not limited . It takes images in 36 spectra in the wavelength range from 0.4 µm to 14.4 µm and transmits them to Earth. The more ranges, the easier it is to identify an object. In this regard, the Landsat 8 and 9 satellite scanner takes second place. Its spectral image is taken in 10 ranges (coastal, blue, green, red, NIR, SWIR1, SWIR2, Pan, TIR1, TIR2). If we consider the water vapor Cirus identifier as one band, the number of Landsat 8 OLI TIRS bands will reach 11 bands. The thing is, the Cirus band does not capture images in the visible wavelength range but operates according to the function of light-returning oncoming aerosols. The last place is occupied by the WorldView2 and WorldView3 satellites. The sensors of these satellites provide us with images in 9 spectral wavelength ranges. These ranges are Coastal, Blue, Green, Yellow, Red, RedEdge, NIR1, NIR2, and Pan. In this regard, MODIS satellite scanners received high ratings. However, due to poor spatial resolution, it is not widely used.
Therefore, currently, the highest demand is for data from the WV3 satellite. Especially its extended red range.
Thematic solutions for space data create the majority of RS products based precisely on WV3 images.
The conditions for the normal operation of sensors, i.e., obtaining high-quality images, are determined by the atmospheric transparency windows that allow passing a specified portion of the sensor's electromagnetic spectrum.
Spectral characteristics and transparency windows for RS sensors are presented in figure 8.
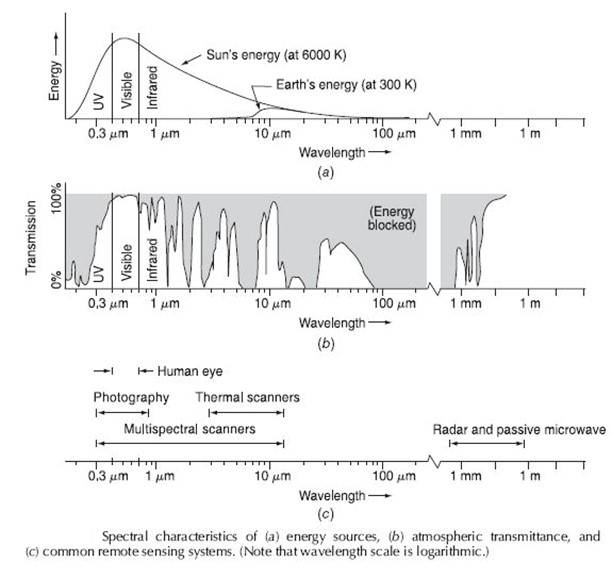
Figure 8
Radiometric Resolution
The number of different radiation intensities that the sensor can distinguish. Usually, this ranges from 8 to 14 bits, which corresponds to 256 levels of gray scale and up to 16,384 intensities or "shades" of color in each band. This also depends on the sensor's "noise."
The difference in radiometric resolution can be illustrated easily using Figure 9.
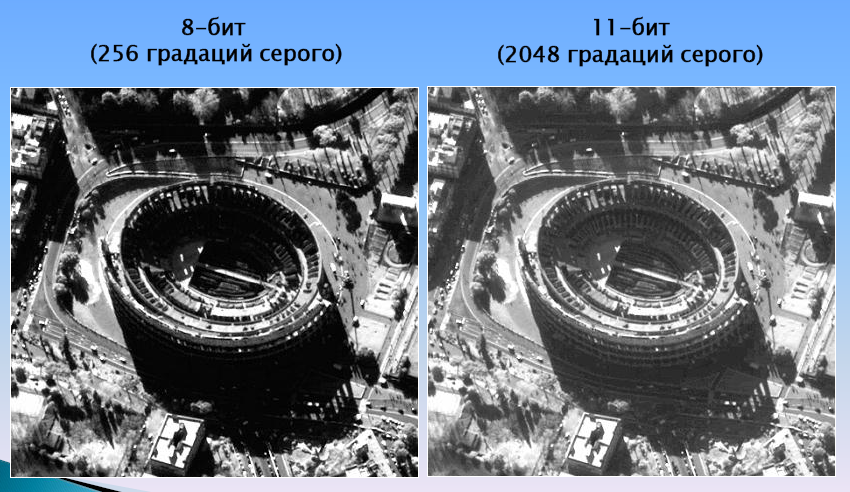
Figure 9
Temporal Resolution
The frequency of satellite or aircraft (UAV) passes and imaging over the same territory or observation target. It is of great importance for temporal data series research in RS when monitoring processes (agriculture, construction, military affairs, water resources, emergencies, etc.). For example, the temporal resolution of RS satellites today in military affairs reaches up to 15 minutes, and in civilian applications, it can be 1-2 hours, and seasonal resolution can be annual (archive data). Archive data for in-depth research of territory changes can be ten years old (Figure 10, 11).
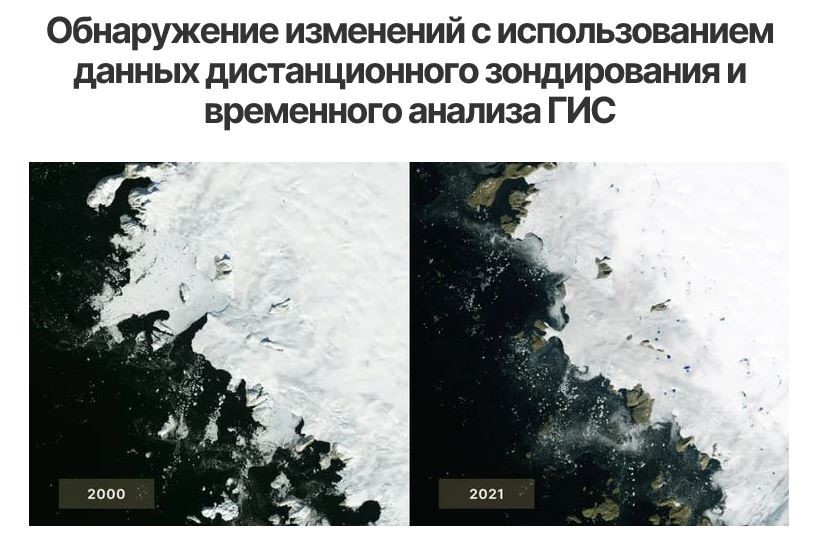
Figure 10
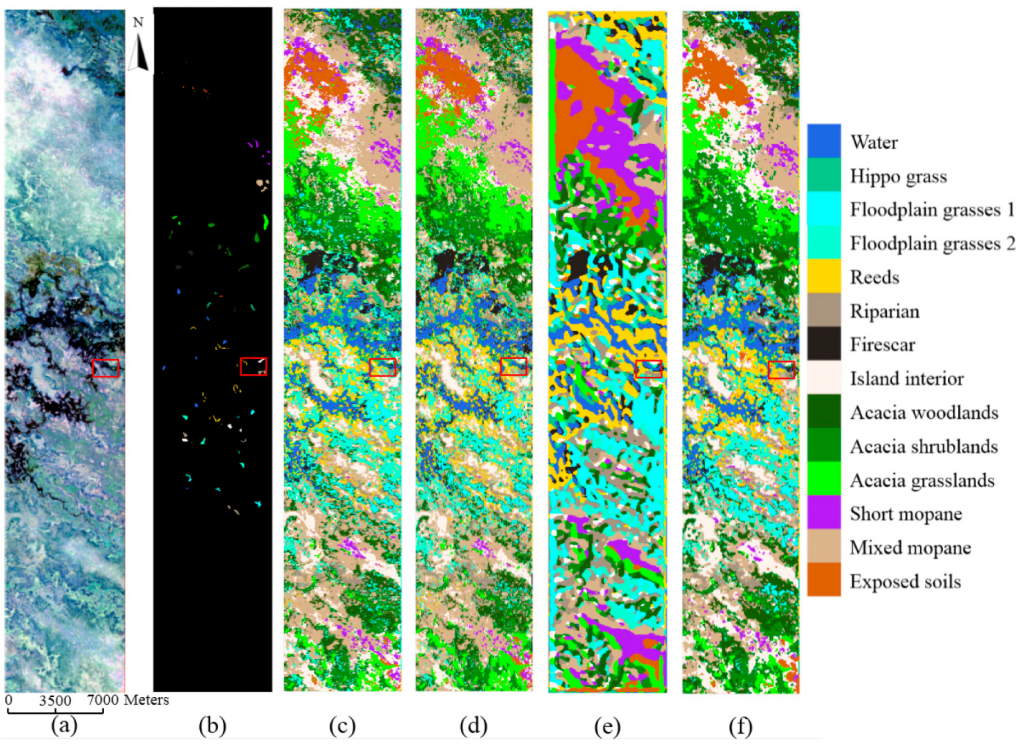
Figure 11 Changes in Cropland State During the Year (LULC Technology)
For most systems, such as space remote sensing, it is assumed to extrapolate sensor data with respect to a ground control point, including distances between known points on the Earth. This is called the reference, which is used to subsequently correct images, maps, or charts.
Therefore, image processing technology - photogrammetry - is of great importance.
In addition, radiometric and atmospheric corrections of images may be required.
Radiometric Correction
It allows avoiding radiometric errors and distortions. The illumination of objects on the Earth's surface is uneven due to different relief properties. This factor is taken into account in the radiometric distortion correction method. Radiometric correction sets the scale of pixel values, for example, a monochromatic scale from 0 to 255 will be transformed into actual brightness values.
Topographic Correction (also called terrain correction)
In rugged mountains, effective pixel illumination varies significantly due to terrain relief. In remote sensing images, a pixel on a shaded slope receives weak illumination and has a low brightness value, unlike a pixel on a sunny slope that receives strong illumination and has a high brightness value. For the same object, the brightness value of a pixel on a shaded slope will differ from that on a sunny slope. Moreover, different objects may have the same brightness values. These ambiguities seriously affected the accuracy of extracting information from remote sensing images in mountainous regions. It became the main obstacle to further application of remote images. The goal of topographic correction is to eliminate this effect and restore the true reflectance or brightness of objects under horizontal conditions.
Atmospheric Correction
It removes atmospheric haze by rescaling each frequency band so that its minimum value corresponds to the value of pixel 0. Digitizing data also allows manipulating data by changing gray scale values (Figure 11).
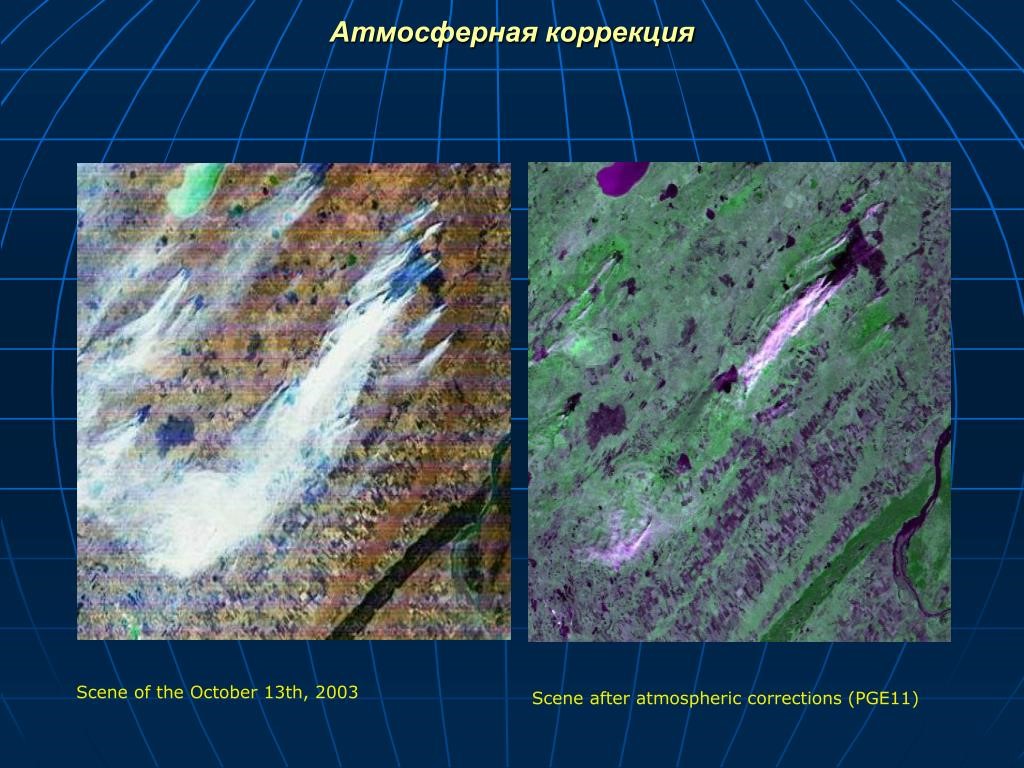
Figure 11
It is a common practice to provide meteorological conditions for the date and time of RS imaging.
Levels of Earth remote sensing data processing were first defined by NASA in 1986. Their definition and image processing technology are used in global remote sensing standardization and undergo changes and approvals at the United Nations (UN).
The primary processing of remote sensing data (from raw images to their georeferencing) is categorized from levels 0 to 3. Following that, there is what is called thematic processing. Its classification encompasses over 250 directions, and the thematic scope expands each year. Thematic technology is tailored to the customer's specific needs. Currently, the main product of Earth remote sensing is analytics.
The most requested applications of remote sensing data are in the fields of military, agriculture, and construction.
Data archiving is done using computer-readable ultraphishes, usually with fonts like OCR-B, or in the form of scanned halftone images. Ultraphishes are well-preserved in standard libraries with a lifespan of several centuries. They can be created, copied, stored, and retrieved by automated systems.
When planning and implementing remote sensing projects, it is important to consider several key parameters:
- Area of interest
- Accessibility of the survey
- Survey period
- Archival or new survey
- Spectral channels
- Project budget
1) Speed and ease of data collection: Satellites can cover thousands of square kilometers in a matter of minutes. This allows gathering a large volume of information in a short period without the complexities of flight planning, obtaining permissions, and selecting take-off and landing points for aircraft. Thus, satellites offer high speed and simplicity of data collection.
2) Absence of logistical issues: Satellites do not face problems related to airspace restrictions, complex route planning, or constantly changing limitations in survey areas. They can collect data from isolated, conflicting, or transboundary locations without restrictions, which is particularly valuable for large-scale cartographic projects.
3) Independence from weather conditions: Unlike aviation methods, which are constrained by weather conditions, satellites can operate regardless of weather, except for cloud cover. This ensures the continuity of data collection and reduces the risks of delays or cancellations due to weather conditions.
1) Resolution and spectral characteristics of sensors: Customers set requirements for spatial resolution and spectral ranges that match their specific needs. This allows obtaining data with the necessary level of detail and spectral information for the studied phenomena or objects. As of May 2023, there is a huge selection of Earth observation satellites to choose from.
2) Angles of capture: Customers specify the angles of capture to obtain images from optimal perspectives. This is especially useful for analyzing three-dimensional objects or terrain where specific angles can provide a more comprehensive understanding and analysis.
3) Real-time weather updates: Regular real-time weather updates help avoid capturing data in unfavorable weather conditions and cloud cover. This maximizes the use of available windows for data collection.
4) Fast data delivery: After the satellite captures images, they are uploaded via a ground station and can be delivered to users within four hours. This provides operational access to fresh data and allows for quick analysis and processing.
5) Data processing and delivery options: Users can choose different data processing options according to their requirements.
Remote sensing satellite operators offer a wide range of imaging capabilities, providing various spectral ranges and ultra-high resolution.
1) Spectral ranges: Spacecraft operators offer images in various spectral ranges. This allows analyzing objects and phenomena at different wavelengths and obtaining specific spectral information. Hyperspectral imaging can cover hundreds of spectral ranges, expanding research possibilities.
2) Stereoscopic imaging: Satellites can also perform stereoscopic imaging, providing stereo images from different angles. Stereoscopic images provide reliable data for creating digital elevation models (DEMs) and virtual 3D models, which are useful for analyzing relief and three-dimensional objects.
3) Ultra-high resolution: Satellites provide high-resolution images. For example, the Spacewill company's Superview NEO satellite can offer satellite images with a resolution of up to 30 centimeters. This allows identifying various objects and features on the ground with high accuracy and detail.
1) Accessibility and predictability: Satellites can reach areas that may be difficult or inaccessible for other surveying methods, such as remote or geographically isolated locations. Thanks to the availability of remote sensing satellite clusters, survey plans become more accessible and predictable for clients.
2) Frequency of updates: A high frequency of satellite image updates allows obtaining fresh data at regular intervals. This is particularly important for automated analysis, where constant data updates are required. Users can confidently rely on constant data availability for their workflow. As of May 2023, GEO Innoteс offers its customers satellite surveys from 100+ remote sensing satellites with a resolution better than 1 meter.
3) Integration with artificial intelligence programs: Satellite images can be integrated into programs that use artificial intelligence (AI) for automatic extraction and classification of objects and features in the image. This helps optimize workflows and automate data analysis.
4) Extended training data: Thanks to the large number of images collected by satellites over time, users have access to extended training data for machine learning programs. This improves the quality and accuracy of machine learning models used for analyzing satellite data.
5) Historical data and modeling: Satellite data provides access to historical data that can be used for modeling and forecasting. This is particularly important for analyzing trends, detecting anomalies, and assessing profitability. The use of historical data helps understand long-term changes.
These satellite imaging capabilities provide high accuracy and data quality, making them an effective alternative to aviation imaging. As of May 2023, there is a global trend of unmanned aerial vehicles (UAVs) displacing manned aviation at a rapid pace.
GEO Innotech offers its customers integrated solutions of space + UAVs.
Remote sensing of the Earth (RS) is a method of studying the Earth and its environment in which information is collected by satellites or other remote sensing vehicles at an altitude above the Earth's surface.
RS provides a wealth of data about objects on the Earth's surface, including geologic structures, landscapes, climatic conditions, and other parameters. This method is used in various fields including geology, geography, agronomy, ecology, meteorology, hydrology, etc.
In geology, Earth remote sensing can be used to search for mineral deposits including oil and gas, and to study geologic structures like geologic folds, fractures, etc.
Remote sensing of the Earth can also be used to study changes in the Earth's surface caused by various factors such as climatic changes, natural disasters or anthropogenic influences.
In general, remote sensing of the Earth is a powerful tool for studying the Earth's surface and its environment, and finds wide application in various scientific and practical fields.
There are many satellites in space that are used to acquire Earth remote sensing data. They may differ in purpose, orbit characteristics, resolution, spectral characteristics and other parameters. Let's consider the most common types of satellites for remote sensing:
Each of these types of satellites has its own characteristics and applications, and the choice of a particular satellite depends on the problem to be solved.
- Optical satellites - used to acquire information in the visible and infrared bands. Examples of such satellites are Landsat, Sentinel-2, SPOT, MODIS.
- Radar satellites - use radio wave radiation to acquire data. They can operate in all weather conditions and daylight hours. Examples of such satellites are RADARSAT, Sentinel-1, TerraSAR-X.
- Gravity satellites are used to measure the Earth's gravity field and the mass of objects on its surface. Examples of such satellites are GRACE, GRACE-FO.
- Geodetic satellites - used for precise determination of coordinates and heights of points on the Earth's surface. Examples of such satellites are GPS, GLONASS, Galileo.
- Atmospheric satellites - used to study atmospheric phenomena such as clouds, atmospheric gases, meteorological conditions. Examples of such satellites are Aqua, Terra, MetOp.
- Space telescopes - used to study space objects and phenomena such as stars, galaxies, space dust. Examples of these satellites are Hubble Space Telescope, Chandra X-Ray Observatory, Spitzer Space Telescope.
Each of these types of satellites has its own characteristics and applications, and the choice of a particular satellite depends on the problem to be solved.
Remote Sensing of the Earth (RS) provides a wide range of capabilities to obtain information about the Earth and its surface from space. Some of the major capabilities of remote sensing include:
In general, remote sensing provides information about the Earth and its environment that can be used for decision-making in various fields of activity, from economics to ecology and science.
- Obtaining information about the geographical position of objects on Earth. Using satellite remote sensing, it is possible to obtain the exact coordinates and elevations of geographical features such as mountains, rivers, lakes, settlements, etc.
- Study of changes in the natural environment. With the help of remote sensing it is possible to observe changes in forest areas, pastures, as well as other zones of natural environment, such as deserts, tundras, etc. This allows tracking the processes of erosion, forestation, droughts and other natural phenomena.
- Study of climatic processes. RS data are used to study climate changes on the planet, such as global warming, glacier spreading, etc.
- Monitoring and forecasting of natural disasters. Earth remote sensing can be used to monitor processes related to earthquakes, volcanic eruptions, floods and other natural disasters. This makes it possible to predict the danger to the population and take measures to prevent natural disasters.
- Mineral prospecting and mining. Remote sensing allows finding mineral deposits such as oil, gas, gold, silver, etc. This is especially useful in areas that are difficult to access and poorly explored.
- Environmental pollution monitoring. Remote sensing data is used to track water and air pollution, and to monitor soil quality, etc.
- Exploration of oceans and seas. Remote sensing provides information on temperature, salinity, currents, waves and other parameters of oceans and seas. This makes it possible to forecast conditions for fishing, track the movement of icebergs, predict sea level changes and other parameters important for studying marine ecosystems.
- Monitoring of transportation and communications. Remote sensing can be used to track the movement of vehicles such as cars, trains, ships and airplanes. This can be useful for controlling traffic flows and optimizing routes. Also, remote sensing data can be used to find oil or gas leaks in pipelines and other communications.
- Defense and Security Support. Remote sensing is used to support national security by monitoring borders, controlling the surface of the earth and the air. In addition, remote sensing can help detect sources of terrorist threats and prevent possible attacks.
- Space Object Surveillance. Remote sensing data is used to study space objects such as planets, galaxies, stars, etc. With the help of remote sensing it is possible to study their properties, physical characteristics and motion.
In general, remote sensing provides information about the Earth and its environment that can be used for decision-making in various fields of activity, from economics to ecology and science.
Need satellite imagery or help choosing the right data?
Describe your task, area of interest, and desired outcome. We will check data
availability, assess new acquisition options, and propose the optimal solution in terms of timelines, cost,
and quality.
Discuss the project
clients who trust us
25+ years in the geodata market