Ice condition monitoring is a systematic process of collecting and analyzing information about the state of ice on water bodies (seas, oceans, lakes, rivers) to ensure safety, facilitate navigation, plan activities, and forecast the socio-economic consequences of ice conditions over a certain period of time. 

Ice condition monitoring is an ongoing process of analyzing and reporting on the current state of ice on water bodies to ensure safety and provide up-to-date information. Monitoring includes providing data on ice thickness, strength, ice-covered areas, and other factors that may affect the safety and practical use of waterways during the winter period.


Ice condition monitoring plays a crucial role in ensuring safety and efficiency on water bodies during the winter period. Here are several key reasons why ice condition monitoring is essential:

  1. Safety of Navigation: Ice condition monitoring provides information on the current state of ice, such as thickness, strength, and cracks. This enables mariners, ship captains, and icebreakers to make informed decisions related to navigation safety and optimal route selection.
  2. Event Planning and Economic Analysis: Ice condition monitoring helps predict and assess the potential consequences of ice conditions on various activities, including shipping, mineral extraction, fishing, and tourism. This information aids in developing planning and forecasting strategies, optimizing expenses, and minimizing risks.

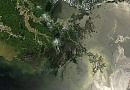
Environmental Monitoring: Ice condition monitoring allows the study and tracking of changes in the ecological environment related to the presence and distribution of ice. This is crucial for assessing the impact of climate change on ice covers and their influence on marine and freshwater ecosystems.


img-12.png

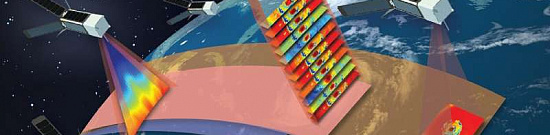
Fig. Ice Condition Monitoring


The goals of ice condition monitoring include:

  • Providing current and reliable information about the state of ice on water bodies.
  • Creating conditions for safe and efficient navigation during the winter period.
  • Supporting planning and decision-making in various sectors related to ice conditions.
  • Predicting and forecasting ice conditions (formation of continuous ice cover on watercourses and reservoirs) and their consequences.
  • Determining the optimal start and end times of the navigation season in icy conditions.
  • Ensuring the safety of people and preventing accidents on the ice.
  • Studying climate changes and their impact on ice conditions.


Monitoring tasks may include:

  • Collecting and analyzing data on the state of ice, including thickness, strength, and other parameters.
  • Monitoring the distribution and movement of ice on water bodies.
  • Identifying risks and hazardous areas associated with ice conditions.
  • Developing and disseminating forecasts and warnings about ice conditions.
  • Interacting with stakeholders, including mariners, rescue services, environmental organizations, and authorities.
  • Determining changes in ice conditions dynamically through systematic observation and data recording.
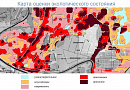
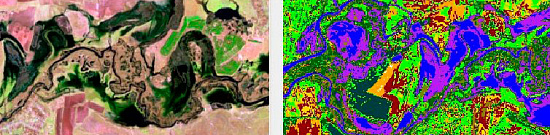
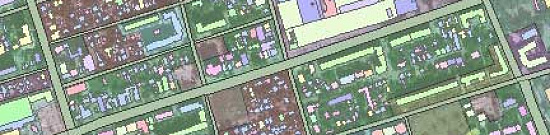
  • Creating ice condition maps that are regularly updated, allowing for visual tracking of ice distribution on water bodies and identifying high-risk zones.

Building forecasting models for ice condition based on accumulated data and meteorological forecasts.

Advantages of Using Radar Remote Sensing Data

  1. Broad coverage and global coverage of ice areas.
    • Satellites with radar sensors allow observation of extensive ice regions.
  2. Operation in any weather conditions and at any time of day.
    • Radar sensors operate independently of cloud cover or lighting conditions, allowing data collection during day and night.
  3. High spatial resolution and detailed information.
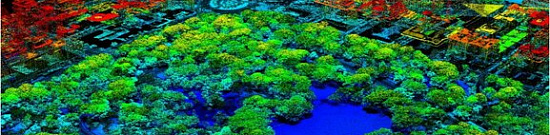
    • Radar sensors provide detailed, high-resolution imagery (up to 1 meter on the ground), enabling the study of properties and dynamics of ice formations.
  4. Monitoring changes and dynamics of ice masses.
    • Continuous monitoring with radar sensors allows tracking changes in ice areas and analyzing their dynamics.
  5. Discovery of new scientific data.
    • Data collected using radar sensors provide new scientific insights into ice formations and their interaction with the environment.


Figure 12.jpg

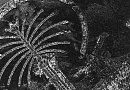
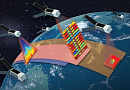
Fig. Using Radar Remote Sensing Data


Prices for services

Events 

Free / Cost per Unit

 Consultation

 Free

 Preliminary Analysis

 Free

 Ordering Radar and Optical Imagery

 Cost of RS materials is calculated individually for each order and may vary:

 - use of free satellite imagery

 - and/or use of commercial satellite imagery *

Work of Technical Specialists and Expert(s)

 From 300,000 RUB

Total Cost

 From 300,000 RUB


The price depends on the intensity and detail of the survey and is calculated individually for each client.


The cost of execution is calculated on an individual basis, taking into account a specific of task.

After receiving the task description, we calculate the cost and send you a commercial offer.

Period of execution

The completion time of the work is from 20 (twenty) working days and is calculated individually for each client.

The timelines depend on:

  • the total area of the area of interest;
  • availability of archived RS materials, the need for new surveys;
  • requirements for RS materials, the final product.

The service delivery times depend on the complexity of the work and are calculated individually for each client.


How to place an order:

  • STEP #1: Submit a request on the website, specifying:
    • Location of the object of interest (coordinates, district or region name, shapefile, etc.);
    • Issue and required solutions.
  • STEP #2: Coordination of the technical task and cost:
    • Used source of remote sensing data (RS) and survey schedule;
    • Formats for presenting results;
    • Technical requirements for RS materials;
    • Additional requirements for output data (if necessary);
    • Final cost and completion dates.
  • STEP #3: Contract signing and commencement of work:
    • Duration of 20 working days from the date of receiving the advance payment - payment is accepted only by bank transfer.


We work with individuals, legal entities, individual entrepreneurs, government and municipal authorities, foreign clients, etc.

You can also submit your request via email: innoter@innoter.com, or contact us by phone: +7 495 245-04-24, or in the online chat on the website.


Need for consultation?

Fill the form and we will contact you

By clicking the «Send» button, you give your consent to the processing of your personal data, in accordance with Federal Law No. 152-FZ of July 27, 2006 «On Personal Data», on the conditions and for the purposes specified in the Consent to the processing of personal data.

Stages of service provision

Stage #0 (BEFORE contract signing) – Express Evaluation:

  • Detailing the client's task for feasibility with geospatial technologies
  • Determining dates and parameters of the desired imagery (survey period, type of survey)
  • Checking for the availability of RS data from open sources in the area of interest and date
  • Verifying selected images for compliance with customer requirements
  • Submitting a request to the operator(s) for new imagery (if necessary)

RESULT: Possibility (YES/NO) of providing the service

Stage #1 (BEFORE contract signing) – Development of the technical task, project agreement:

  • Agreement with the client on RS data available in operator archives;
  • Agreement with the client, if necessary, on the satellite from which images will be ordered, deadlines, and parameters of new images;
  • Final determination of labor and material costs, agreement on delivery times and costs
  • Agreement on the technical task

RESULT: Signed contract

Stage #2 (contract execution):

  • Receiving 100% advance payment
  • Ordering satellite imagery materials
  • Analysis and initial processing of received data
  • Monitoring ice conditions in the area of interest during the specified period
  • Mapping spatial variability of ice characteristics;
  • Monitoring changes in ice characteristics over time;
  • Emergency situations and their monitoring;
  • Preparation of cartographic materials (ice condition map at the freezing moment, cross-sectional profiles of snow-ice cover distribution, etc.)
  • Providing the client with access to operational monitoring of ice conditions and spatial data in the areas of interest.


RESULT: Transfer of materials to the Client


The result of the provision of services

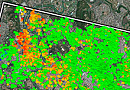
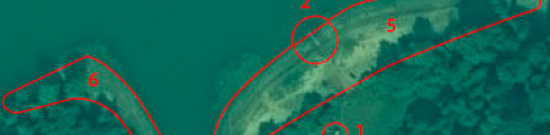
The client receives an operational, accurate ice condition map with ice type classification, a three-day forecast of ice movement from the moment ice objects are detected upon the client's request, and radar images of the area of interest during the ordered period.


Maps are provided in PDF, GeoTIFF, and isolines (shp format).


Рис.13.png

Рис. Точная карта ледовой обстановки


Requirements for Source Data

Accurate geographical coordinates of the object in the required coordinate system (specialists of GEO INNOTER LLC will refine the coordinates provided by the Client in any convenient form).

Software:

  • GIS – QGIS, ArcGIS, etc.
  • Processing – ERDAS, ENVI SARscape, SNAP, etc.


If it is not possible to provide the specified information, provide details on the intended use of RS materials, and GEO INNOTER LLC specialists will analyze the requirements and suggest an optimal solution to the problem.


Related services

Digital terrain models (DTM)
Find out the price
Orthoimagery (Orthorectification)
Find out the price
Satellite Imagery as evidence in legal proceedings
Find out the price
Satellite & UAV Monitoring
Find out the price
Remote sensing imagery Interpretation & spectral analysis
Find out the price
Thematic mapping
Thematic mapping
Find out the price

Customers

Rosneft
Gazprom
Gazprom neft
Lukoil
Transneft

FAQ

Radar processing is quite an arduous task, because a radar image has a raw image that is unfamiliar to the human eye. Specialized software products are used for radar processing, and specialists should have proper experience in creating secondary products of radar space imagery. However, despite this, the advantages of radar make the use of radar imagery very much in demand.
  • Complex image (SLC) - information obtained by focusing the transmitter signal. A radar image at this level of radar processing includes two channels: a gray-scale amplitude ("panchromatic") image and a signal phase image, which is used to create digital elevation models and displacement maps of the Earth surface
  • Geocoded image. A radar image is spatially referenced in a specific coordinate system. Radar images at this level of radar processing are usually delivered in GeoTIFF format.
  • Ortho-transformed image. A radar image of high quality, without geometric distortion from topography. Radar space imagery at this level of radar processing is used to create cartographic materials and spatial analysis.
  • C-band range satellites: HiSea-1, ChaoHu-1, RADARSAT-2, Gaofen-3, KOMPSAT-5, for ice monitoring;
  • X-band range satellites: SuperView NEO, TerraSAR/TanDEM-X, Condor-FKA for ice monitoring;
  • L-band range satellites: LuTan-1, ALOS Palsar-2 for ice monitoring.

More about ice monitoring requirements and suitable satellites can be found in our article.


The terms of work execution depend on the area of the territory, requirements to the survey parameters. The minimum period of work execution is from 20 working days
100% prepayment on the invoice for remote sensing materials after signing the contract, the rest of the payment after the work is done.

Monitoring sea ice with remote sensing involves using satellite-based sensors to collect data and information about the extent, thickness, and other characteristics of sea ice. Here's an overview of the process:

  • Satellite Sensors: Remote sensing satellites equipped with various sensors, such as radar or optical instruments, are used for monitoring sea ice. Different sensors provide different types of information.

  • Radar Sensors: Radars operating in different frequency bands (C-band, X-band, L-band) are commonly used for sea ice monitoring. Radar can penetrate clouds and darkness, making it suitable for all-weather and day-night observations.

  • Optical Sensors: Optical sensors capture imagery in the visible and infrared spectrum. While optical sensors are affected by cloud cover and darkness, they provide high-resolution visual information about sea ice conditions.

  • Thermal Infrared Sensors: These sensors can detect temperature differences and are useful for identifying areas of open water within sea ice.

  • Data Processing: Raw data collected by the sensors are processed to create meaningful information. This may involve removing noise, correcting distortions, and converting data into usable formats.

  • Image Classification: The processed data are often classified to distinguish between different types of surfaces, such as open water, thin ice, thick ice, and leads (cracks in the ice). Machine learning algorithms may be employed for automated classification.

  • Change Detection: Remote sensing allows for the comparison of images over time, enabling the detection of changes in sea ice conditions. This is crucial for monitoring trends and understanding the dynamics of sea ice cover.

  • Data Analysis: Scientists and researchers analyze the processed data to assess sea ice parameters, including ice concentration, thickness, and distribution. This information is valuable for climate research, navigation, and understanding the impact of climate change on polar regions.

  • Visualization and Reporting: The results are often presented in visual formats such as maps, graphs, and charts. Additionally, reports and assessments may be generated for stakeholders, including government agencies, researchers, and industries involved in maritime activities.

Overall, remote sensing provides a comprehensive and efficient way to monitor sea ice on a large scale and over extended periods, contributing to our understanding of climate dynamics and supporting various applications in polar regions.

Sea ice is measured using various remote sensing techniques, which involve the use of satellite-based sensors to collect data on sea ice conditions. Here are some key methods for measuring sea ice with remote sensing:

  • Radar Altimetry:

Principle: Radar altimeters on satellites emit radar pulses towards the Earth's surface and measure the time it takes for the signal to return. This information helps determine the height of the sea ice surface.
Application: Radar altimetry is particularly useful for measuring the thickness of sea ice, as the difference in height between the ice surface and the water surface can be calculated.
  • Synthetic Aperture Radar (SAR):
Principle: SAR instruments on satellites emit radar signals and measure the backscattered signals. Different types of ice (open water, thin ice, thick ice) have distinct radar signatures, allowing for classification.
Application: SAR is used to monitor sea ice extent, identify different ice types, and estimate ice concentration. It is effective in all weather conditions and can operate day and night.
  • Passive Microwave Radiometry:
Principle: Passive microwave radiometers on satellites detect natural microwave radiation emitted by the Earth's surface. Different types of ice have unique microwave emission characteristics.
Application: Passive microwave sensors are commonly used to estimate sea ice concentration and extent. They are sensitive to the presence of liquid water in the ice, helping distinguish between ice and open water.

  • Optical and Infrared Imaging:

Principle: Optical and infrared sensors capture reflected sunlight and emitted thermal radiation from the Earth's surface. Ice and water have different reflective and thermal properties.
Application: Optical and infrared imagery is valuable for visualizing sea ice cover, identifying leads and cracks, and monitoring changes in ice conditions. However, these sensors are limited by cloud cover and darkness.
  • Thermal Infrared Imaging:
Principle: Thermal infrared sensors measure the temperature of surfaces. Ice and water have different thermal properties, allowing for discrimination.
Application: Thermal infrared data can be used to identify areas of open water within sea ice and assess temperature variations in different ice types.
  • Laser Altimetry:
Principle: Laser altimeters emit laser pulses and measure the time it takes for the signals to return, providing information on surface elevation.
Application: Laser altimetry, such as that used by NASA's ICESat-2, can provide detailed elevation data, helping to monitor changes in sea ice thickness and topography.
These remote sensing techniques collectively contribute to a comprehensive understanding of sea ice conditions, including its thickness, extent, concentration, and dynamic changes over time. Combining data from multiple sensors enhances the accuracy and reliability of sea ice measurements for scientific research, climate monitoring, and operational applications.
The Arctic sea ice extent is defined from satellites through the use of remote sensing instruments, primarily passive microwave radiometers. The sea ice extent is a measure of the area covered by sea ice and is commonly expressed in terms of the total area covered by ice concentration above a certain threshold (typically 15%). Here's an overview of the process:

  • Passive Microwave Radiometers: Satellites equipped with passive microwave radiometers are commonly used for monitoring sea ice. These instruments measure the natural microwave radiation emitted by the Earth's surface, including the sea ice.

  • Brightness Temperature: The passive microwave sensors detect the microwave radiation emitted by the sea ice at different frequencies. The observed brightness temperature is related to the physical temperature and the properties of the ice, allowing scientists to distinguish between open water, thin ice, and thick ice.

  • Ice Concentration Threshold: A common threshold for defining sea ice extent is 15% ice concentration. If a grid cell in the satellite image has an ice concentration greater than 15%, it is considered part of the sea ice extent.

  • Satellite Imagery: Satellite sensors scan the polar regions, capturing microwave radiation emitted by the Earth's surface. The collected data are then processed to create images representing the distribution of sea ice.

  • Image Processing: The raw satellite data undergoes processing to correct for atmospheric effects and other factors. Image processing techniques are applied to convert the raw measurements into ice concentration values.

  • Ice Concentration Maps: The processed data are used to create ice concentration maps, where each grid cell is assigned a value indicating the percentage of ice cover. The 15% threshold is commonly used to define the boundary of the sea ice extent.

  • Sea Ice Extent Calculation: The sea ice extent is then calculated by summing up the areas of all grid cells where the ice concentration is above the specified threshold. This provides a quantitative measure of the total area covered by sea ice.

  • Temporal Analysis: To monitor changes over time, multiple satellite images are collected and analyzed at regular intervals. This allows for the tracking of seasonal variations, annual cycles, and long-term trends in Arctic sea ice extent.

Satellites, such as those from the National Aeronautics and Space Administration (NASA) and the European Space Agency (ESA), provide a continuous record of Arctic sea ice extent, contributing valuable data for climate research and understanding the impact of climate change on polar regions.
Arctic sea ice is monitored using satellites equipped with instruments like passive microwave radiometers and synthetic aperture radar. These satellites collect data, which is processed to create ice concentration maps. A common threshold, often 15% ice concentration, defines the sea ice extent. The total area with ice concentration above this threshold is calculated, providing a measure of Arctic sea ice extent. This ongoing monitoring helps track seasonal changes, annual cycles, and long-term trends, contributing valuable information for climate research and environmental assessment.
Remote sensing data contributes to sea ice monitoring by providing valuable information on its extent, thickness, and movement. Sensors commonly used include passive microwave sensors, synthetic aperture radar (SAR), and optical sensors. Each sensor type offers unique capabilities for capturing different aspects of sea ice characteristics.
Key indicators in remote sensing data for sea ice monitoring include backscatter properties in SAR imagery, spectral signatures in optical data, and microwave emissivity in passive microwave data. These indicators help identify and differentiate between various sea ice types, providing insights into their composition, age, and overall dynamic behavior in polar ice regions.
The temporal aspect of satellite imagery is crucial for sea ice monitoring as it allows for tracking seasonal variations, ice melt, and freeze-up cycles. Time-series analysis provides a comprehensive view of changes over time, enabling scientists to understand long-term trends, assess the impact of climate change, and predict the behavior of sea ice in polar regions.
Remote sensing technology aids in assessing the impact of climate change on sea ice dynamics by providing consistent and large-scale data. Scientists use this information for climate research and environmental modeling to study trends in sea ice extent, evaluate the effects of warming temperatures, and improve predictions of future changes in polar ice regions.
Integrating remote sensing data with numerical models enhances the accuracy of sea ice predictions by providing real-time observations. This integration supports navigation, resource management, and climate policy decisions in polar regions by offering precise information on sea ice conditions. It aids in planning safe navigation routes, managing natural resources, and formulating effective climate policies based on the latest sea ice dynamics.

Licenses

License for implementation of geodetic and cartographic activities (page 1)
License for implementation of geodetic and cartographic activities (page 2)
Application for the license for implementation of geodetic and cartographic activities
ISO 9001:2015 Certificate of Conformity №СДС.ФР.СМ.00813.19 (page 1)
ISO 9001:2015 Certificate of Conformity №СДС.ФР.СМ.00813.19 (page 2)

Warranty

We guarantee 100% service quality. Collaborating with GEO Innoter specialists eliminates risks and losses!

The presence of qualified personnel with extensive experience in specialized software allows us to guarantee timely and high-quality execution of work!

Advantages of Cooperation with GEO INNOTER

  • Many years of experience;
  • Direct distribution agreements with satellite imagery operators;
  • Experience in projects of any complexity, both aerial and satellite;
  • Availability of modern software for processing RS data;
  • Significant server capacities for RS data processing;
  • A team of highly professional specialists in cartography and photogrammetry.

Our partners