Sat-Sun: Non-working days
Customer
Trade secretProject's objective
Monitoring and assessment of the state of green spaces within the city boundaries based on remote sensing data (satellite images).
Work description
The work was carried out within the administrative boundaries of the city. The total area of the study was 1,770 square kilometers.
At the first stage, satellite images of medium spatial resolution Sentinel-2 (10 and 20 m) were selected. A new survey was conducted from the WorldView-3 satellite (0.5 m).
After the survey was completed and the materials were received, the data was processed at the second stage.
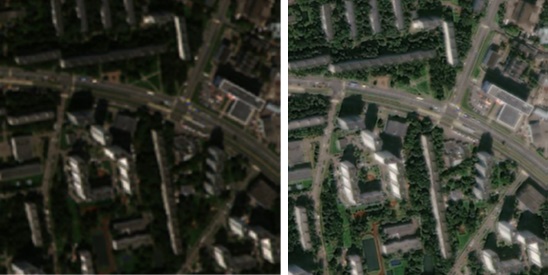
To improve the binding of WorldView-3 images and reduce distortion caused by terrain and shooting conditions, an ortho-transformation procedure was performed using a digital terrain model (DTM) and rational polynomial coefficients (RPC). Next, to identify the classes of woody-shrubby and herbaceous vegetation more accurately, pansharpening was performed – increasing the spatial resolution of spectral channels by merging panchromatic and multi-zone images.

Fig. 1. A fragment of the WorldView-3 snapshot Before (left) and After (right) the pansharpening procedure.
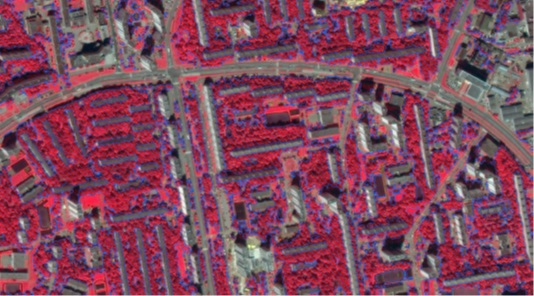
At the third stage, digital thematic cartographic layers of the distribution of tree and shrub vegetation (hereinafter TSV) and herbaceous vegetation (HV) were created from the Sentinel-2 and WorldView-3 images);

Fig. 2 Fragment of a layer of tree and shrub vegetation
At the fourth stage, the data were prepared for in-situ verification to develop thresholds for classification. The NDVI, NDMI, and ARI indexes were constructed from the Sentinel-2 and WorldView-3 images for June and May. The resulting indices, as well as their dynamics for May-June, were analyzed in detail.

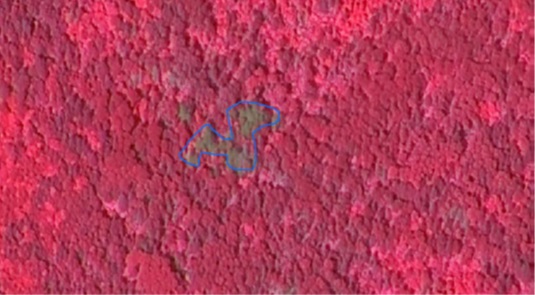
Fig. 3 Fragment of the image with the identified focus of shrinkage in the KOMPSat-3 image
At the fifth stage, full-scale verification was carried out to confirm and verify on-site the results obtained by the remote sensing.
At the sixth stage, digital thematic cartographic layers were created and analyzed to assess the state of green spaces; reporting materials were created.
Results
In a short period of time (1 month), the following data was received and edited:
-
Allocation of tree and shrub vegetation by area, as a percentage.
-
Allocation of grassy vegetation by area.
-
The area of the TSV with the classification NDVI (as well as NDMI, ARI1) by district.
-
Allocation of foci of TSV desiccation on the territory of the city (Fig. 3)
-
Identification of new felling of TSV on the territory of the city
-
Allocation of Sosnovsky Hogweed on the territory of the city.
The key success factor: highly qualified team of specialists of LLC "Geospatial Agency "INNOTER", training and consulting assistance from specialists not only from Russian organizations, but also from foreign ones, the use of the world's best remote sensing data in the project WorldView-3, the use of large data processing capacities (Big Data), participation in a team of experienced geographers, ecologists and GIS specialists, research collaboration with leading research universities of the country and the world.
Need for consultation?
Fill the form and we will contact you
