of geospatial solutions
Sat-Sun: Non-working days
Customer
Environmental organization*
Project's objective
Based on the obtained values, tree species maps, vegetation assessment maps, and maps of the distribution of leaf surface index values were compiled. The results were also compared with the materials of the previously performed forest inventory and a report on changes was generated*.
*Under the terms of the contract, this information (all the results of the work and the customer) is secret.
Completed work
Work description
Pskov is a city in the North-West of Russia. It is the regional center of the Pskov Region. Pskov is in the west of the European part of Russia, at the confluence of the Pskov River with the Velikaya River and 16 km from the confluence of the Velikaya River with Lake Pskov. The city is in the center of the Pskov Lowland. The area of the city is 95.6 sq. km. The length of the city from north to south is 9.2 km, and from west to east is 10 km. The average height above sea level is 46.5 m. Pskov has a high degree of landscaping, many landscaped streets, and courtyards. The total area of Pskov's parks and squares is more than 40 hectares. The main vegetation is represented by mixed forests. The climate of Pskov is temperate continental. In Pskov, sod-podzolic soils predominate.
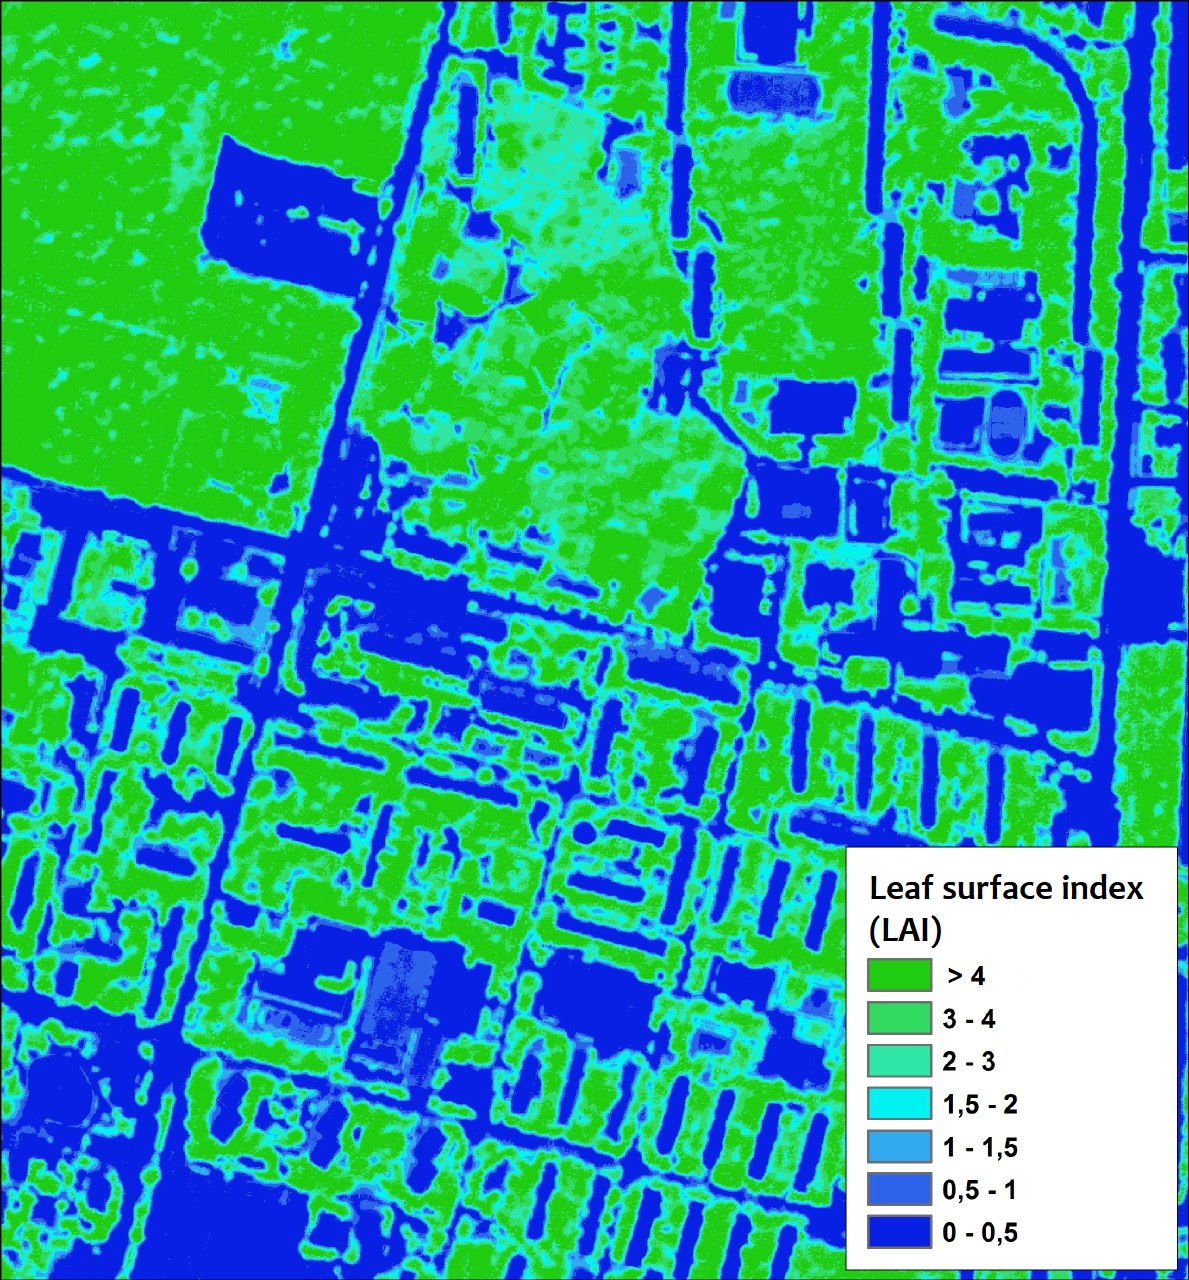
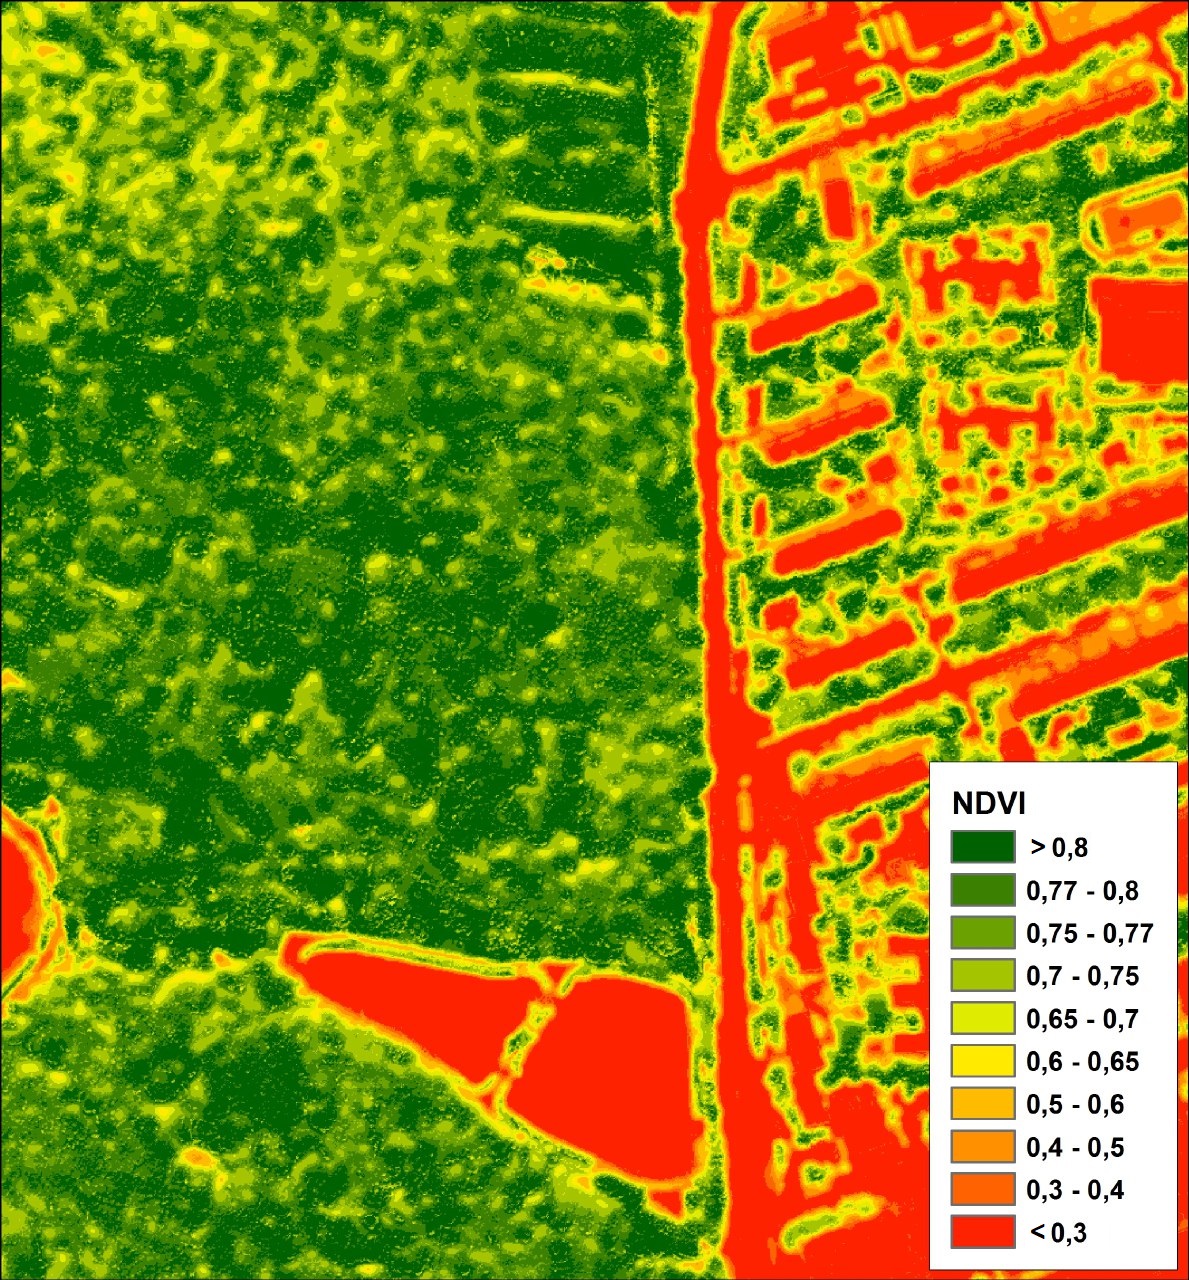
In the study area, work was carried out using modern remote sensing methods based on ultra-high-resolution satellite imagery and classical geobotanical surveys. The joint technology of combining traditional and modern methods is due to the need to confirm the indicators of the environmental assessment of forest stands obtained from remote sensing materials. These indicators allow us to assess the structure and condition of forests by the effectiveness of their functions under high anthropogenic load. Main methods: normalized relative vegetation index (NDVI) — an indicator for quantifying photosynthetically active biomass, which allows you to determine the density and condition of vegetation; leaf surface index (LAI) — an integral indicator that provides information about the assessment of biomass and productivity of forest ecosystems. To calculate the LAI index, LIDAR photography is usually used, but to save budget, stereo photography with a large overlap was used. This allowed us to find out that this method is well suited for assessing the state of the upper layer of the stand.
The satellite survey was conducted in June during the active vegetation period from the Kompsat spacecraft in stereo mode with a spatial resolution of 0.4 m. To improve the spatial reference of the images, an automated construction of a digital terrain model (DEM) was performed based on the stereo pairs of satellite images. Further, the obtained DEM and the available RPC coefficients were used for orthotransforming the images. The orthophotoplane was created and photogrammetric processing was carried out in the Photomod program.
At the next stage of the work, the height of vegetation in parks, forest parks and forests on the territory of the work was calculated. For this purpose, a digital surface model (DMP) was additionally created based on the materials of stereo photography, which reflected the surface of the tree crowns. Since both the DEM and the CMM are a geographically linked matrix of elevation values, the determination of the height of the stand consists of subtracting the values of the DEM from the CMM in the study area.
Further, using the classification with training, areas of coniferous and deciduous vegetation were identified. Identification of rocks was carried out both by direct decoding features (the structure and shape of the crown) and by indirect ones (the NDVI level). Estimation of the leaf activity index by recalculating the vegetation indices and the vegetation height map. To determine the presence or absence of vegetation cover for each pixel, the vegetation index GLA in the QGIS program was used. All pixels with a value greater than 0.2 were considered covered by vegetation. The resulting GLA index and a digital model of vegetation heights were used to calculate the "gap share". The percentage of gaps is a characteristic of the stand, and it is calculated on the area of plots with homogeneous vegetation. As a result, the LAI index and NDVI index were calculated for each pixel of the study area. The result was exported as a grid of index values, colored according to the established norms and corresponding values.
Results
Based on the obtained values, tree species maps, vegetation assessment maps, and maps of the distribution of leaf surface index values were compiled. The results were also compared with the materials of the previously performed forest inventory and a report on changes was generated*.
*Under the terms of the contract, this information (all the results of the work and the customer) is secret.
Need for consultation?
Fill the form and we will contact you
Sat-Sun: Non-working days