Contact

What the service is used for

Infrastructure planning and monitoring
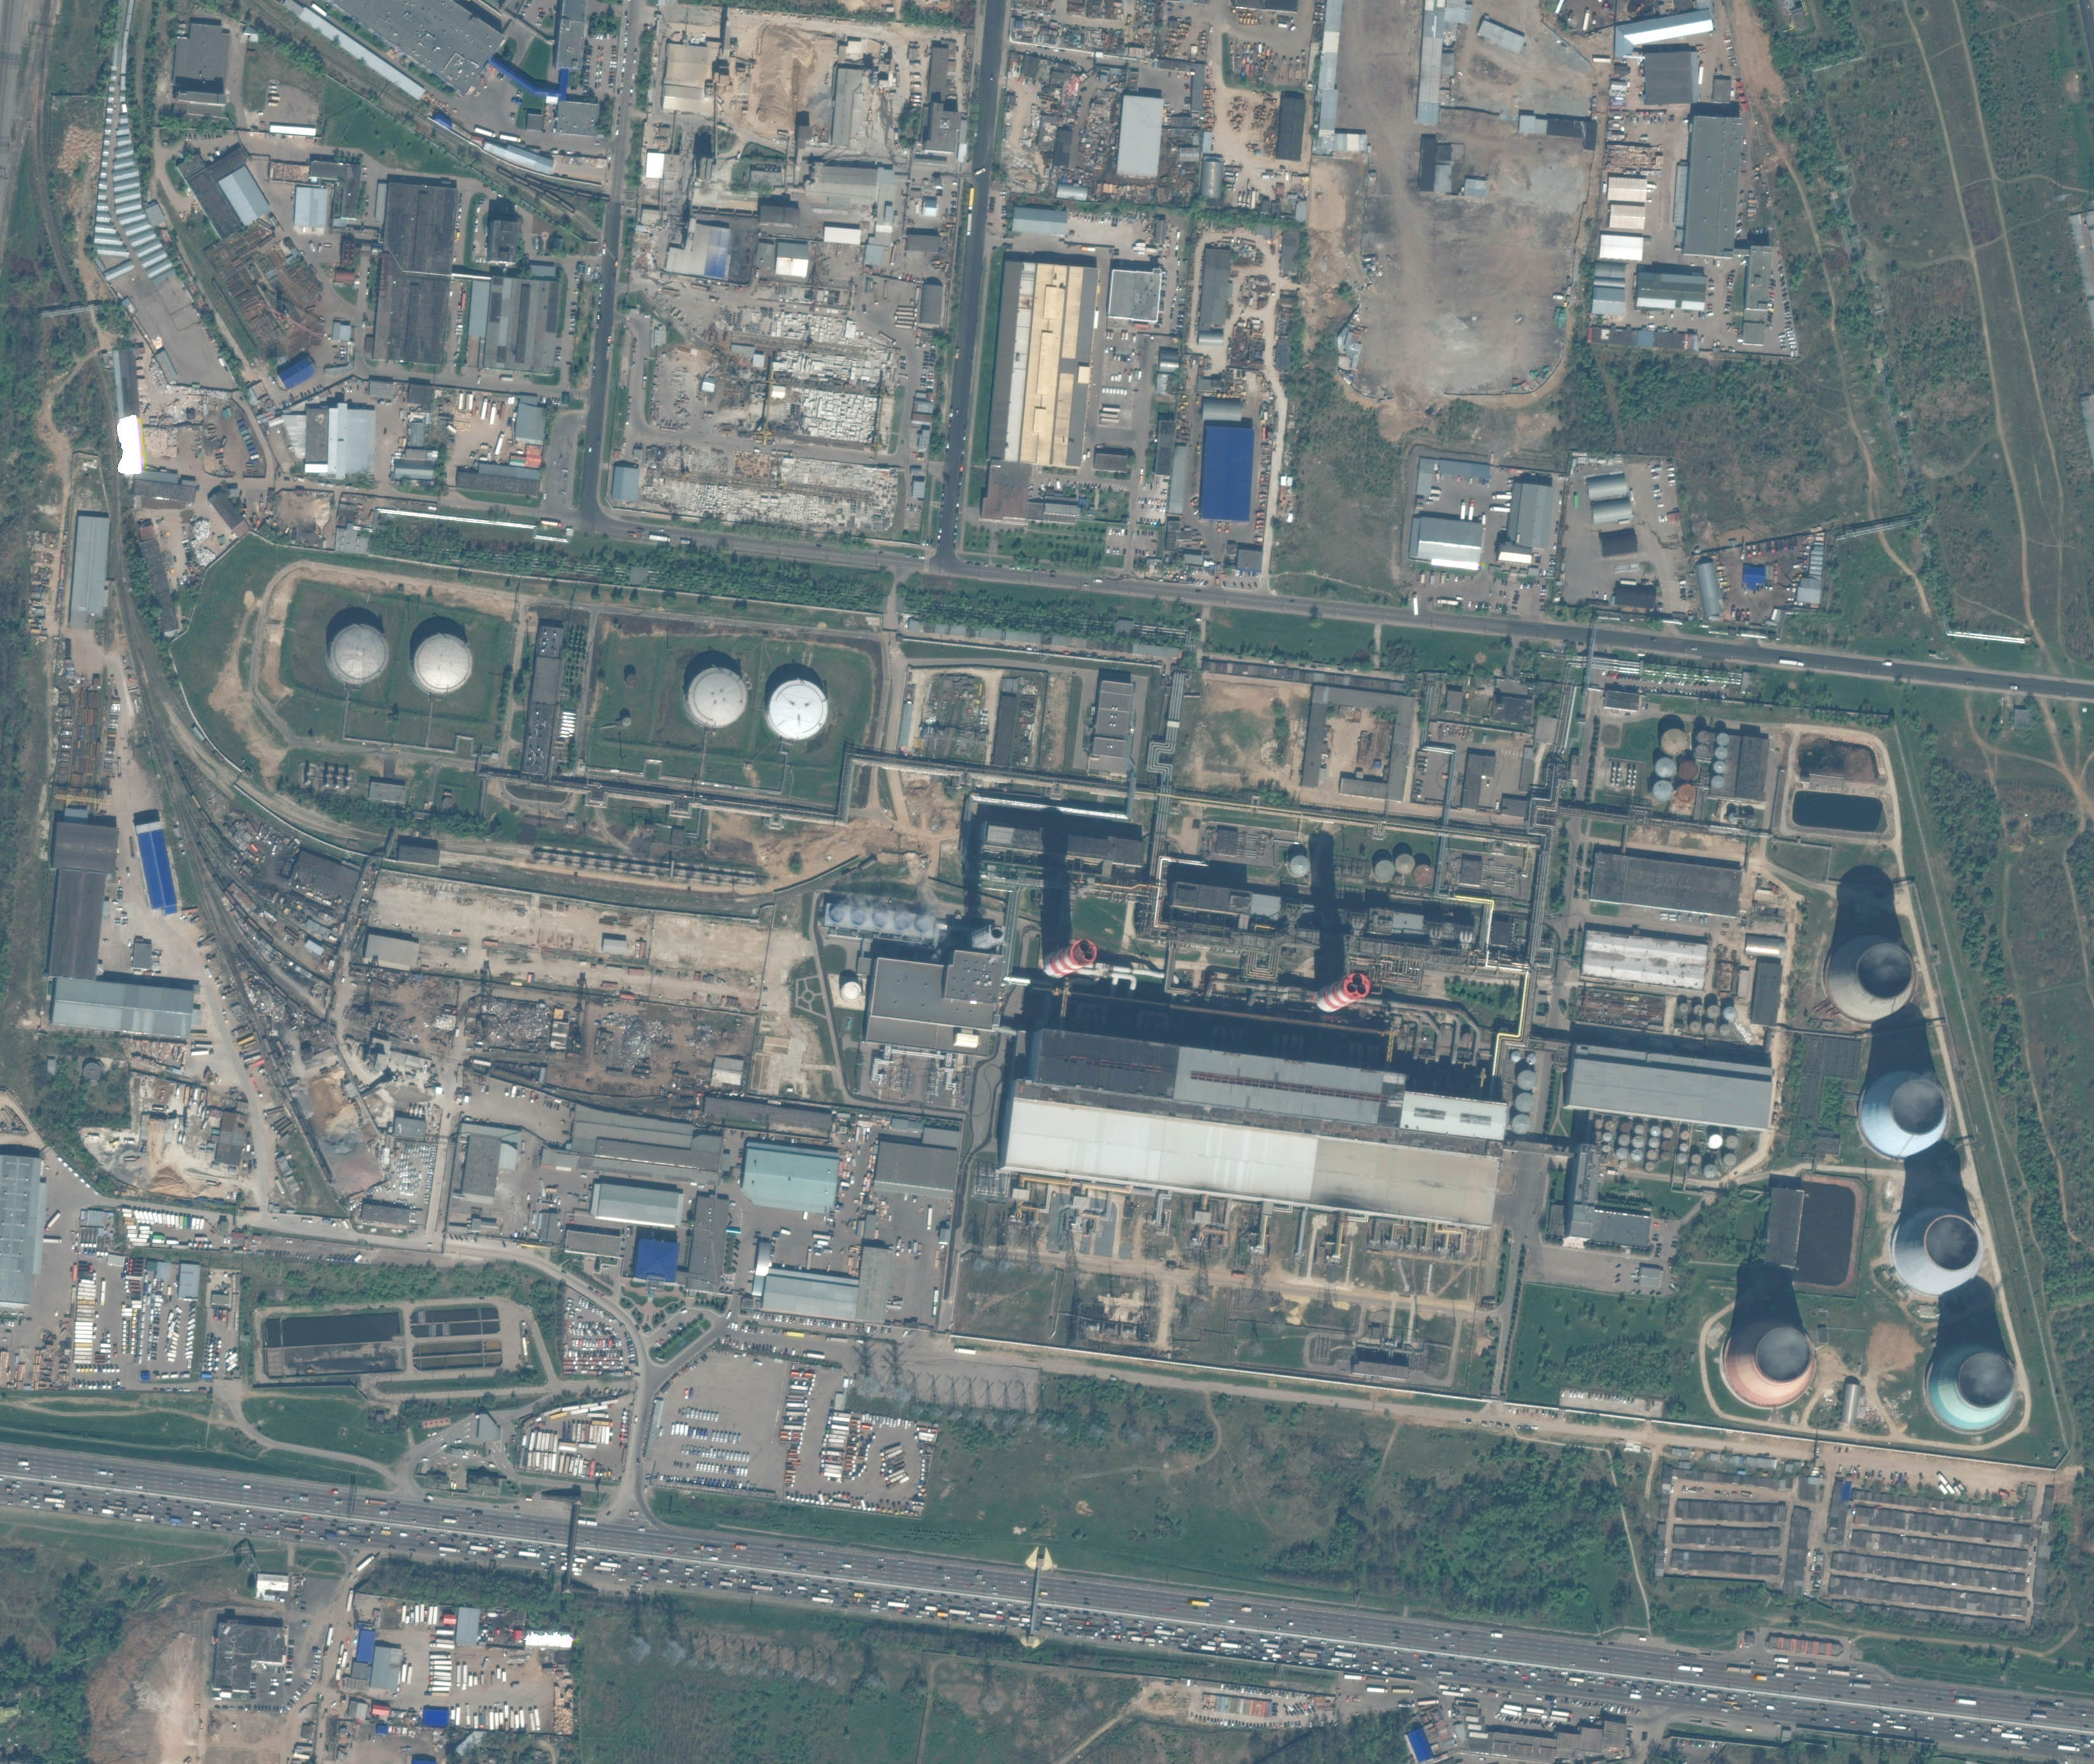
Planning, management and monitoring of energy infrastructure from space using satellite RS imagery.
Geospatial analytics
Geospatial analytics based on RS-GIS software for strategic asset and risk management.
Asset integrity
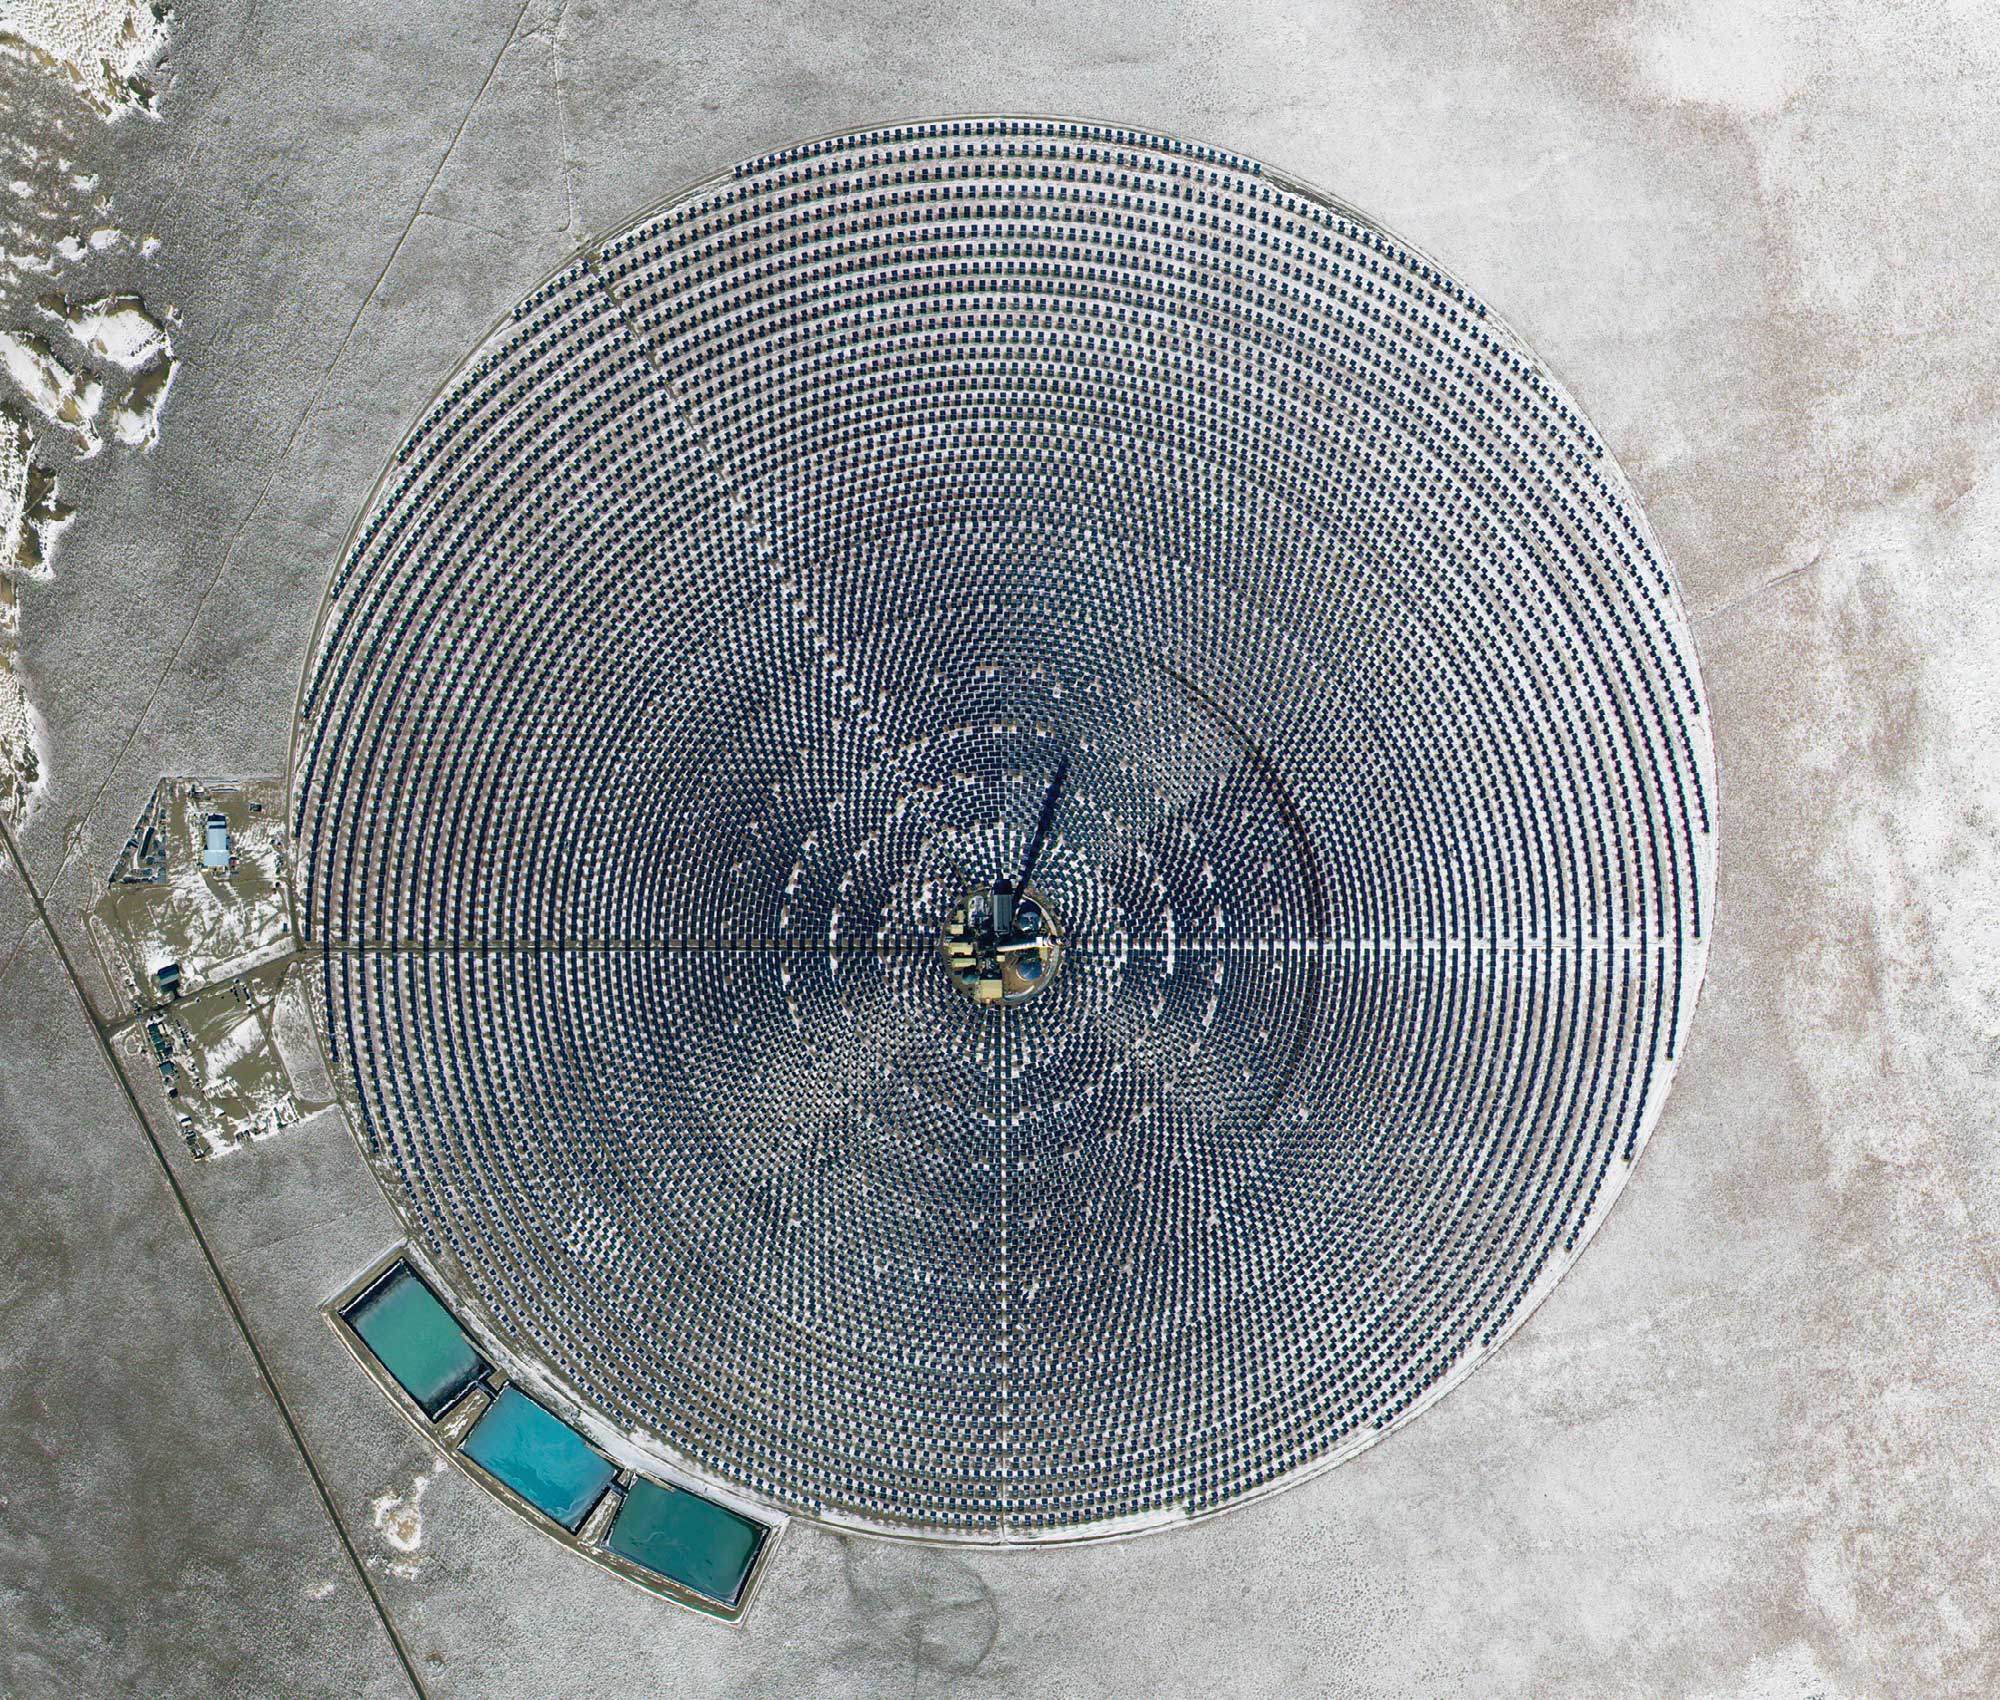
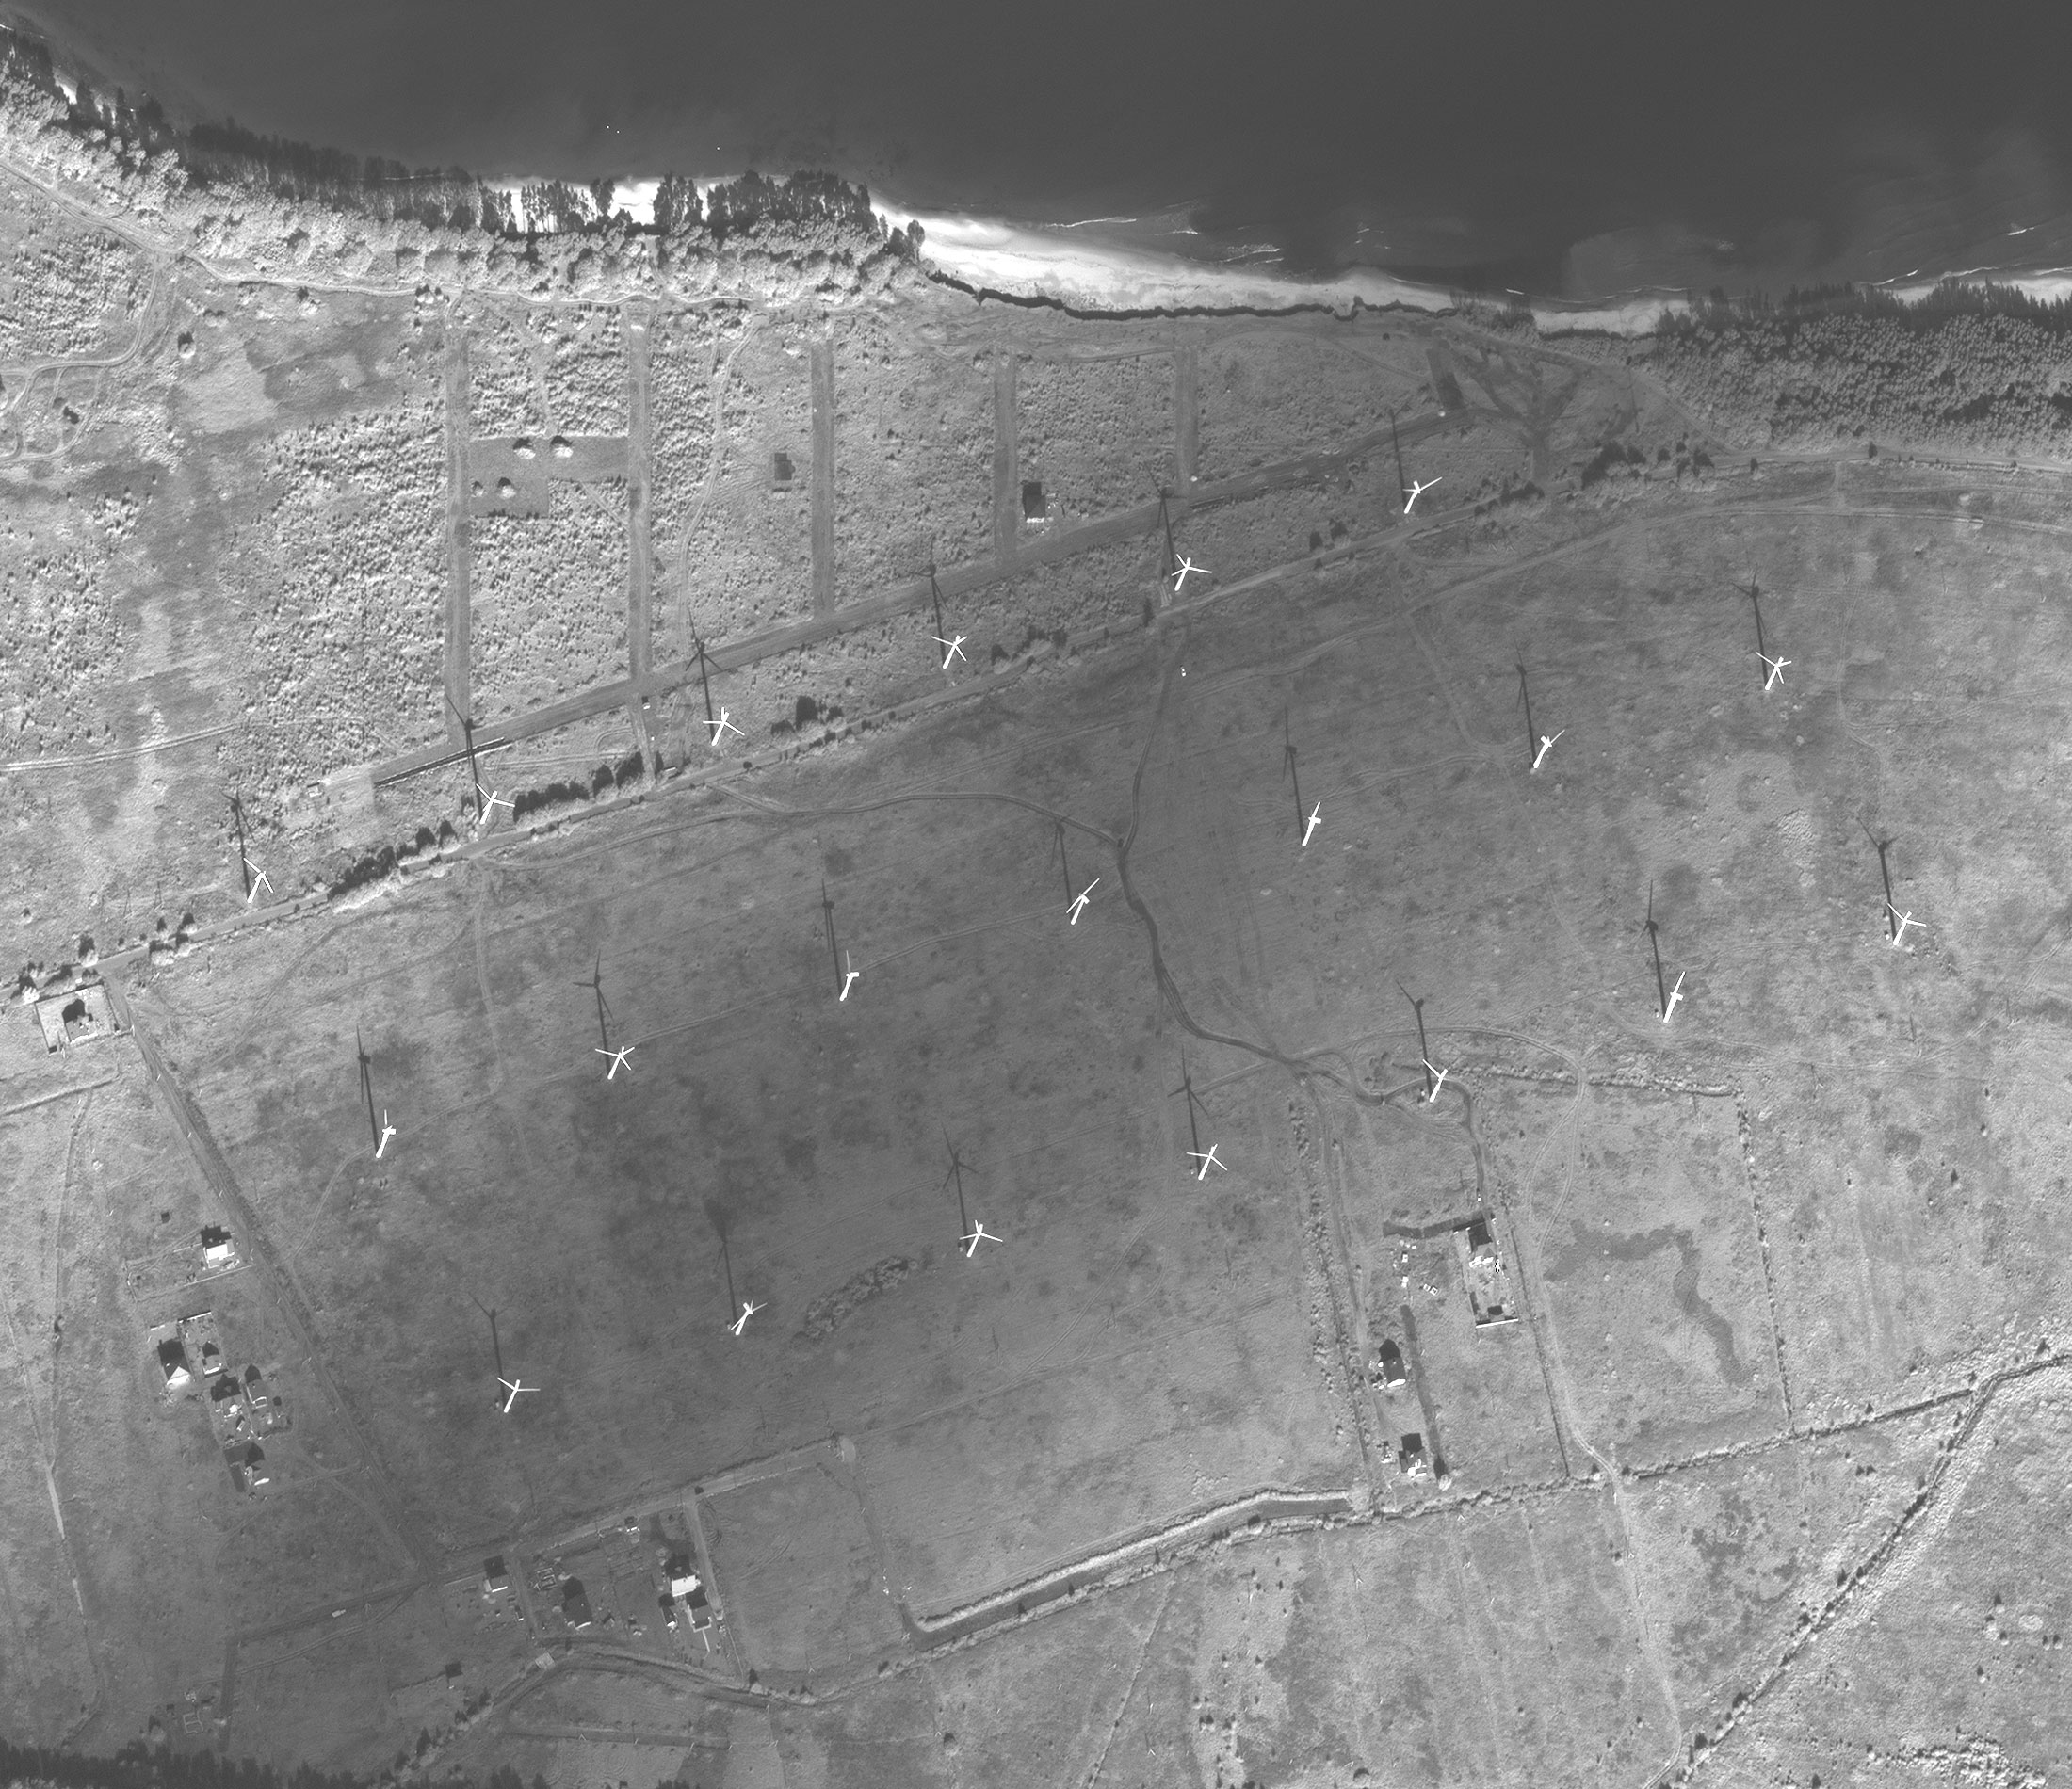
Monitoring of structural integrity of towers, poles, wind and solar power plants: damage, degradation, corrosion.
Ground subsidence
Monitoring of ground subsidence around pipelines, power lines, transformers and plants.
Oil stocks
Measuring actual oil stocks from satellite imagery with high accuracy.
Need monitoring of energy facilities?
Describe the facility, route or site. A specialist will select the archive, new survey and map composition.

Solutions for the energy industry

Thematic infrastructure maps, displacement maps, orthophotomaps and an analytical report — from archive, new survey or UAV.

01

HPP seismic microzonation

Interferometric processing of radar images for seismic microzonation at the investment-justification stage in hydropower.
Within the area of interest, lineaments and faults are identified. Using 48 suitable Sentinel-1 images from the last 5 years from a single orbit, the Persistent Scatterers (PS) method is applied — the highest possible accuracy of displacement estimation. Maps of mean annual ground-surface displacement rates at 1:25 000 scale are produced and the dynamics of slope processes are assessed.
What you get
  • maps of mean annual displacement rates at 1:25 000 scale
  • schemes of lineaments and faults
  • assessment of slope dynamics from displacement maps
The processing composition depends on the Sentinel-1 archive, orbit geometry and the terms of reference.
02

Oil and gas pipeline monitoring

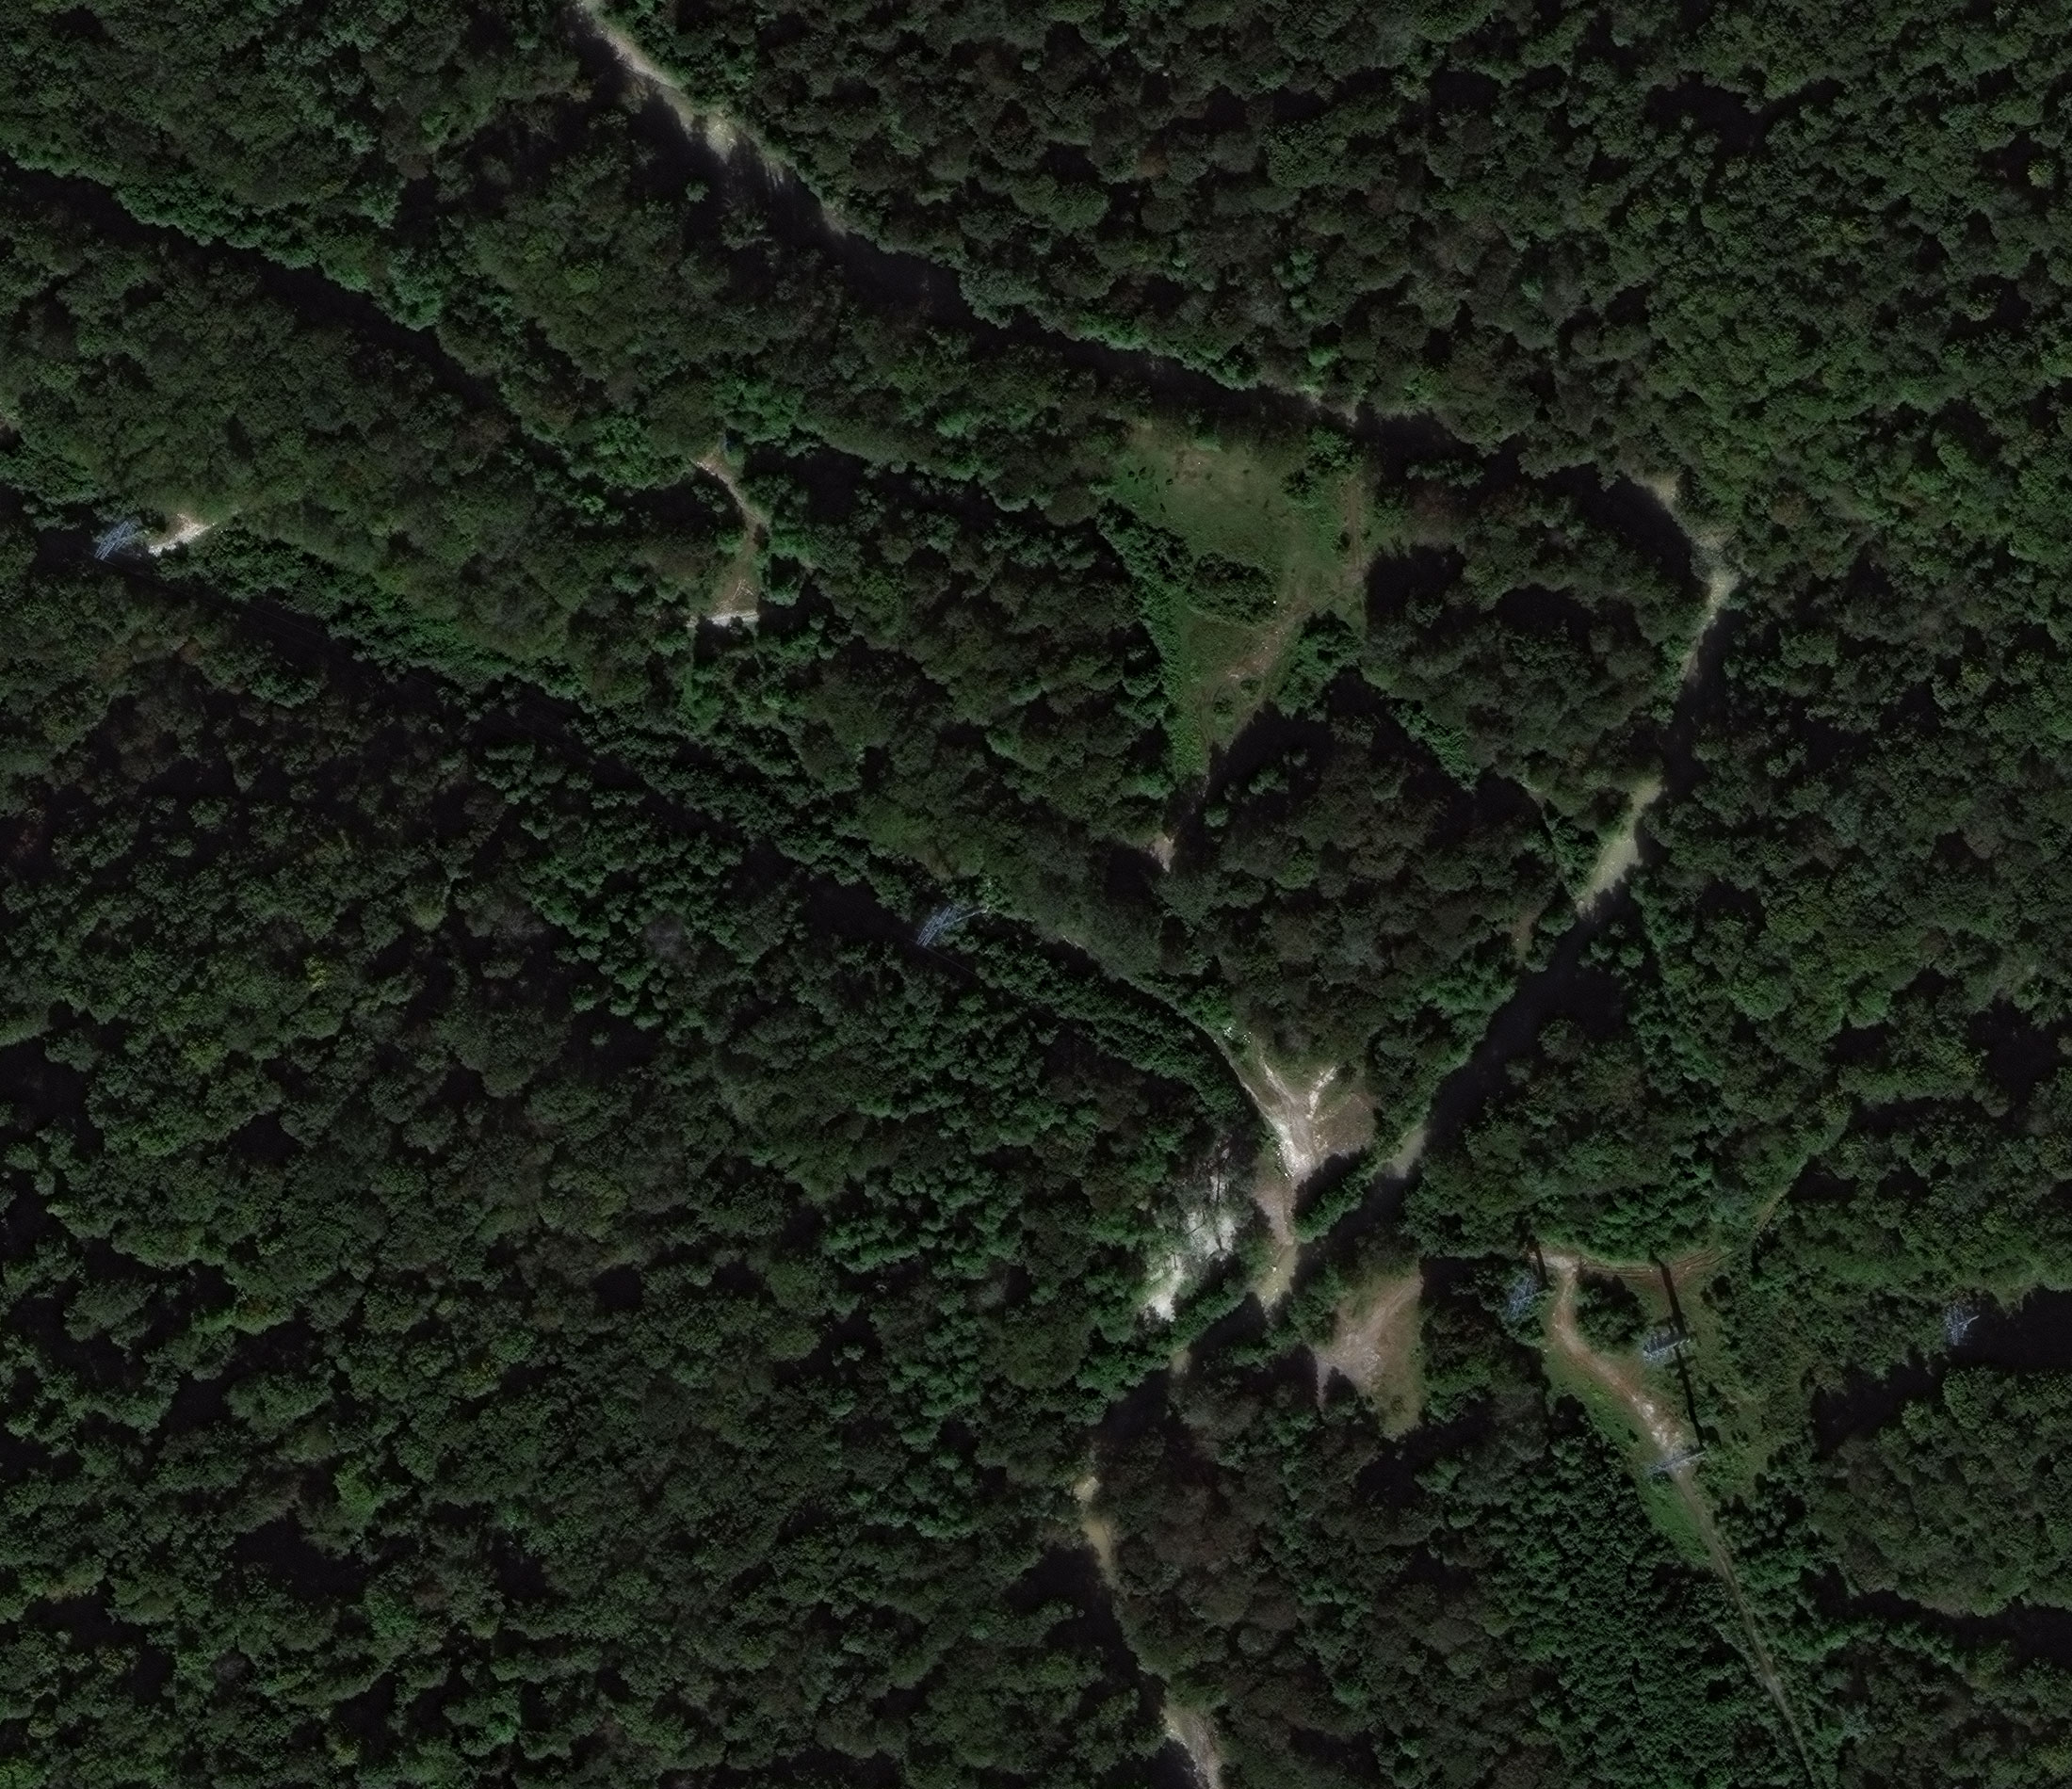
Condition control of trunk oil pipelines: satellite images and UAV flights to identify potentially hazardous situations.
A comprehensive monitoring cycle combines satellite RS survey and UAVs. This detects illegal activity in the protection zone, pipeline operation violations and produces statistics on violation frequency. The goal is to reduce accident rates, unscheduled repairs and environmental damage.
What you get
  • up-to-date information on infrastructure condition
  • recording of violations in the protection zone and along the route
  • statistics on the nature and frequency of violations to reduce risks
Survey frequency, resolution and the UAV route depend on the route length and the terms of reference.
03

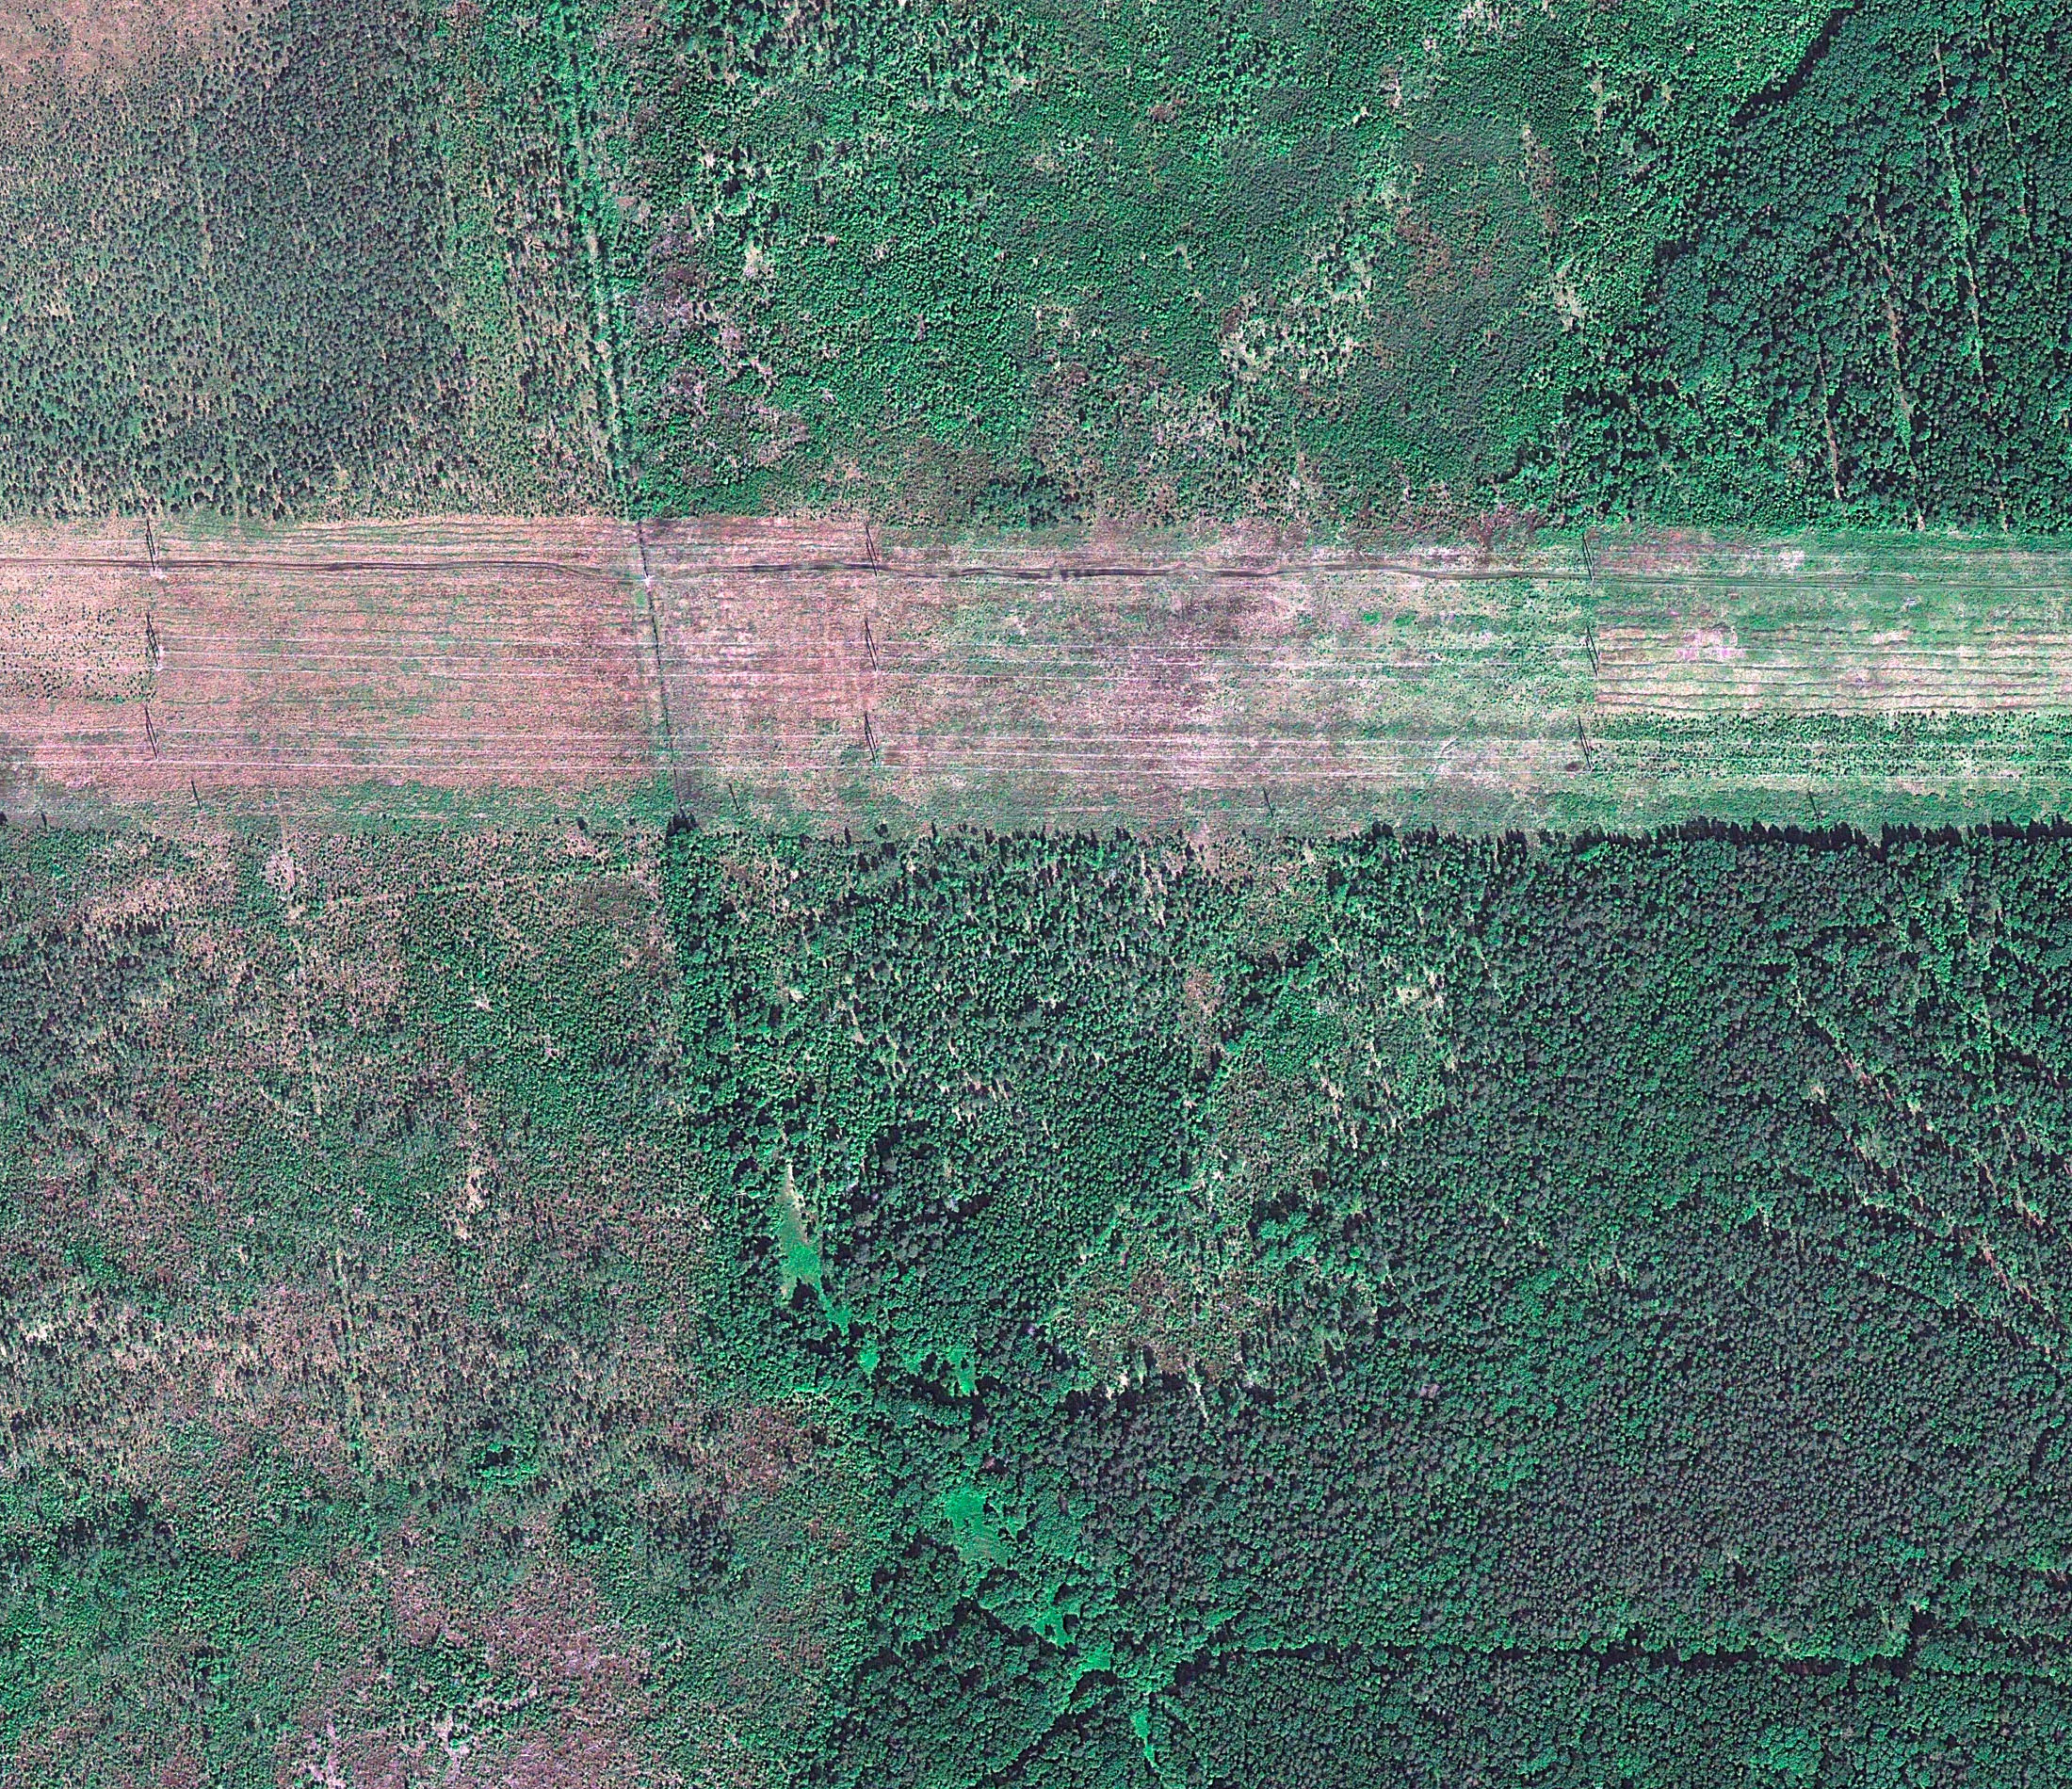
Survey of power lines and energy infrastructure

Monitoring of power plants, power lines, heat networks and other objects: satellite images and UAV survey without shutting down equipment.
Orthophotomaps, digital terrain models and 3D models are built from aerial photography. They are used to determine plan coordinates and heights of power-line towers, and to compile topographic and thematic maps for designing new routes, reconstruction and access selection. Satellite survey monitors tree and shrub vegetation in protection zones, landslides and ground subsidence.
What you get
  • orthophotomaps, DTMs and 3D models of towers and routes
  • tower coordinates and heights, topographic and thematic maps
  • monitoring of vegetation, landslides and subsidence in protection zones
Coordinate accuracy and 3D composition depend on survey resolution, ground control and the terms of reference.
04

Oil stocks and situational awareness

Satellite images for mapping production facilities and measuring actual oil stocks with high accuracy.
High-resolution optical images provide repeatable information on critical infrastructure, including oil pipelines, at local and global scale. Big-data aggregation and machine learning accelerate extraction of energy-system parameters. Very-high-resolution 30 cm images make it possible to detect heavy construction equipment near pipeline corridors.
What you get
  • mapping and monitoring of activity at production facilities
  • assessment of actual oil stocks from RS data
  • change control along infrastructure corridors, including from 30 cm images
Availability of the 30 cm archive, cloud cover and frequency depend on the operator and the terms of reference.

How the work goes

1
You send the task and the outline
You specify the facility: HPP, TPP, power lines, pipeline, SPP/WPP or a stock site — and the observation period.
2
We select the archive and survey
Optics, Sentinel-1 / SAR radar, aerial photography or UAV — archive or new survey for the task.
3
Processing and analysis
PS interferometry, machine learning, GIS, orthophotomaps, DTM and 3D models of supports.
4
Risk monitoring
Subsidence, vegetation in corridors, illegal activity, natural disasters — on the agreed cycle.
5
Maps and a report
Displacement maps 1:25 000, orthophotomaps, infrastructure layers and an analytical report — in the client's format.
Ready to discuss an energy facility?
Send the outline and the task. We will prepare the RS data composition and a preliminary estimate.

Cost and timeline

The cost and timeline of energy-sector work depend on the infrastructure facility, survey type and the set of RS maps.
  • task: infrastructure monitoring, asset integrity, ground subsidence, oil reserves, pipeline and power-line corridors, renewable energy
  • data type: satellite (optics and radar), aerial photography, UAV; archive or new survey

The cost of the work is calculated individually

Timelines depend on the area, survey type and product composition

The final estimate is agreed after the facility and the map set are described

What is needed for a quote

To agree the ToR for the energy sector, provide:
  • task: infrastructure monitoring, asset integrity, ground subsidence, oil reserves, power-line and pipeline corridors, wind or solar plants
  • area of interest — facility outline, routes, HPP/TPP/SPP sites or a shapefile
  • period: operational control, a retrospective or an observation cycle
  • whether you have your own images or need archival / new satellite imagery, radar, aerial photography or UAV
  • whether displacement maps, orthophotomaps, 3D models of supports, vegetation assessment in corridors or reserves measurement are needed
  • requirements for the format of maps, the coordinate system and layers, if they are already known

If survey parameters have not been set yet, describing the facility and the goal is enough — specialists will propose the RS data composition.

Why Innoter

Prompt access to archives
Suitable archive imagery can be obtained faster when the required area and date are already available from operators.
No aviation clearances
A new satellite survey does not require the flight clearances typical of aerial surveys.
Large and remote areas
A single satellite pass covers large areas and makes it possible to work in hard-to-reach regions.
Direct agreements with operators
Distribution agreements help select archive imagery and order new surveys from different providers.
Software and server infrastructure
Modern software and computing capacity for quality control and processing of large data volumes.
Experienced specialist team
Years of experience on complex projects and specialists in cartography, photogrammetry and remote sensing.

RS data, infrastructure and monitoring composition

The composition depends on the energy facility, archive or new survey, optics, radar or UAV, and map requirements.
1

The energy industry is a set of sectors related to the production and sale of energy: fuel extraction, production, processing and distribution. Modern society consumes a large amount of fuel; energy is a vital part of infrastructure in almost all countries.

It includes: fossil fuels (oil, coal, gas — extraction, processing, transportation and sales); electric power (generation, distribution and sales); nuclear power; renewable sources (hydro, wind and solar power, alternative fuels); traditional energy from firewood, especially in poorer countries.

2

The global energy-as-a-service (EaaS) market in 2021 was valued at USD 64.34 billion. Forecast: growth from USD 70.46 billion in 2022 to USD 147.56 billion by 2029 at a CAGR of 11.1%. The overall energy market exceeds USD 1.5 trillion.

Quality information on energy systems is needed for research, modelling and decisions. Global energy does not operate without digital technologies. Remote sensing data (satellite images, aerial photography, UAVs) is a potentially rich source of information on energy systems; the volume and complexity of the data rule out manual analysis. Breakthroughs in machine learning make it possible to automatically extract energy system parameters at large scale.

3

Satellite RS products provide images in different spectral bands (optics) and in different polarisations (radar). Big data aggregation and machine learning make it possible to visualise flows in geographic information systems (GIS) and to enhance situational awareness.

High-resolution optical images are a tool for monitoring critical infrastructure, for example oil pipelines: repeat information at local and global scale. Combining data sources with AI yields additional information autonomously and faster. Stereo images (3D models) show the height, density and type of plants in power-line corridors. Very-high-resolution 30 cm images detect heavy construction equipment near pipeline corridors.

4

Planning, management and monitoring of energy infrastructure from space; geospatial analytics based on RS-GIS software for asset and risk management; monitoring of structural integrity of towers, poles, wind and solar plants; ground subsidence around pipelines, power lines, transformers and plants; damage, degradation and corrosion; operational risk; natural disasters (floods, fires, earthquakes, ground subsidence); measurement of oil stocks; crisis management of energy-supply interruptions, including those caused by vegetation in corridors.

Planning of new infrastructure; environmental assessment of operation; assessment of RES potential (in-situ measurements, LIDAR and SODAR, satellites, reanalysis data); identification of suitable sites from land-use maps; wind load for wind farms; shade and sunlight for solar plants; roof area for solar panels; urban energy tools.

5

RS reduces the need for specialist inspections and provides independent analysis; makes monitoring of energy assets more economical than field work; expands decision support. In crisis management the situation can be observed in near real time.

Stereo images save funds relative to airborne and on-site inspections in power-line corridors. 30 cm imagery in mapping software helps track changes at pipelines more cheaply than aerial and ground inspections. Manual maps and aerial photography cannot keep up with satellite RS. A combination of RS methods is more effective than a field solution over large areas. Monitoring of extensive territories and point objects in a near-real-time mode is critical for analysing energy markets and responding to hazardous events.

6

Seismic microzonation of HPPs: 48 Sentinel-1 images over 5 years, persistent scatterer (PS) method, maps of mean annual displacement rates at scale 1:25 000, assessment of slope dynamics.

Oil and gas pipeline monitoring: UAVs and satellite images to detect illegal activity in the protection zone, violations along the route and to reduce accidents, unscheduled repairs and environmental damage. The main causes of accidents include corrosion, pipe defects and violations of operating rules.

Power line survey: inspection without shutting down equipment; orthophotomaps, DTM and 3D models; coordinates and heights of towers; monitoring of vegetation, landslides and subsidence in protection zones for design of new routes and reconstruction.

clients who trust us
25+ years in the geodata market
Request a call back
Back to page top
Мы используем Яндекс.Метрика и собственные Сookies для обеспечения наилучшего опыта работы на нашем сайте, персонализации сайта для наших пользователей и аналитики. Продолжая использовать сайт вы соглашаетесь с условиями Пользовательского соглашения.