of geospatial solutions
Sat-Sun: Non-working days
On May 11, 2021, the authorities of Komi introduced an emergency regime in the northeast of the republic. An accident occurred on the border with the Nenets Autonomous Okrug. The source of the river pollution was an oil collection collector from one of the wells in the area from the main pumping station (MPS) of the Oshskoye field to the DNS-5 of the Kharyaginskoye field. Lukoil-Komi acknowledged the oil as theirs—on May 12, a message about the detection of an oil-containing liquid leak appeared on the company's website.
Lukoil-Komi estimated the amount of spilled oil at 100 tons, with the pollution area covering 1.3 hectares. Five days later, it became known that oil from the Oshskoye field had traveled about 160 kilometers down the Kolva River, about 20 kilometers down the Usa River, where it flows, and about 140 kilometers down the Pechora River, into which the Usa flows.
To assess the consequences of the oil spill, we downloaded and analyzed 3 images obtained from the Landsat 7 and Sentinel 2 satellites. We also used an image obtained from Google Maps.
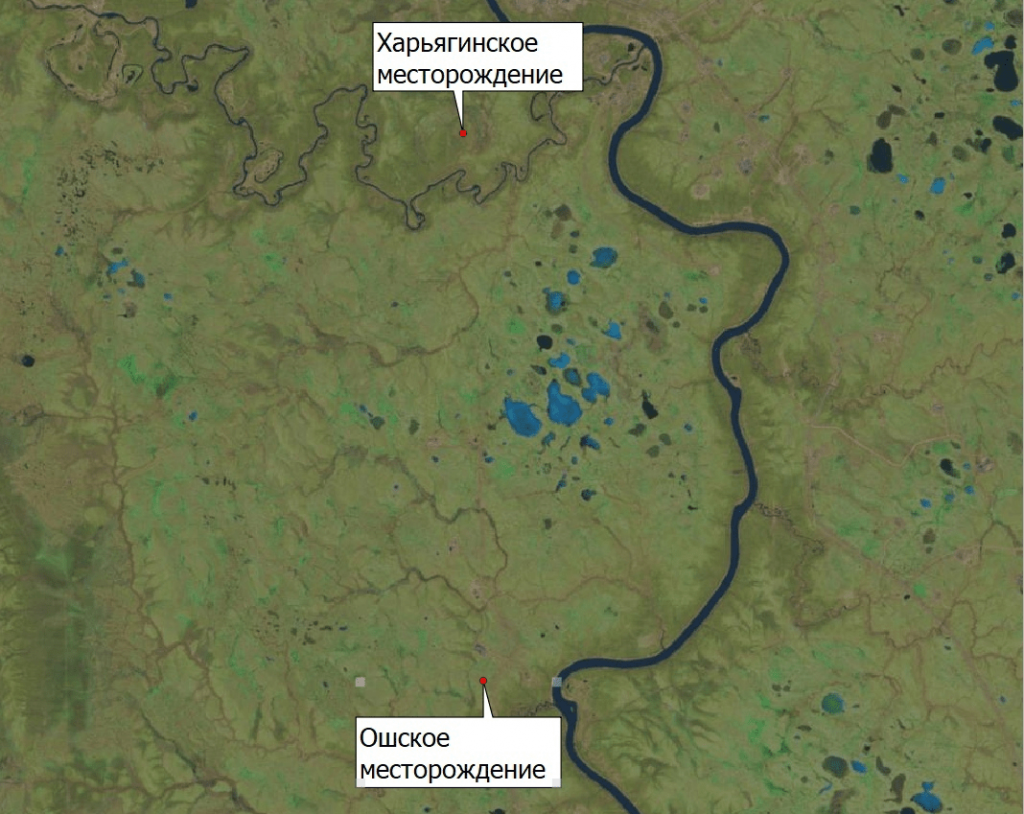
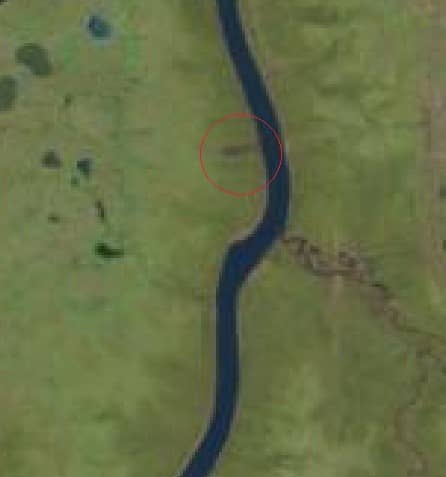
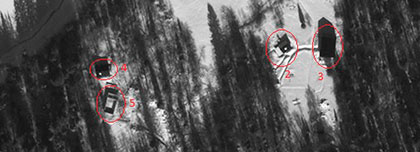
Initially, we conducted a visual inspection of the images. Since Lukoil's website did not specify exact locations, we analyzed (viewed) the pipeline route between the Oshskoye and Kharyaginskoye fields, between which the spill occurred. For this purpose, we used an image obtained from the Sentinel-2 satellite on May 17, 2021, six days after the accident. The images that were publicly available closer to the date of the spill had significant cloud cover, making inspection impossible.
Since the poor spatial resolution of the image does not allow us to quickly and accurately investigate the area for spills, we decided to use the NDVI index, which can also help locate the presumed leak. For this purpose, we downloaded an image of the area from the Landsat-7 satellite on May 17, 2021, in two channels: red and infrared. We then used the following formula:
NDVI = (NIR — RED) / (NIR + RED), where NIR is the infrared channel, and RED is the red channel.
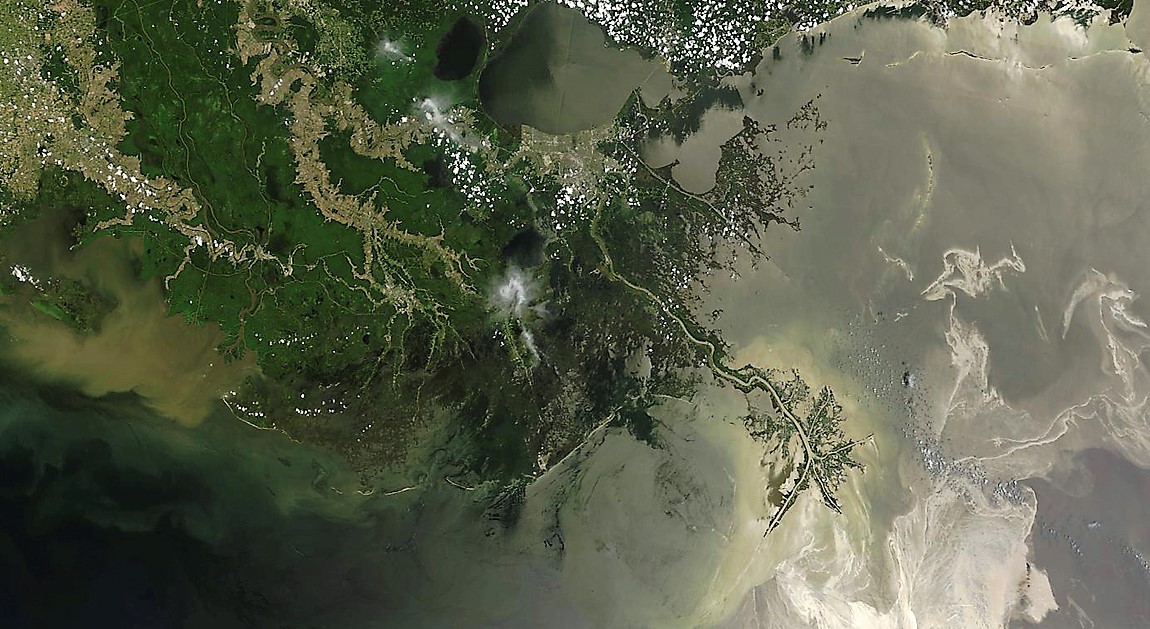
Next, by loading the NDVI color scale onto the resulting image, we obtained the following image:
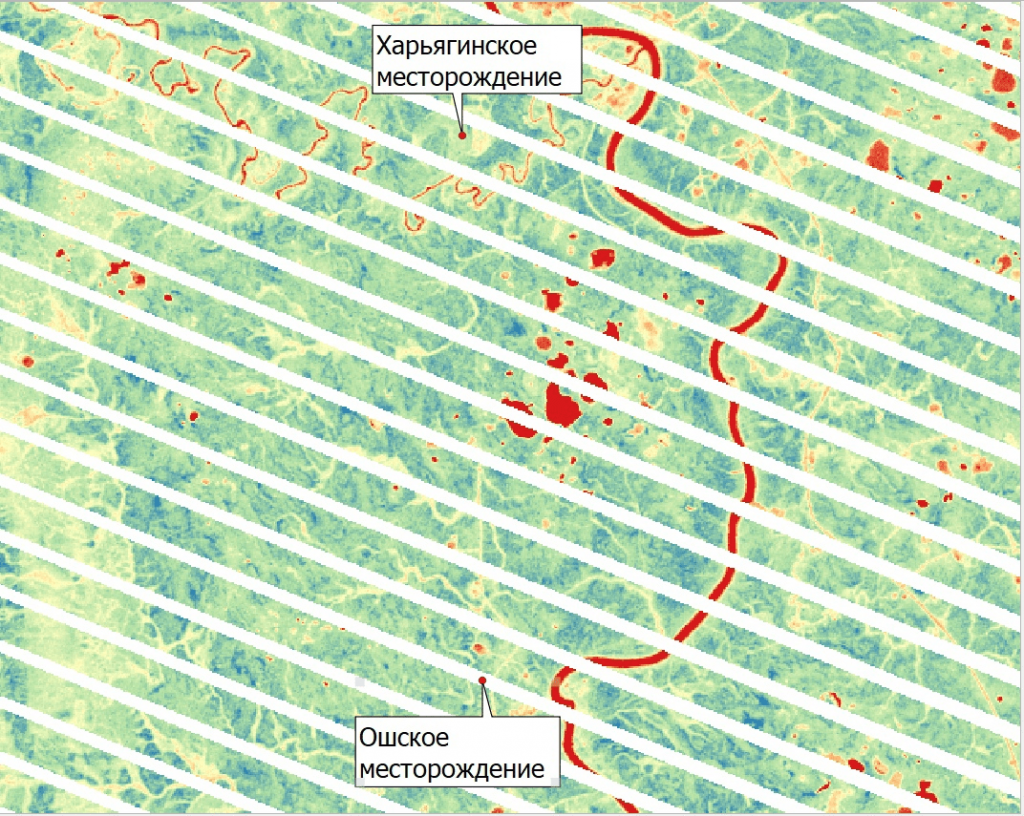
It was experimentally established that oil spills on the soil fall within the NDVI index range from -0.25 to 0.15.
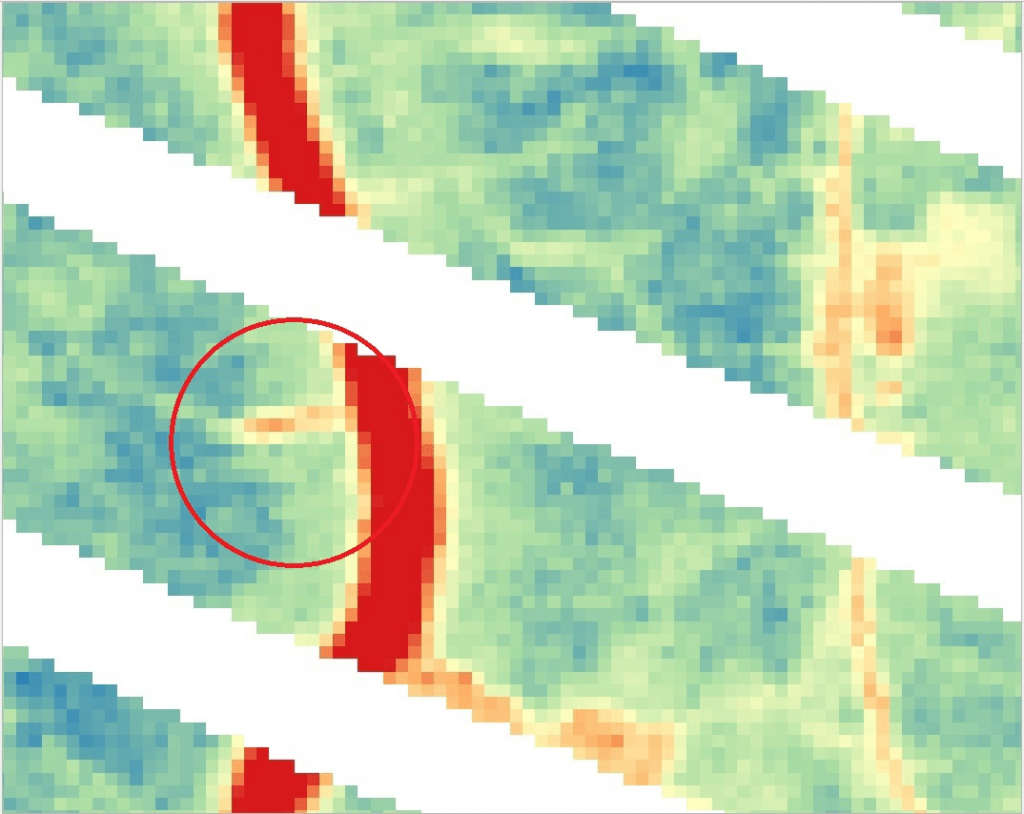
After conducting a detailed inspection using visual and NDVI methods, we discovered the location of the oil spill near the Kolva River.
The average NDVI value at the spill site is 0.07. This indicates that we are within the desired range for the spill. The average was calculated as follows:
- In the QGis program, click on the layer with the resulting image
- At the top of the workspace, click on the icon named "Identify Features," then click on the area of interest on the image, after which the NDVI value for the specific pixel will appear on the right side of the screen
3. Now, you need to "click through" the entire area of the supposed spill and calculate the average value. As we wrote above, in our case, it was 0.07.
Now, to confirm the location of the spill, let's refer to images taken in the same area but at an earlier time. This will allow us to verify that we have found an oil spill and not a random temporary water body.
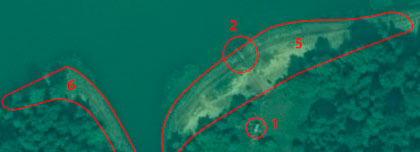
First, let's use an image obtained from the Sentinel-2 satellite on June 8, 2020.
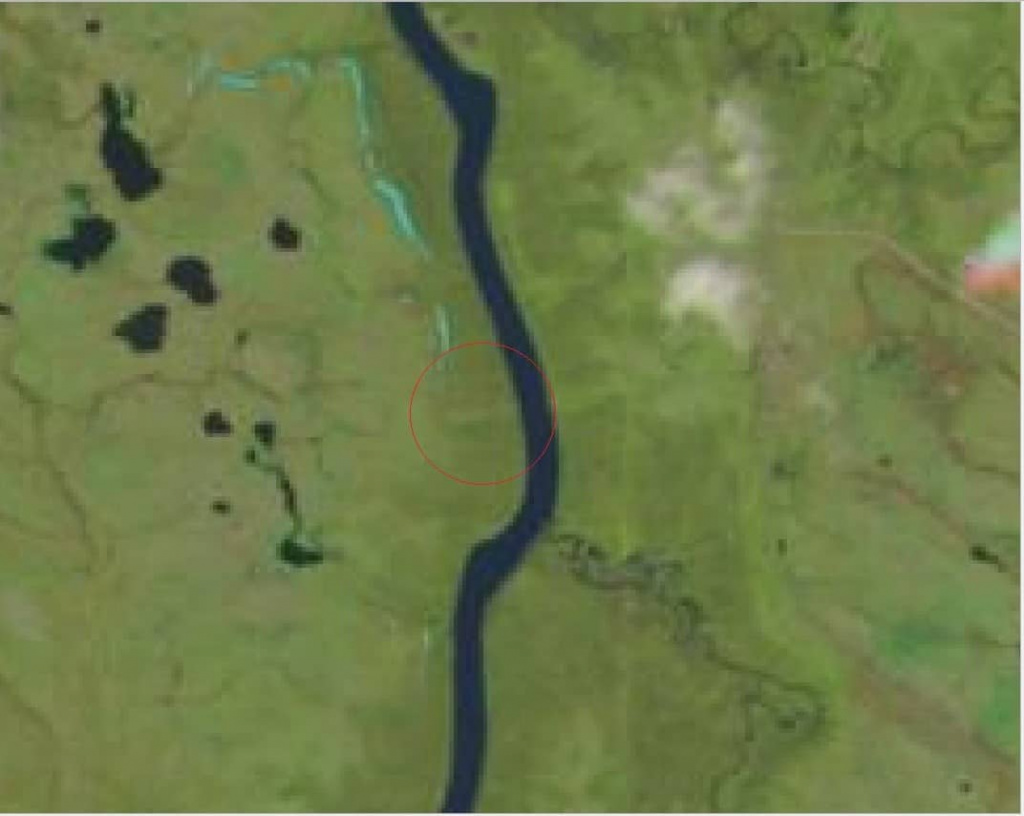
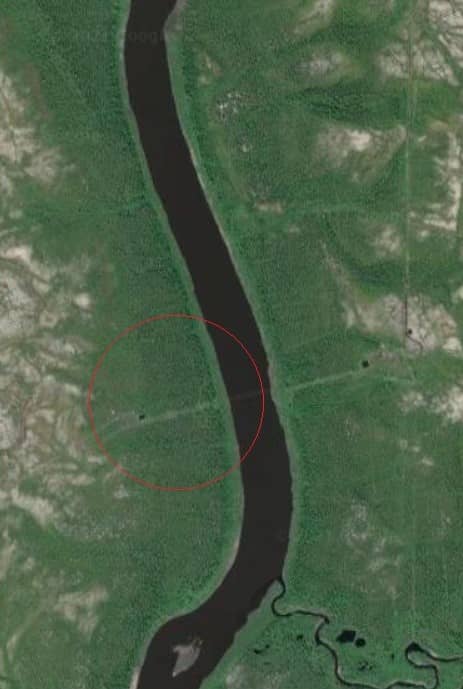
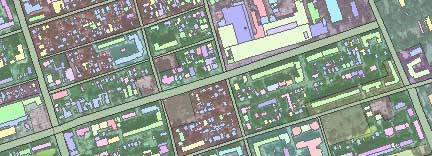
As we can see, almost a year ago, there were no dark spots in this location. The same can be said by looking at the Google image taken in 2021.
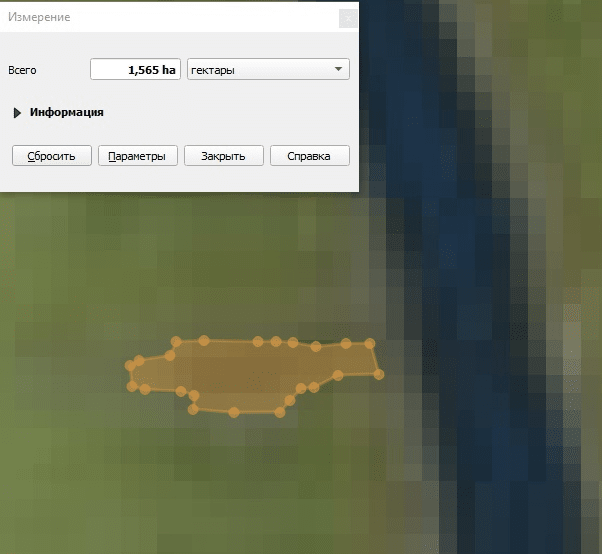
Now, having confirmed that we are indeed looking at an oil spill, let's estimate its approximate area. Since the spot area is small, we can use the "Measure Area" tool in the QGis program. By placing points around the perimeter of the area, we obtained a result roughly equal to the official data, namely 1.56 hectares.
Cleanup of the banks of the Kolva River from the consequences of the spill is still ongoing in Komi.
What conclusion can be drawn from all this? Love nature.
If you love it as much as we do, you can always contact the company Innoter by email: innoter@innoter.com for an environmental analysis of the area of interest to you.


Sat-Sun: Non-working days