The authors — a team led by Professor Jean-Louis Arcand of the Graduate Institute of International and Development Studies in Geneva — demonstrated that Earth observation can do more than simply map destruction: it can also translate physical damage into economic indicators that are understandable and actionable for policymakers, investors, and humanitarian organizations.
02
How it works: three layers of data
How It Works: Three Data Layers
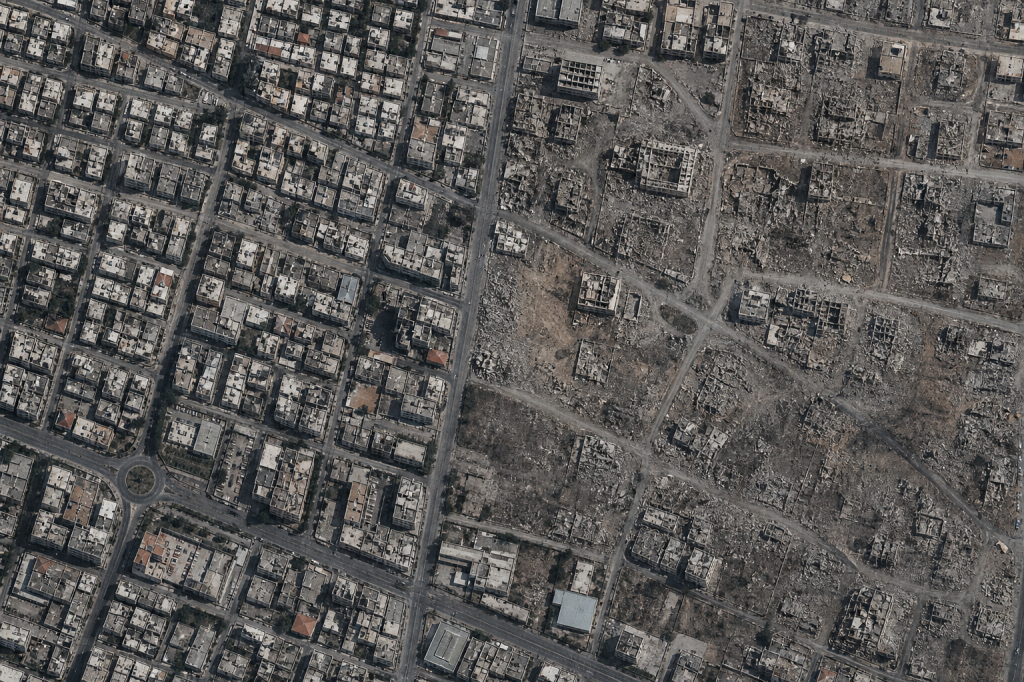
Satellite image of an urban area — destroyed zones vs. unaffected neighborhoods
The methodology is based on combining three independent data sources:
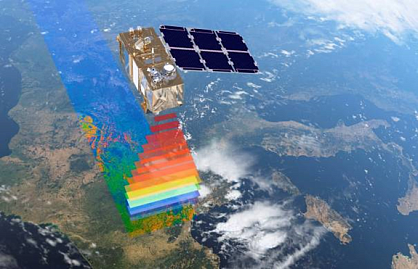
Radar operates regardless of cloud cover or time of day. Weekly Sentinel-1 passes made it possible to track surface changes at intervals of approximately 7 days — from the first airstrikes in October 2023 through autumn 2024. SAR data provided the clearest picture of physical destruction: what was destroyed, where, and when.
The brightness of urban lighting at night has long been recognized as an indirect indicator of economic activity. The more actively businesses, shops, transport systems, and households operate, the brighter a city appears in nighttime imagery. A sharp decline in luminosity signals a major slowdown or shutdown of economic activity.
3. Econometric model
Before the war, official statistics provided data on Gaza’s GDP and household incomes. The researchers built a correlation model linking “nighttime luminosity → economic activity” using pre-war data, and then applied it to the wartime period — producing a monetary estimate of losses in areas where field surveys were no longer possible.
03
What the data revealed
What the Data Revealed
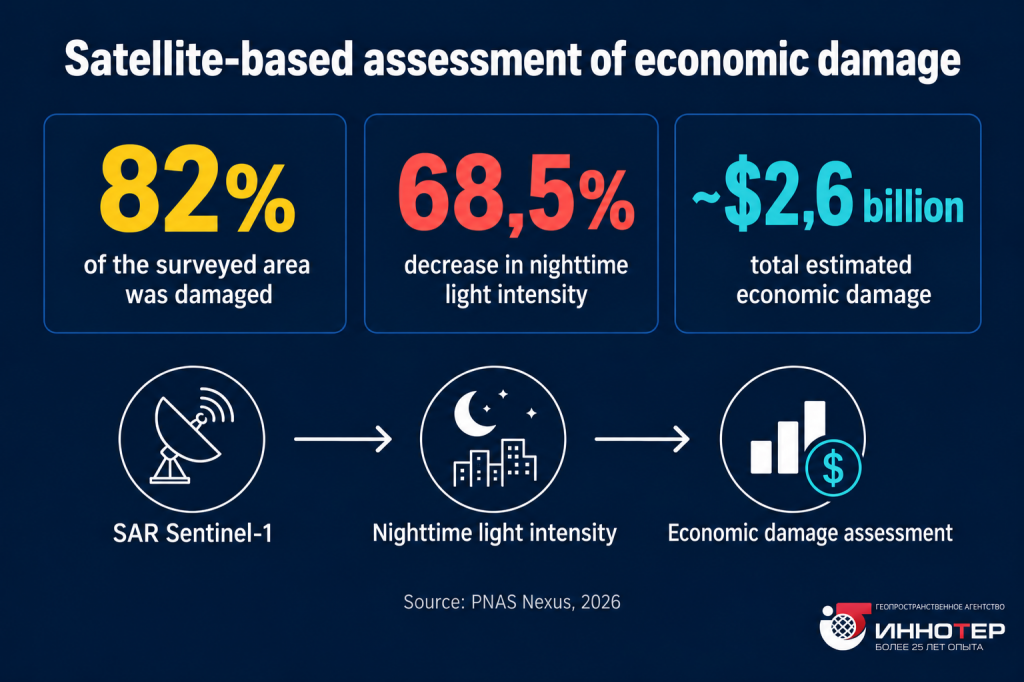
82% of Gaza’s territory was damaged at least once during the observation period
Nighttime luminosity fell by 68.5% — a direct indicator of the collapse of economic activity
Losses in GDP and household welfare averaged around 75% across the territory
In the most severely affected areas, losses reached 97%
Total economic damage is estimated at approximately USD 2.6 billion
One particularly illustrative detail is that during the November 2023 ceasefire, the instruments recorded a temporary increase in nighttime luminosity — which in itself confirmed the sensitivity and reliability of the method.
Infographic: key indicators of satellite-based economic damage assessment
Limitations of Satellite Analysis
Although satellite imagery provides unique and compelling evidence of surface destruction and recovery, analysts caution against using it as the sole basis for comprehensive economic assessment. Its application is significantly constrained by the following factors:
The use of satellite imagery for damage assessment often involves a number of limitations that can be divided into physical, technical, analytical, and economic factors. For an accurate economic assessment of damage, satellite data should be combined with ground-based information.
Physical and Environmental Limitations
Weather conditions: Clouds, fog, smoke, smog, and precipitation may completely obscure a disaster area. Possible solution: the use of alternative types of imagery.
Imaging angle and terrain: Tall buildings, steep slopes, or deep craters may create “blind zones” or shadows that conceal details of the damage. Images acquired at large off-nadir angles may distort the geometric dimensions of objects. Possible solution: the use of imagery acquired from different viewing angles.
Lighting and time of day: Optical satellites cannot collect imagery in darkness. Winter conditions, with shorter daylight hours, and the position of the Sun limit acquisition opportunities and affect shadow quality.
Technical Sensor Limitations
Resolution (level of detail): Not all satellites provide ultra-high-resolution imagery, for example from 0.12 to 0.5 m per pixel. Minor damage such as wall cracks, broken windows, structural deformation, or localized infrastructure damage may remain invisible in satellite imagery.
Spectral limitations: Optical imagery records only external and visible damage, such as collapses and fires, and cannot assess hidden internal damage to buildings.
Analytical and Methodological Challenges
Difficulty in assessing material quality: Satellite imagery cannot determine concrete grade, reinforcement type, or the internal condition of foundations. Detailed field inspections are required to calculate the cost of reconstruction work.
Hidden types of damage: Satellite methods have limited capability and often require time-series monitoring to assess financial losses caused by production shutdowns, loss of intangible assets, theft of equipment, or disruption of logistics chains.
Need for reference data: Automated damage detection using neural networks requires high-quality pre-event imagery of the same area. If such imagery is unavailable, the accuracy of the analysis decreases significantly.
Organizational and Economic Barriers:
Relatively high cost: Ordering up-to-date ultra-high-resolution imagery from commercial operators, such as Maxar or SpaceWill satellite constellations, and purchasing archive data may require significant budgets.
Acquisition speed: Rapid tasking of new imagery may be constrained by bureaucratic procedures.
Need for validation: For satellite imagery to serve as a basis for insurance payments or government compensation, ground verification by professional assessors at reference sites is desirable.
Underground facilities: A significant share of Iran’s critical nuclear and military infrastructure is located deep underground. Surface imagery often cannot determine the extent of internal damage or destruction affecting underground facilities such as centrifuge installations.
Restricted data availability: Commercial providers, such as Planet Labs, have at times delayed or withheld publication of satellite imagery from conflict zones due to U.S. policy restrictions.
04
A methodological approach to assessing economic damage using satellite imagery based on events in Iran
Methodological Approach to Assessing Economic Damage from Satellite Imagery Based on Events in Iran
According to GEO INNOTER’s analysis of the Bloomberg article dated April 22, 2026, the methodology used covers only part of the overall damage assessment and does not incorporate significant data on human casualties, governance, logistics, shutdowns of industrial and extractive production, and other factors.
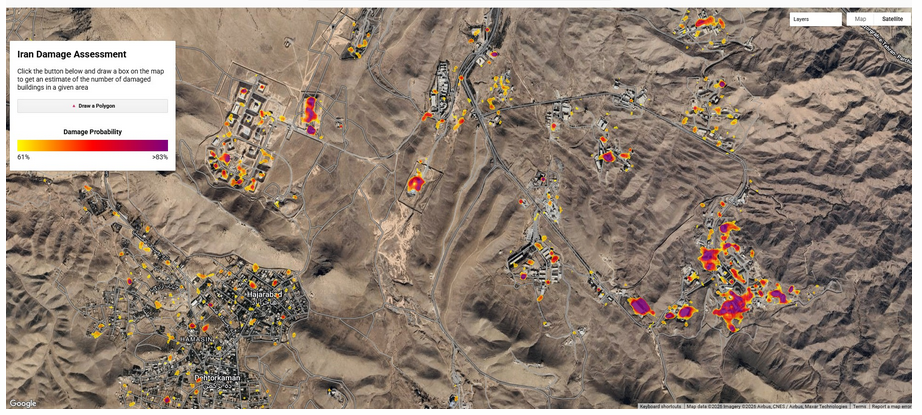
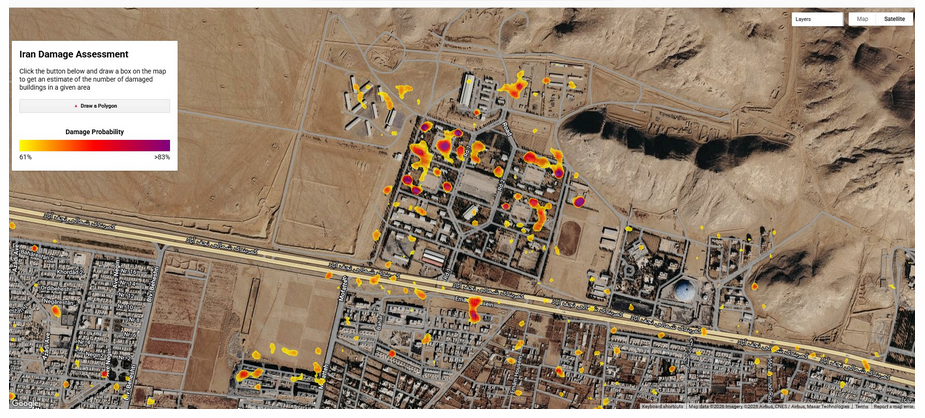
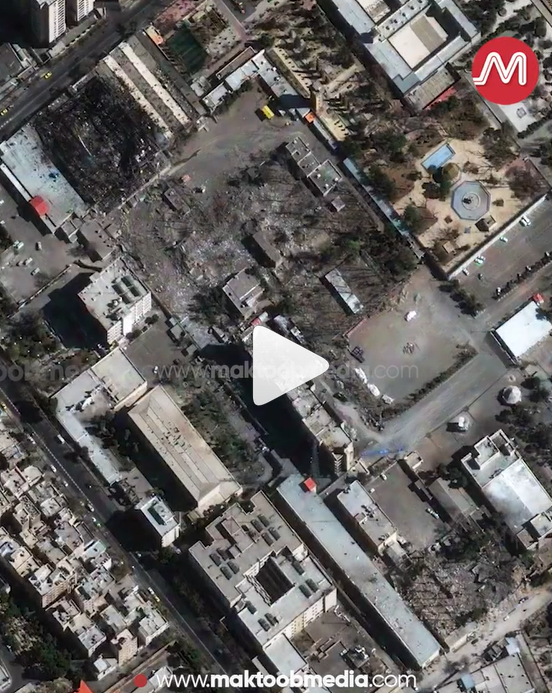
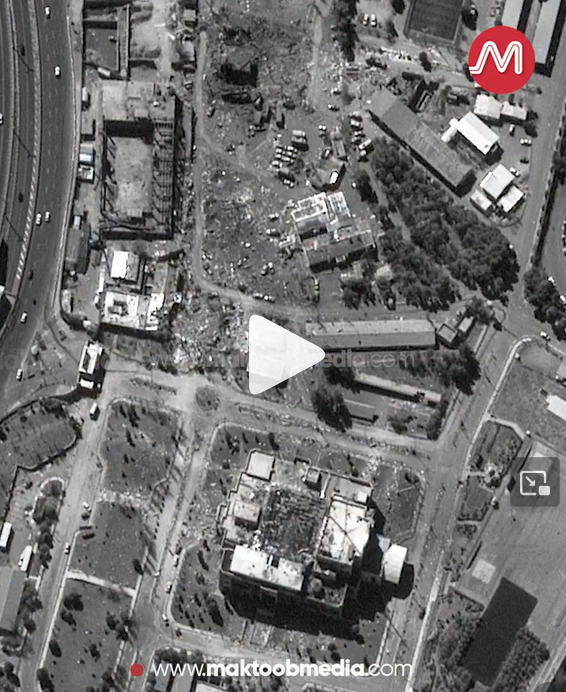
Despite Iran’s restrictions on photography and internet access, as well as U.S. restrictions on the use of very-high-resolution satellite imagery, which complicated visual damage assessment, researchers from the Conflict Ecology Center at Oregon State University used radar imagery to estimate that, on a conservative basis, at least 7,645 buildings across Iran were damaged or destroyed between the start of hostilities on February 28, 2026 and the beginning of the ceasefire on April 8, 2026, including 60 educational and 12 healthcare facilities.
Ruins of buildings in Tehran on March 16. Photographer: Morteza Nikoubazl/NurPhoto/Getty Images
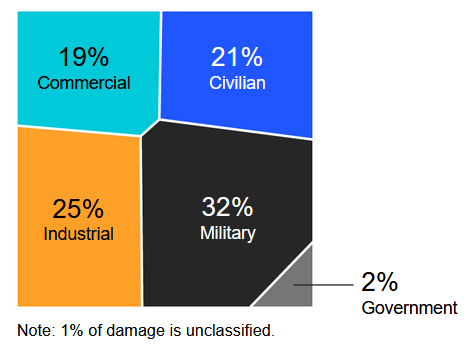
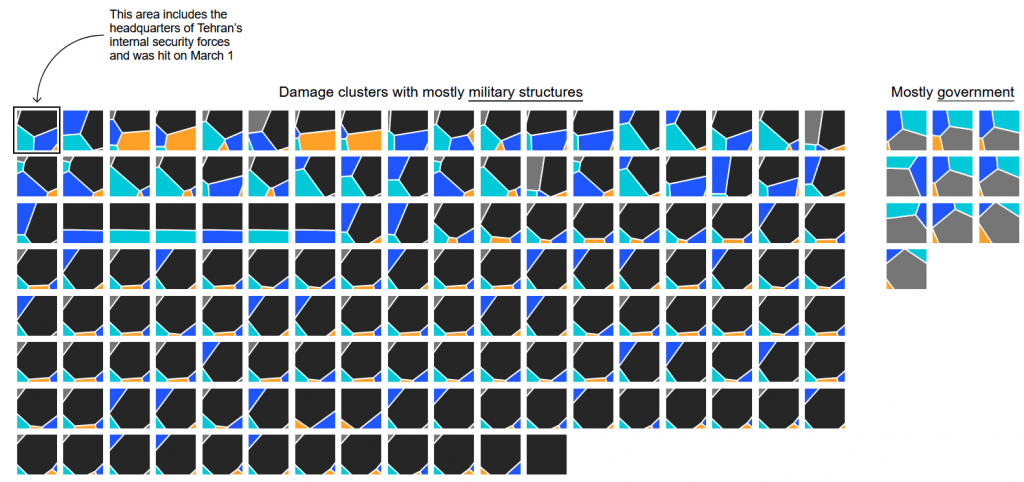
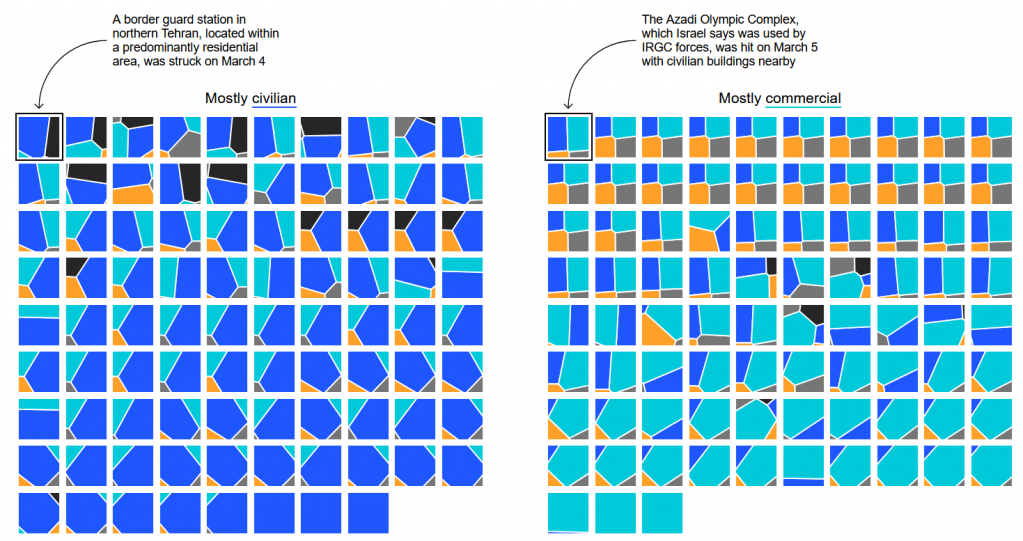
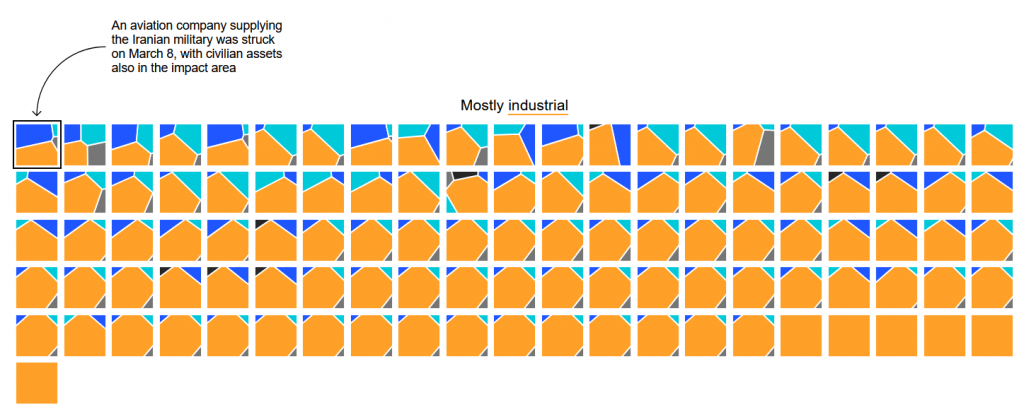
Bloomberg News analyzed land use in areas of Tehran affected by military operations using satellite imagery and found that 2,816 buildings had been affected, approximately 32% of which were associated with military use, 25% with industrial facilities, 21% with civilian use, 19% with commercial buildings, and 2% with government facilities.
This is the baseline information. The methodology can then be broken down step by step.
Source: Google Earth, Sentinel-2 comparison of February 20 and March 17, 2026.Source: Google Earth, Sentinel-2 comparison of February 20 and March 17, 2026.
Classification.
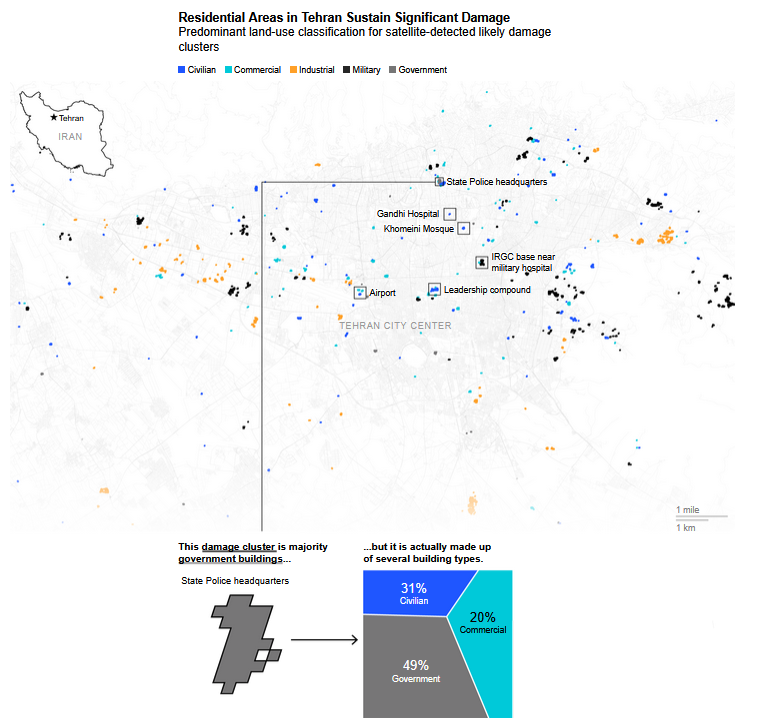
The most heavily affected area was selected for analysis. Residential districts of Tehran sustained significant damage. The following object classes were used to identify probable damage sites from satellite imagery: civilian, commercial, industrial, military, and government.
Sources: damage analysis based on Copernicus Sentinel-1 satellite data conducted by Oregon State University, land-use data from OpenStreetMap and Overture Maps, Bloomberg analysis.
Satellite imagery analysis. Publicly available medium-resolution optical imagery (10 m) from Sentinel-2A using Bands 4, 3, and 2, together with publicly available multi-channel medium-resolution SAR imagery from Sentinel-1 (20 m after processing), was used.
The predominant land-use distribution by classification category was determined for damaged areas of Tehran identified using satellite imagery.
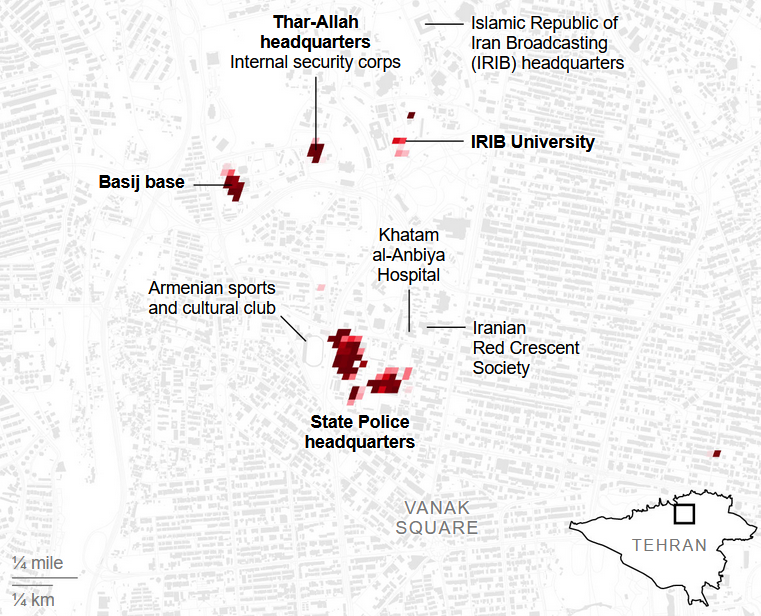
Analysis of destruction sites in Tehran shows that military or government facilities are located close to civilian and commercial buildings.
Military or industrial facilities were also located in areas dominated by civilian or commercial development.
Civilian vehicles were also detected and classified in affected areas, predominantly within industrial zones.
Sources: analysis of damage based on Copernicus Sentinel-1 satellite data, land-use data from OpenStreetMap and Overture Maps, Bloomberg analysis.
Damage was also detected in affluent northern districts of Tehran.
Probability of building damage or destruction based on satellite data as of April 8, 2026.
Aggregated Mapping.
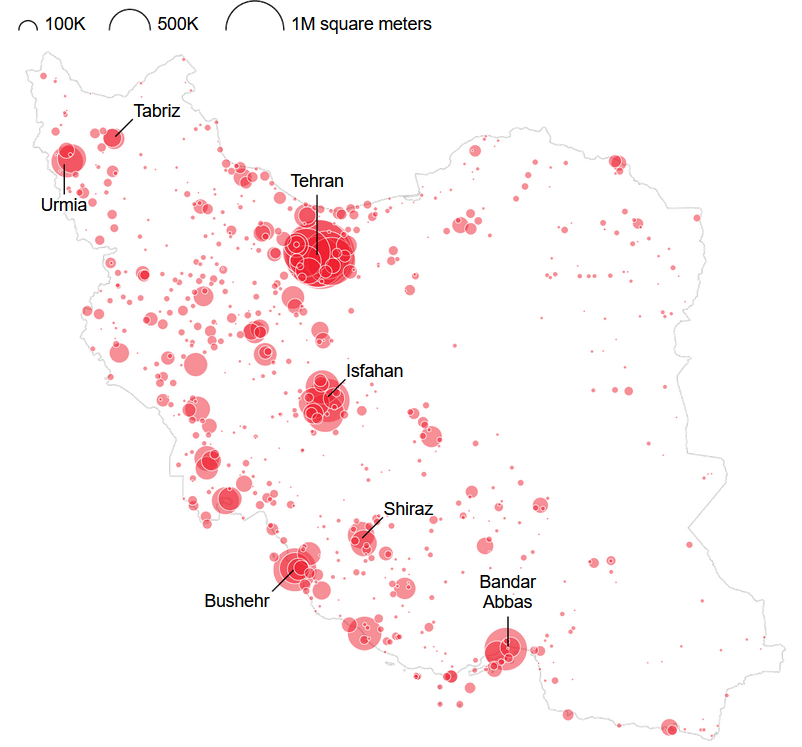
Destruction across Iran was aggregated onto a five-kilometer grid and mapped.
To understand which areas were affected during the conflict, Bloomberg combined satellite-derived damage data with open-source land-use data. Damage locations were identified through radar analysis of Sentinel-1 imagery with a spatial resolution of 20 meters, resulting in 4,262 individual zones of probable structural damage across Iran, including 430 detections within the administrative boundaries of Tehran and 104 detections in Isfahan.
To determine whether each detected damage site was located within a military area, residential district, industrial zone, or another land-use category, Bloomberg specialists combined the following independent data sources:
land-use zone maps from OpenStreetMap,
classified building footprints and points of interest from the Overture Maps database, as well as the physical dimensions and building density within each area.
No individual source is comprehensive — for example, building labels in OpenStreetMap cover only about 4% of structures in Tehran — so each source was assessed according to its reliability and combined into a composite indicator. Where sources provided conflicting information, greater weight was given to the more authoritative data layers.
Each object was assigned to one of six categories:
military,
industrial,
civilian,
commercial,
government,
unclassified.
Government facilities were separated from the broader civilian category because such buildings may perform dual military and civilian functions. Rather than imposing a single label, the analysis retains the full spectrum of land-use types surrounding each object — for example, a site classified as “military” may also consist of 20% residential and 10% commercial land use, reflecting the mixed-use nature of urban areas.
Several limitations should be noted. Military classification is based almost entirely on OpenStreetMap mapping of military areas; if a military zone is not mapped, the classification may fail to identify it. The distinction between residential and commercial development is often blurred because different data sources provide conflicting signals for the same location. In Isfahan, 26% of detections could not be classified at all due to insufficient mapping coverage. In addition, this analysis classifies the type of area in which damage was detected rather than identifying the specific target of a strike. A detection classified as “civilian” means that damage occurred within or near a civilian area; it does not necessarily mean that a civilian building was the intended target.
Bloomberg then proceeded to calculations based on ultra-high-resolution satellite imagery of the destruction.
After extrapolating the data to the whole of Iran, Bloomberg obtained a result broadly comparable with estimates from the Iranian government and the International Monetary Fund. The Iranian government estimated total direct and indirect damage from the airstrikes at approximately USD 270 billion — not far from the International Monetary Fund’s estimate of Iran’s total gross domestic product for 2026 at around USD 300 billion, as well as Bloomberg’s satellite-based assessment.
Clearly, increasing the spatial resolution of the imagery and combining optical, radar, and thermal data can bring the results closer to those of a field survey, which would otherwise take at least a year to complete.
Other assessment methods also exist. For example, the United Nations has recognized the applicability of the PWTT (Pixelwise T-Test) satellite algorithm in its work. Its accuracy was evaluated using an original dataset containing more than two million building images labeled by the UN. Despite its simplicity and small model size, the algorithm achieved building-level accuracy (AUC = 0.87 on the full dataset), comparable to other modern approaches based on deep learning and high-resolution satellite imagery.
05
Why is this important for the geospatial data market?
Why This Matters for the Geospatial Data Market
The study describes more than just an academic case — it effectively establishes a replicable methodological framework:
This framework can be applied far beyond military conflicts:
Humanitarian Organizations and International Financial Institutions
The UN, World Bank, and IMF require rapid damage assessments to justify reconstruction funding, especially in areas where specialists cannot be deployed. Satellite-based assessment is becoming a basis for decisions on allocating multi-billion-dollar funding packages.
Insurance and Reinsurance
For insurers, objective mapping of insured losses in crisis-affected regions without deploying adjusters (professional experts who assess insurance risks and determine the extent of insured losses) directly reduces operating costs and accelerates claims settlement.
Sanctions Compliance and Due Diligence
Monitoring economic activity in restricted or sanctioned territories is a service with real demand from the financial sector, law firms, and government regulators.
Post-War Planning and Reconstruction
Prioritizing areas by the level of damage in order to allocate reconstruction funds efficiently is a task that simply cannot be solved without spatial data.
06
A paradigm shift: from ‘maps of destruction’ to ‘economic damage in monetary terms’
Paradigm Shift: From a “Damage Map” to “Economic Losses in Monetary Terms”
The key shift demonstrated by this approach is the transition from visualization (“this is where the damage occurred”) to monetization (“this is how much it costs”). It is this transition that transforms geospatial data from a technical product into a tool for management and financial decision-making.
For Earth observation market participants, this means an expansion of the target audience: in addition to traditional customers such as mapping, defense, and agriculture, the market is increasingly extending into economic and humanitarian analytics.
For more than 10 years, GEO INNOTER has been preparing analytical materials and expert assessments for insurance and lending institutions, including but not limited to:
verification of damage to residential property in Russia’s Kursk Region from 2023 onward for the calculation and payment of insurance compensation to affected parties;
verification of damage to commercial and residential property in areas where access by adjusters (professional experts who assess insurance risks and determine the extent of insured losses) is restricted or involves significant physical risk;
assessment of agricultural activities and crop yield forecasting in areas located near zones of military activity;
monitoring the condition and preservation of property and pledged assets;
Need satellite imagery or help choosing the right data?
Describe your task, area of interest, and desired outcome. We will check data
availability, assess new acquisition options, and propose the optimal solution in terms of timelines, cost,
and quality.
Fast feedback during business hours
We will select the best data for your task
Confidentiality guaranteed
Discuss the project
clients who trust us
25+ years in the geodata market
Need satellite imagery or help choosing the right data?
Describe your task, area of interest, and desired outcome. We will check data
availability, assess new acquisition options, and propose the optimal solution in terms of timelines, cost,
and quality.
Fast feedback during business hours
We will select the best data for your task
Confidentiality guaranteed
Discuss the project
clients who trust us
25+ years in the geodata market
Мы используем Яндекс.Метрика и собственные Сookies для обеспечения наилучшего
опыта работы на нашем сайте, персонализации сайта для наших пользователей и аналитики.
Продолжая использовать сайт вы соглашаетесь с условиями
Пользовательского соглашения.
Request a call
Leave your contact details — we will get back to you during business hours, clarify the task and suggest suitable data or services.
Write to e-mail
Send a message, technical specification or task description. We will review your request and reply to the specified e-mail.
Fill in the order form
Describe the area, object and imagery requirements. We will check archive availability, the possibility of a new acquisition and offer a suitable option.
Order software
Order TK
Your application is accepted
We will contact you during working hours.
Выбрать город
Россия
Другие страны
Белоруссия
Contact via WeChat
Feliks Fokin
Open WeChat and scan the QR code to add the contact. On a phone, save the code and select it in the WeChat scanner.



 Infographic: key indicators of satellite-based economic damage assessment