Sat-Sun: Non-working days
Abstract
This article reviews key methods for assessing desertification. Desertification forecasting plays a key role in combating the global environmental crisis, helping to identify vulnerable regions, solve problems quickly, and take measures to preserve fertile land and biodiversity.Introduction
In the modern world, desertification is becoming an increasingly pressing issue. Climate change, inconsistent use of land resources, and other factors lead to soil degradation and loss of fertility. However, thanks to advancements in Earth Remote Sensing (ERS) technology, new methods for assessing and monitoring desertification are emerging.
ERS is a method of studying the Earth using special sensors on satellites, aircraft, and unmanned aerial vehicles (UAVs). By employing remote sensing, scientists have developed tools and algorithms to assess the level of desertification and make predictions. This enables effective measures to be taken for the conservation and restoration of soil resources.
This article is dedicated to exploring various methods for assessing land desertification using ERS. We will delve into the principles of remote sensing and its role in the analysis and monitoring of desertification.
Understanding the scale of desertification and the effectiveness of ERS methods are crucial steps in preserving nature and sustainable development. Thanks to remote sensing and the application of advanced technologies, we can effectively combat the threat of desertification and develop measures for the restoration and sustainable use of land resources.
< 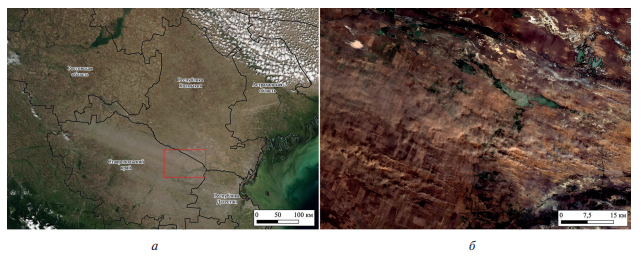
Figure 1. Satellite images of a dust storm in southern European Russia on August 22, 2022: a — MODIS Aqua, b — Sentinel-2B; red outline — location of the Sentinel-2 satellite image fragment
Remote sensing of specific climatic and biogeographic parameters is an effective means of assessing the state of extensive desertification of arid lands that have been negatively impacted by human activities.
Monitoring Desertification Using Remote Sensing
Land degradation has become one of the most globally catastrophic issues in the context of modern climate change and uncontrolled anthropogenic activities. However, among scientists, there is no clear consensus on how to combat desertification and land degradation, and the main factors causing these phenomena continue to be debated. In this article, we consider desertification as the reduction or complete loss of land productivity caused by a combination of soil erosion, soil property degradation, and long-term loss of natural vegetation. In the last century, approximately 70% of arid lands (i.e., semi-arid, arid, and hyper-arid lands) have shown signs of desertification, with cultivated lands being at the greatest risk, with about 70% of the area experiencing degradation.
The extremely extensive nature of land degradation and desertification means that in recent decades, remote sensing methods have been widely applied as tools for assessing spatial and temporal trends. A diverse range of variables and indices extracted from various sensors, such as AVHRR (Advanced Very High-Resolution Radiometer), AVHRR-GIMMS (Global Inventory Monitoring and Modeling System), MODIS (Moderate Resolution Imaging Spectroradiometer), including ASTER, MISR, CERES, MOPITT, NOAA (National Oceanic and Atmospheric Administration) AVHRR, or LANDSAT, among others, have been used to assess land degradation and desertification. Based on these sources, large databases related to various vegetation and climate properties, including the Normalized Difference Vegetation Index (NDVI), land cover changes, Leaf Area Index (LAI), Land Surface Temperature (LST), interdisciplinary indices including albedo and evapotranspiration (ET), Water Use Efficiency (WUE), Net Primary Production (NPP), Enhanced Vegetation Index (EVI), as well as precipitation and vegetation datasets, have been created.

Figure 2. Maps of Iran showing average spatial variations (a) NDVI, Normalized Difference Vegetation Index; (b) NPP, Net Primary Production; (c) LAI, Leaf Area Index; (d) LST, Land Surface Temperature; (e) P – precipitation for the period 2001–2015. Areas devoid of vegetation due to excessive aridity are excluded from the analysis and shown as empty (e.g., Lut Desert, Dasht-e-Kavir, some dunes, and other desert surfaces).
Multispectral Imaging and Its Role in Desertification Studies
Multispectral imaging is a crucial tool for studying desertification and changes in land use. It is based on the use of data obtained from satellites that observe the Earth in various spectral bands, such as visible light, infrared radiation, and radio frequencies. Each spectral band provides information about different aspects of the environment, such as chlorophyll content, soil moisture, and vegetation health.The analysis of multispectral images allows researchers to identify areas with insufficient or absent vegetation and detect signs of desertification. This aids in monitoring changes in green cover and assessing the state of ecosystems.
Multispectral Imaging and Its Role in Desertification Studies
Multispectral imaging is a crucial tool for studying desertification and changes in land use. It is based on the use of data obtained from satellites that observe the Earth in various spectral bands, such as visible light, infrared radiation, and radio frequencies. Each spectral band provides information about different aspects of the environment, such as chlorophyll content, soil moisture, and vegetation health.
The analysis of multispectral images allows researchers to identify areas with insufficient or absent vegetation and detect signs of desertification. This aids in monitoring changes in green cover and assessing the state of ecosystems.
Detection and Analysis of Changes and Its Role in Desertification Detection
Detecting changes in land use is a crucial aspect of studying desertification. This method is based on comparing satellite images acquired at different time periods. Analysts compare various land characteristics, such as texture, color, shape, and other parameters.
Analyzing changes in vegetation, soil cover, and water resource distribution allows the identification of areas with insufficient or deteriorating vegetation. The expansion of bare soil and reduction in green cover may indicate the process of desertification. Such an approach helps researchers and policymakers make informed decisions regarding land management and combating desertification.
Lidar (Light Detection and Ranging) and Its Application in Desertification Studies
Lidar is an active remote sensing method that uses laser emission to measure the distance between objects and a laser-scanning device. In the context of desertification, Lidar provides information about the three-dimensional structure of the Earth's surface, vegetation density, and the vertical profile of objects.
Lidar data enables the creation of accurate digital elevation models, identification of changes in surface height, recognition of vegetation of different heights, and detection of areas with insufficient or challenging vegetation. This additional information about the structure and density of vegetation helps more precisely identify areas prone to desertification and develop corresponding measures for the conservation and restoration of ecosystems.
For example, a study conducted in Morocco utilized Lidar technology. This country is known for its desert regions, particularly the Sahara. Researchers employed laser rangefinders to scan the Earth's surface. Lidar scans were conducted in various desert regions of Morocco, and the obtained data were analyzed to study the spread of desertification.
Analysis of Lidar data provided high-precision information on the height and structure of vegetation, vegetation cover density, and landscape changes due to desertification. Key indicators such as desert cover areas, degradation levels, and changes in vegetation structure were also computed.
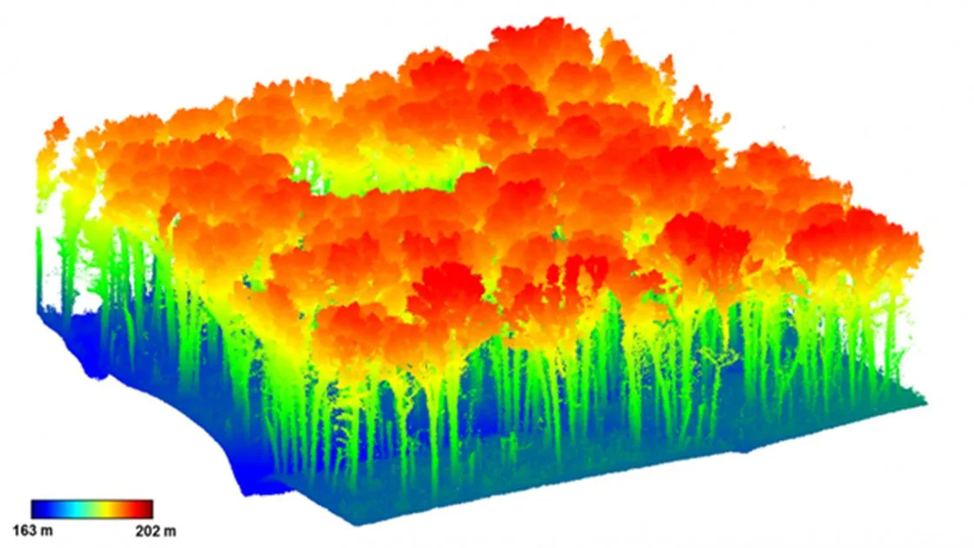
Figure 3. Data obtained with LIDAR
The research results indicated an intensification of desertification processes in several regions of Morocco. By utilizing Lidar data, researchers could pinpoint the exact boundaries of desert zones and track changes in their area over time. This helped gain a better understanding of the scale of the desertification problem and identify priority measures to combat it.
These findings have significant practical implications for developing strategies for the sustainable use of land and resources in the desert regions of Morocco. They can be utilized in tree and plant planting plans, implementing moisture conservation techniques, creating anti-erosion measures, and other actions aimed at preventing desertification and restoring desert ecosystems.
Geographic Information Systems (GIS) and Their Role in Desertification Studies
Geographic Information Systems (GIS) play a crucial role in the study of desertification as they enable the storage, analysis, and visualization of spatial data. In the context of desertification studies, GIS allows the integration of data obtained through Earth Remote Sensing (ERS) and other sources, such as land cover data, climate information, and hydrological data.
Data analysis using GIS involves creating vegetation maps, determining the dynamics of land use changes, calculating desertification indicators, and modeling future development scenarios. This enables researchers and managers to make informed decisions and develop strategies to prevent desertification and improve land use.
Assessment of Desertification Using Vegetation Indices
Vegetation indices extracted from remote sensing data have proven particularly useful for monitoring changes in vegetation cover over time. Recent research has shown the high effectiveness of vegetation indices such as NDVI, NPP, LAI, and EVI in assessing spatial and temporal changes at various scales. These variables typically correlate with other climate parameters, such as precipitation, temperature, or evaporation, which are useful for evaluating and predicting potential land degradation in the future. Temporal trends in climate and vegetation index time series and the relationships between them have been studied by many authors. For instance, images from the Tropical Rainfall Measuring Mission (TRMM) sensor were used to investigate the correspondence of vegetation trends to rainfall, while others explored the correlation between land use changes and land surface temperature (LST). Assessing the interrelationships between vegetation dynamics and climate parameters is a proven powerful and effective means of determining whether inevitable climate changes and unrestricted human activities pose a threat to food security and sustainable societies in rapidly developing regions of the world.
Normalized Difference Vegetation Index (NDVI)
For a quantitative assessment of changes in vegetation cover on the Earth's surface, NDVI data, such as MODIS-TERRA, are commonly used; these data are typically employed for large spatial scales. Average NDVI values were calculated for each season: spring, summer, winter, and autumn; pixels with NDVI> 0 denote areas with vegetation, while pixels with NDVI <0 indicate areas without vegetation. Such pixels are usually excluded from further analysis to reduce the impact of bare soil, snow cover, and water.
Net Primary Productivity (NPP)
The total amount of carbon dioxide produced by plants is commonly referred to as Net Primary Productivity (NPP) and is determined as the difference between the amount of oxygen produced and respiration, also known as the net production of the ecosystem. NPP has been previously employed in the study of desertification associated with climate change.
Leaf Area Index (LAI)
LAI indicates the level of vegetation activity in terms of vegetation cover (%) and the number of leaf layers per unit area. Monthly LAI data obtained from satellites are used to derive these parameters. LAI has significant potential for modeling global ecosystems.
Land Surface Temperature Index (LST)
LST is an index suitable for studying energy exchange related to surface processes at various scales. An algorithm for window separation was applied to optimize the column water vapor and lower atmospheric temperature on these images for assessing land surface temperature. Additionally, pixels contaminated by clouds are excluded to ensure that only clear sky conditions are evaluated, as our focus is on radiative frost.
Precipitation (Index P)
Index P provides monthly precipitation data.
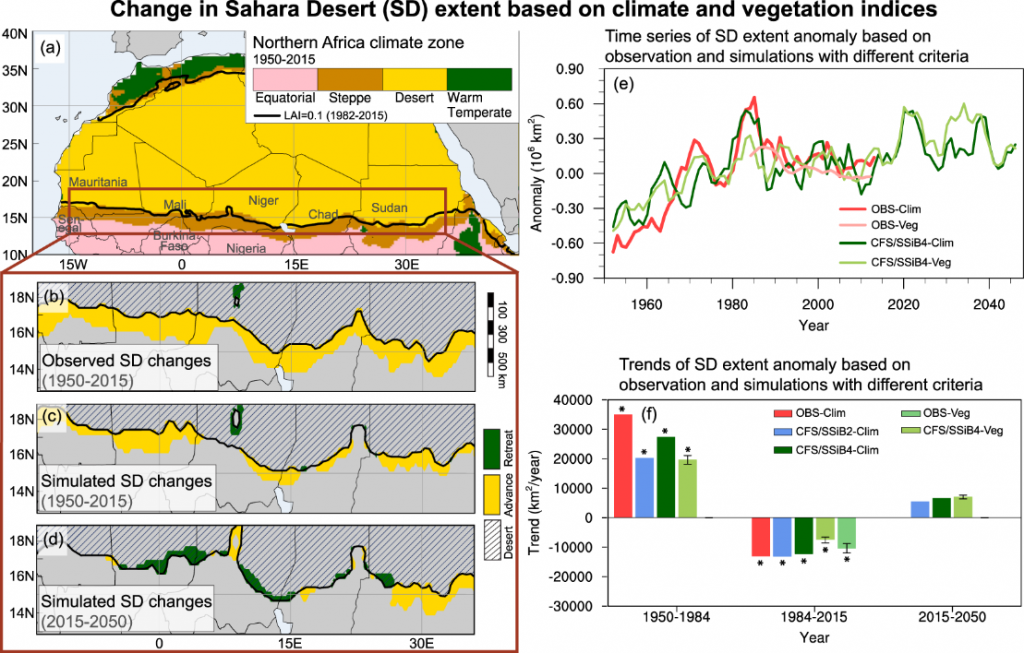
Fig. 4. Changes in the size and boundaries of the Sahara Desert depending on climate and vegetation indices (NDVI). (a) Climatic zones of North Africa on average for 1950–2015. Changes in the southern boundary of the Sahara Desert based on the Land Surface Temperature (LST) climate index (b) observations and (c) modeling over 1950–2015, and (d) modeling over 2015–2050. Observed and modeled (e) time series and (f) desert expansion trend determined by climate and vegetation indices. Error bars in (f) indicate one standard deviation due to the LAI-based vegetation absence criterion in the range of 0.08–0.12 m2/m2.
The optimal approach to using remote sensing data for desertification monitoring involves combining various types of space information.
Digital thematic maps obtained from the classification of multi-zone satellite images contain information about landscape units characterizing the desertification process.
Comparison of high and medium spatial resolution information has shown that medium-resolution data can highlight the main types of natural formations in the study area and can be used to monitor desertification processes at the regional level.
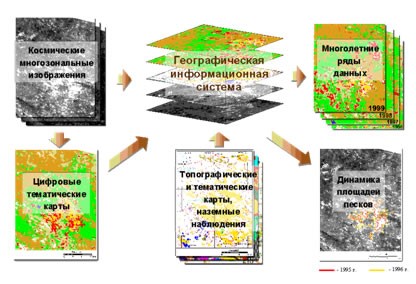
Fig. 5 Combined monitoring method
Spatial Patterns of Land Desertification
To determine the spatial patterns of desertification potential, five indices described earlier are used. Although each index can describe an aspect of desertification, it is more useful to integrate several indices at once. Using logical classification and reclassification methods, each of the five indices is divided into five classes indicating very low, low, moderate, high, and very high desertification potential. For example, if the logical approach combines the lowest 20% of pixels among NDVI, NPP, LAI, and P with the highest 20% of LST values, the area can be classified as having very high (maximum) desertification potential (Table 1).
|
Class № |
NDVI (%) |
AEС (%) |
LAI (%) |
LST (%) |
P (%) |
Desertification Class |
|
1 |
80–100 |
80–100 |
80–100 |
0–20 |
80–100 |
Very Low |
|
2 |
60–80 |
60–80 |
60–80 |
20–40 |
60–80 |
Low |
|
3 |
40–60 |
40–60 |
40–60 |
40–60 |
40–60 |
Moderate |
|
4 |
20–40 |
20–40 |
20–40 |
60–80 |
20–40 |
High |
|
5 |
0–20 |
0–20 |
0–20 |
80–100 |
0–20 |
Very High |
Thanks to satellite observations, which currently provide data in the form of long time series of relevant parameters with relatively high spatial resolution (thus eliminating the risk of misinterpreting natural interannual variations), a new opportunity arises to study data on a multi-decadal regional scale, as well as to study data with increased detail to examine temporal and spatial patterns in the data.
Application
In 2020, in the southern part of the European Russia, due to drought and uncontrolled growth of sheep and goats, desertification processes began in pastures, leading to the expansion of mobile sands and other lands devoid of vegetation.
Therefore, there was a need to monitor vegetation cover to identify patterns in desertification processes. Satellite monitoring methods practically have no real alternative in assessing its dynamics over large areas.
Satellite images from Landsat-8, -9, and Sentinel-2 spacecraft for the period 2019–2022 were chosen as the data source (Fig. 4), when the desertification area sharply increased compared to the period before 2019. Landsat data have a spatial resolution of 15 to 30 meters, Sentinel data have a spatial resolution of 10 meters for blue, green, red, and near-infrared channels, and up to 60 meters for coastal and shortwave infrared channels (SWIR), allowing more accurate determination of the boundaries of mobile sand areas compared to using images obtained by MODIS (Moderate Resolution Imaging Spectroradiometer) and VIIRS (Visible Infrared Imaging Radiometer Suite) satellite systems. Level 2 processed Landsat satellite images, which underwent radiometric calibration and correction of atmospheric distortions, were used to calculate the Normalized Difference Vegetation Index (NDVI). Subsequent joint classification of images, including NDVI values and the spectral brightness coefficient in the red wavelength range, was performed. A similar approach has previously shown sufficient accuracy in delineating open sands.
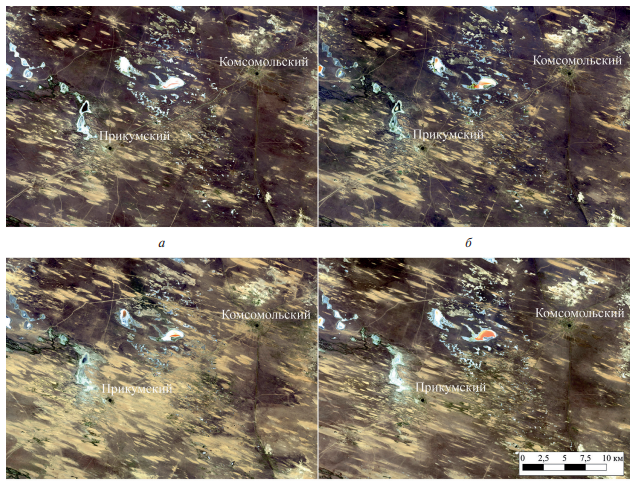
Fig. 6. Satellite images of mobile sand arrays in the pastures of Kalmykia: a — June 23, 2019; b — June 9, 2020; c — July 30, 2021; d — May 31, 2022
Preliminary mapping of salt depressions and solonchaks devoid of vegetation due to natural reasons was carried out using Sentinel-2 satellite images and Google Earth data, with the aim of excluding them from the category of desertified lands. The territory along the Caspian Sea coast was also not evaluated, as vegetation is absent here due to the drop in water levels in the last decade and the corresponding exposure of the sea floor. Arable land was also excluded. Five satellite images were used for each year (tiles 169028, 169029, 170027, 170028, 170029). Image acquisition dates were chosen close to the vegetation maximum in May and the first half of June. Since the dates of satellite shooting within a year could differ, classification was first performed for each image separately, and then a resulting raster was compiled for the entire study area. Field verification during expeditions in May 2021 and June 2022 showed sufficient accuracy of the results of Earth remote sensing data processing. The desertification area in 2022 is shown in Fig. 6.
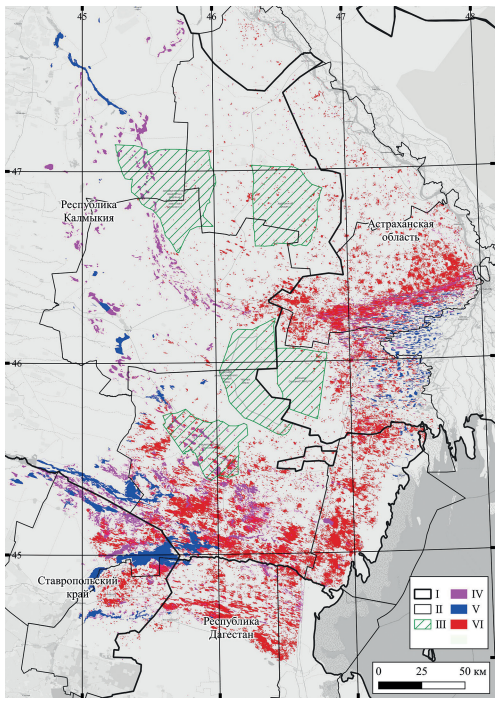
Fig. 7. Areas of open sands and deflated lands in 2022: I — region boundaries; II — district boundaries; III — specially protected natural areas; IV — solonchaks; V — water bodies; VI — areas devoid of vegetation cover
In June 2019, 232.6 thousand hectares of desertified pasture lands were noted in the research region.
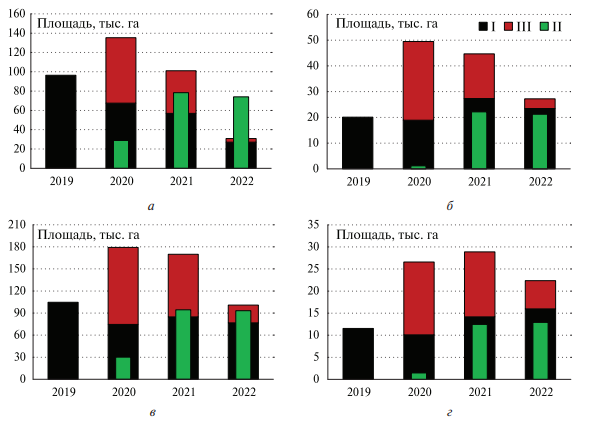
Fig. 8. Changes in desertification areas (compared to the previous year): I — transitioning desertification area, II — reduction, III — increase; a — Astrakhan Region, b — Republic of Dagestan, c — Republic of Kalmykia, d — Stavropol Krai
Comparisons of data obtained from space with annual precipitation and livestock numbers allow the identification of areas where phytomelioration measures are needed primarily. Carrying out phytomelioration works to stabilize mobile sands can significantly reduce the areas of open sands.
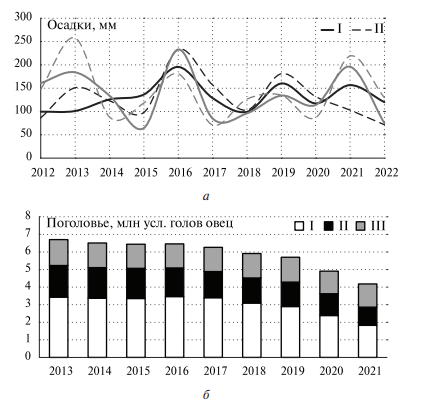
Fig. 9. Dynamics of precipitation sums (a) for November — May (black) and May — September (gray) according to the meteorological stations "Yashkul" (I) and "Yuzhno-Sukhokumsk" (II). Dynamics of livestock, converted to conditional heads of sheep (b), in the studied areas of Kalmykia (I), Stavropol Krai (II), and Astrakhan Region (III)
The conducted research showed the stabilization of desertification processes in the Northwestern Caspian region in 2022 compared to 2020–2021. However, the situation remains dangerous in the south of Kalmykia, north of Dagestan, and northeast of Stavropol Krai, as evidenced by dust storms in August 2022. Continuation of pasture monitoring in the region and timely response to the growing threat of irreversible desertification through regulation of grazing loads and phytomelioration are necessary.
This study emphasizes the importance of scale in desertification assessments and, in particular, the value of high-resolution data. There are no significant changes in any of the five indices annually, but significant changes (some positive, some negative) become apparent on a seasonal basis. In spatial terms, there are also many local and regional differences that are lost when data are considered only on the largest national scale.
Spatial and temporal trends determined using three vegetation indices and two climatic indices provide an economically efficient basis for forecasting and managing future environmental trends in developing regions at risk of desertification.
Project Medalus
The MEDALUS program (Mediterranean Desertification And Land Use) is a methodological approach for assessing land desertification, developed by the United Nations Environment Programme (UNEP) and UNESCO. The program aims to study soil fragmentation and degradation processes, as well as to develop strategies and methods for preventing and controlling such processes, ensuring sustainable land use.
The MEDALUS program offers a comprehensive approach that combines various types of data and analysis methods to obtain a thorough assessment of land desertification. It utilizes data on soil properties, climate information, geological-geomorphological characteristics, vegetation, and land use. Collection of these data is carried out through field measurements, research, and the use of available data sources.
The collected data is then integrated using Geographic Information Systems (GIS), allowing them to be combined in spatial form and analyzed based on spatial relationships. GIS tools and spatial modeling enable data analysis and identification of vulnerable areas, the degree of soil degradation risk, and predictions of changes in land use.
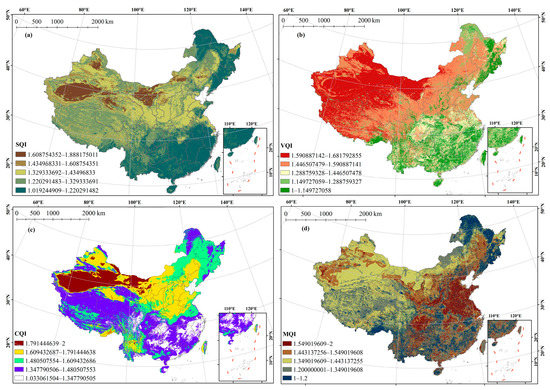
Fig. 10. Spatial distribution of soil quality, vegetation, climate, and management indicators obtained in the study of land desertification in China using Medalus. (a) Soil Quality Index map; (b) Vegetation Quality Index map; (c) Climate Quality Index map; (d) Management Quality Index map.
The analysis results are presented in the form of cartographic products that display the level of land desertification and degradation in the studied area. Maps help identify areas with increased vulnerability, aiding in the development of effective strategies and measures to improve land use sustainability and prevent further desertification expansion. These strategies may include soil conservation measures, water resource management, land use zoning, and other approaches that contribute to sustainable development.
Overall, the MEDALUS program provides a systematic and scientifically justified assessment of land desertification, serving as an important tool for planning and decision-making in the field of sustainable land use. The results of the MEDALUS program can be used not only by researchers and academic communities but also by government bodies and international organizations to develop policies, strategies, and actions to combat desertification and promote sustainable development in arid regions.
Conclusion
Assessing desertification using Earth remote sensing methods is a powerful tool for studying and monitoring changes in desert cover. In this article, we have discussed some of the main methods and requirements for capturing imagery to conduct desertification analysis.
Satellite and aerospace imagery provide information on the state of vegetation and land degradation in desert regions. Calibration and preprocessing of images ensure the accuracy and consistency of data, enabling reliable comparative analyses.
The use of vegetation indices, including indicators such as NDVI, allows the identification of changes in vegetation cover and the determination of the level of desertification. Vegetation classification provides detailed information on coverage types and changes in their distribution.
It is important to note that desertification analysis using Earth remote sensing methods should consider not only changes in vegetation cover but also climatic, geographic, and anthropogenic factors that may affect desert land degradation processes. Therefore, analysis results should be confirmed by additional on-site research.
Thanks to its ability to cover large territories and provide multi-year time series observations, Earth remote sensing provides valuable information for planning and implementing measures to prevent and control desertification. This allows the development of sustainable land and resource use strategies in desert regions and mitigates the impact of global climate change on these ecosystems.
Overall, the use of Earth remote sensing methods for desertification assessment is an important tool for preserving and restoring desert ecosystems and strategically planning sustainable land use. It provides continuous, objective, and accessible data that help make informed decisions in the fight against desertification and contribute to achieving long-term ecological sustainability on our planet.
