Sat-Sun: Non-working days
Abstract
The elevation matrix is nowadays used in remote sensing (RS) to create a three-dimensional model
of the Earth's surface and analyze its characteristics, such as relief, elevation contours, slope, etc. This
allows improving the quality of cartographic products, ensuring more accurate object recognition on the Earth,
and utilizing the results for various applications, such as urban planning, assessment of navigational capabilities,
and disaster forecasting.
History of Elevation Matrix Development
The use of digital elevation models (DEM) in geographic and cartographic research has a long and rich history. Over time, scientists' understanding of what DEMs are and the methods to create them has evolved, developed, and complemented one another.
It is generally believed that the first data for creating DEMs were obtained when humans learned to measure the elevations of specific points in a terrain and plot them on a map.
According to some domestic scholars, DEMs are a special type of three-dimensional mathematical models — sets with specific predicates, representing the depiction of relief as both real and abstract surfaces. The latter may include various physical indicators: temperature, pressure, precipitation, geophysical fields, and other characteristics.
One of the early researchers who made a significant contribution to the development of methods for creating elevation matrices was Albert Taranto, an American engineer and scientist. In the 1960s, he developed algorithms and software for generating elevation matrices from aerial photographs.
In addition to Taranto, researchers in photogrammetry, cartography, and computer vision, such as Richard Hartley, David Lowe, Ronald Maizels, and many others, contributed to the development of methods and algorithms for creating elevation matrices.
However, it should be noted that the first elevation matrices were created with rather limited resolution and using simple image processing methods.
Since then, photogrammetric methods have significantly improved and found wide applications in various
fields, including geodesy, cartography, geology, architecture, and many others.
What is an Elevation Matrix?
An elevation matrix has several definitions, each of which is correct:
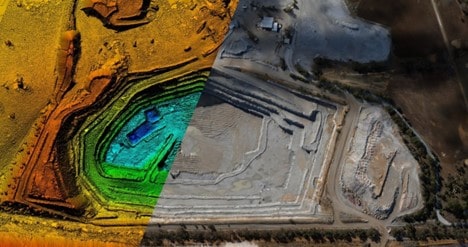
- An elevation matrix (DEM — Digital Elevation Model) is a digital cartographic representation of the Earth's surface in the form of a regular grid of elevation values.
- An elevation matrix is a three-dimensional raster model of terrain obtained by transforming initial vector data of an area into raster format and further enhancing the raster model through interpolation methods.
- An elevation matrix is a mathematical object represented as a table of numbers, where each number corresponds to the elevation of a point on the surface in multidimensional space.
Each matrix element corresponds to a square area of terrain, the side length of which is called the matrix resolution. An elevation matrix can contain either the absolute terrain relief or a combined relief — the sum of absolute relief and the relative elevations of objects.
The main parameters of an elevation matrix are:
- Matrix scale (used for consistent joint representation of the matrix and vector map);
- Matrix size (width and height of the matrix in meters);
- Spatial referencing of the matrix (coordinates of the bottom-left (southwest) corner of the matrix in meters in a rectangular coordinate system);
- Matrix resolution (size in meters of the side of a square terrain area corresponding to a matrix element);
- Minimum and maximum elevation values;
- Resulting relief type (indicating whether the matrix contains the absolute terrain relief or the sum of absolute relief and relative elevations of objects).
Types of Elevation Matrices
Elevation matrices can be regular or irregular:
- Regular elevation matrices have cells (pixels) of equal size and are evenly distributed across the surface. This typically occurs when images are captured at the same camera height and with consistent shooting parameters. Thus, each pixel represents an identical area of the surface.
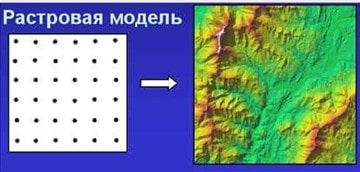
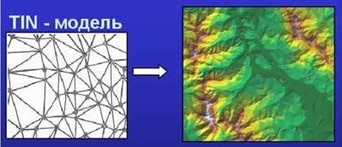
- Irregular elevation matrices have variable cell (pixel) sizes and are unevenly distributed across the surface. This occurs when images are captured with differing shooting parameters. Consequently, each pixel represents a different surface area, complicating data analysis and making conclusions less precise. An example of an irregular terrain model is Delaunay Triangulation (commonly referred to as TIN — Triangular Irregular Network), which is an irregular terrain model.
Elevation matrices can be represented as:
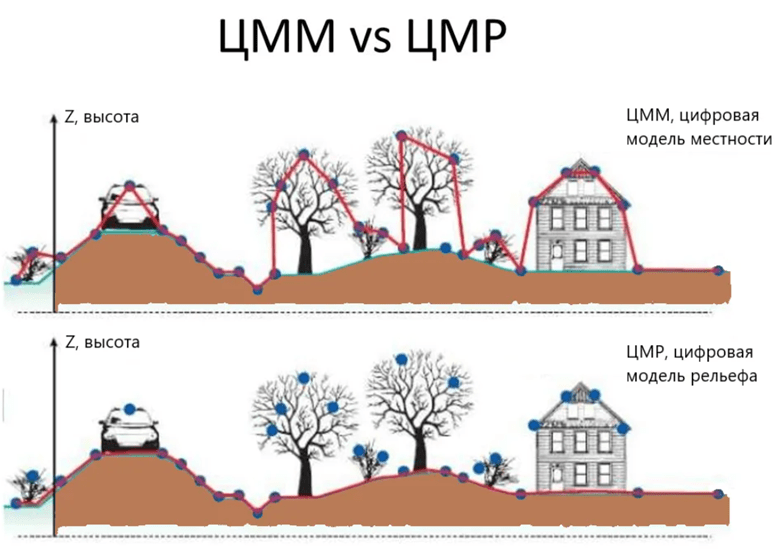
- DEM (Digital Elevation Model) — a set of spatial coordinates for numerous points on the Earth's surface in a specific coordinate system, representing the Earth's surface with a certain level of accuracy and detail.
- DTM (Digital Terrain Model) — a combination of a digital elevation model and a digital model of terrain objects with specified accuracy and detail.
- DSM (Digital Surface Model) — a dataset containing spatial coordinates (in a specific coordinate system) of numerous points located on all visible surfaces, including the ground, buildings, and structures, with a specified level of accuracy and detail.
- DOM (Digital Object Model) — data containing spatial information about the location, shape, and other characteristics of objects (e.g., texture, semantic information, etc.).
Data Collection Methods for Elevation Matrices
There are several methods for collecting data to create an elevation matrix (DEM). Each method has its advantages and limitations, ranging from laser technology to aerial photogrammetry. Here are some key methods:
- Laser Scanning: This method collects precise three-dimensional data of an object's surface using laser radiation. The principle involves directing a laser beam onto the surface, then capturing it with a sensor that measures the time it takes for the beam to reflect off the surface and return. The data is then processed by a computer to generate an accurate 3D model of the object. Laser scanning is one of the most precise methods for DEM data collection, providing highly accurate elevation measurements for creating elevation models.
- Photogrammetry: Photogrammetry relies on aerial photographs taken using a camera mounted on an aircraft, UAV, or drone. Creating a digital elevation model (DEM) requires the use of a stereo pair — two images captured from different vantage points. The stereo pair allows determining the distances between objects on the Earth's surface by comparing images from different angles. Aerial photogrammetry is faster and more cost-effective than laser scanning. However, the accuracy of the resulting DEM depends on the resolution of the aerial images and proper camera calibration.
- Geodetic Measurements: This method involves specialized geodetic tools to measure distances and angles on the Earth's surface. It is typically used to create random DEMs with higher accuracy, but it is costly and time-consuming.
- Synthetic Aperture Radar (SAR): SAR uses radio waves and signals transmitted by satellites to collect DEM data. This method performs well in areas with clouds or other obstacles that might hinder other data collection methods.
- Remote Sensing Satellites: Satellites such as Landsat and Sentinel collect data about the Earth's surface using various sensors, including multispectral and radar. The data obtained from satellites can be used to create DEMs for specified areas.
These are just a few of the data collection methods, and the choice of method depends on the specific requirements and constraints of the project.
Building a Digital Elevation Model
The initial dataset for constructing a digital elevation model (DEM) can include:
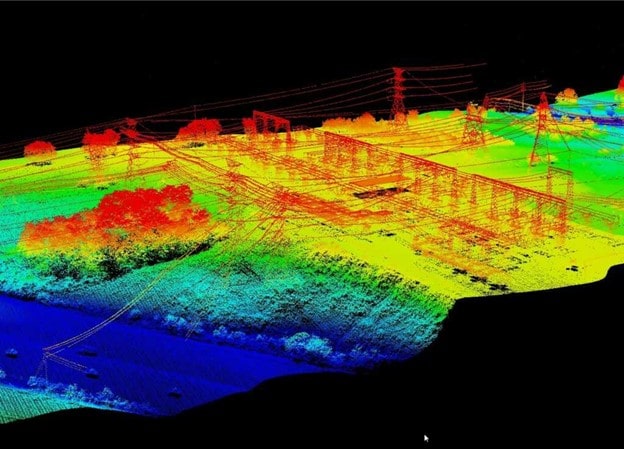
- Point Clouds from Laser Scanning: Constructing a DEM using laser scanning involves specialized equipment known as LIDAR, which uses laser beams to measure distances to objects on the Earth's surface. LIDAR is typically mounted on airplanes, helicopters, or drones to collect highly accurate surface data. To create a DEM from LIDAR data, the point cloud undergoes processing to generate a surface model, which can then be used to create elevation maps, slope maps, relief models, and other products. LIDAR data processing usually involves noise filtering, data registration, surface model creation, and data interpolation.
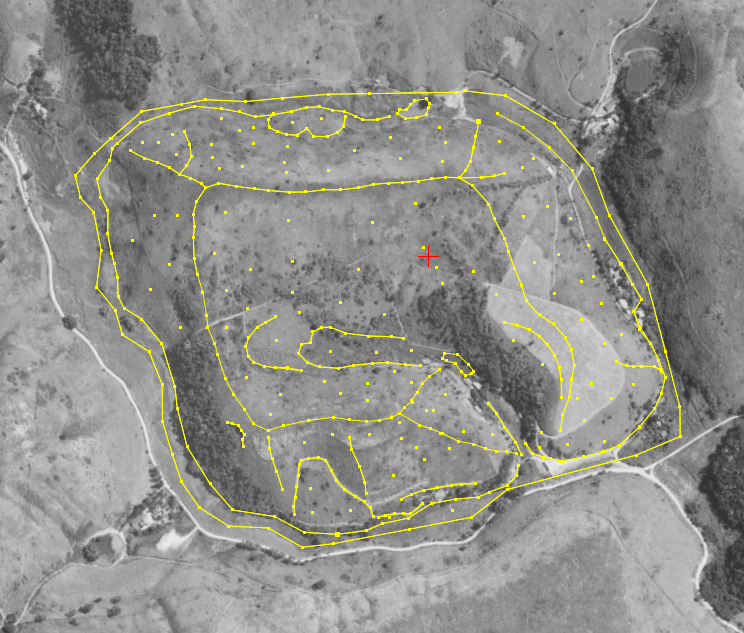
- Spot Heights: These are point vector objects located on the terrain surface. Similar to other vector layers, they can serve as a base layer for constructing TIN (Triangulated Irregular Network). Spot heights can be created manually in stereo mode with or without a correlator. They can also be generated semi-automatically by creating a regular grid of nodes and editing (adding/removing) them manually in stereo mode. There is also an automated method for generating spot heights. A regular grid of nodes is first created, and spatial coordinates of points are computed near the grid nodes using a correlator. Spot heights are generated if the coordinates can be calculated.
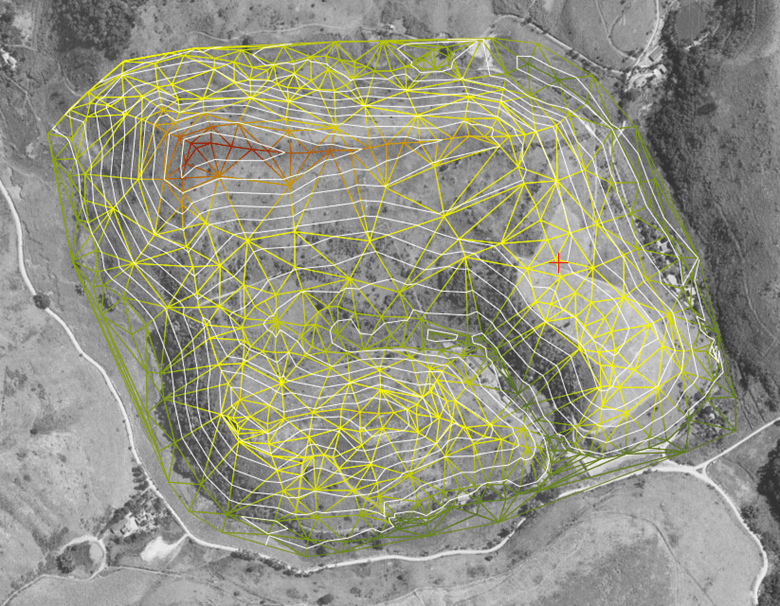
- TIN (Triangulated Irregular Network): An irregular spatial network of triangles. This is one of the spatially coordinated data models used in constructing a DEM. It consists of elevation points at the vertices of an irregular triangle network corresponding to Delaunay triangulation.
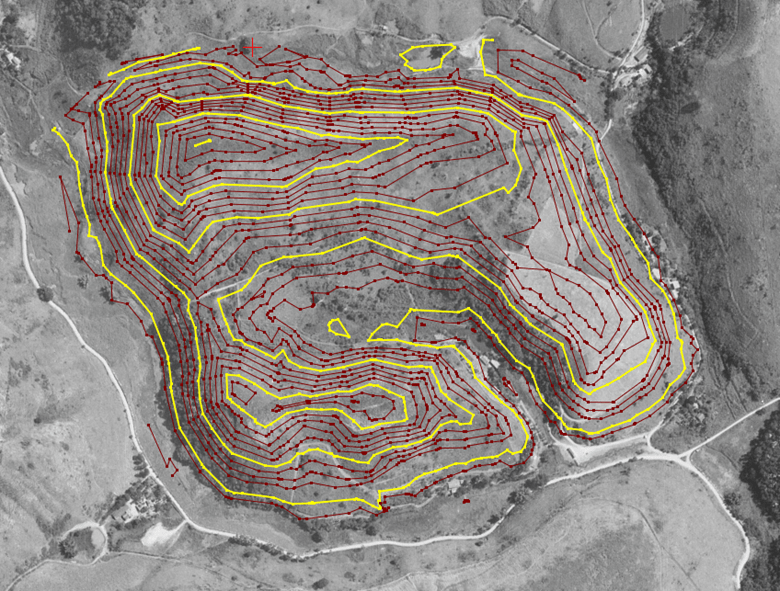
- Contour Lines: These are vector lines connecting points of equal elevation on the terrain.
- Elevation Matrix:
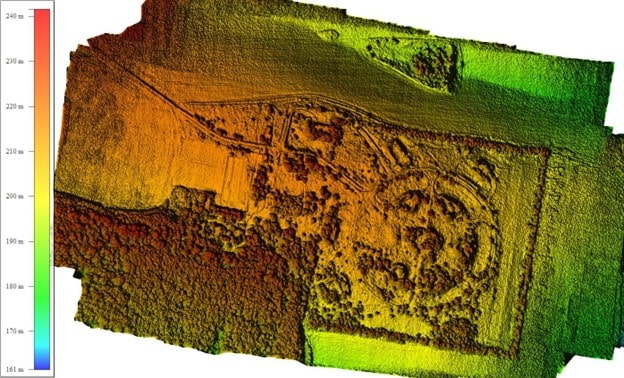
Data processing and constructing the elevation matrix is a critical step in creating a DEM. This process involves several stages, which can vary depending on the data collection methods and processing techniques. Here are some common stages:
- Initially, data must be collected for DEM construction. Sources can include GPS data, LIDAR scans, aerial photography, satellite data, total station measurements, and others.
- After data collection, preliminary processing is conducted. Noise and outliers generated during data collection are removed using various filtering algorithms such as SOR (Successive Over Relaxation) or DTM (Digital Terrain Model).
- Next, surface triangulation is performed, representing all data points as triangles to form a surface. The process of creating triangles may vary depending on the data collection method; for example, LIDAR-based DEMs may form triangles automatically based on the data.
- Data must then be interpolated to create a uniform grid of elevations. Various methods, such as Newton's method, multikriging, or spline smoothing, can be used for interpolation.
- The interpolated data is used to generate the elevation model. Software like ArcGIS or QGIS allows creating visual representations of elevation data on a map.
- After building the model, validation is performed to ensure accuracy. If necessary, corrections are made using additional data or control points.
- Once the model is finalized and validated, it can be used for various analytical purposes. The digital elevation model can also be visualized for better understanding of the results.
Applications of Digital Elevation Models
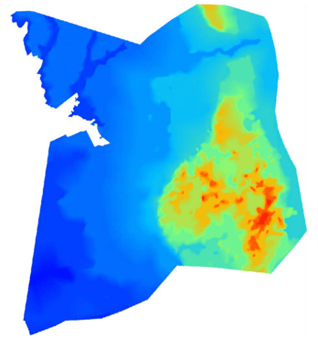
The applications of digital elevation models (DEM) are vast. For example, a project carried out by "Geospatial Agency Innoter LLC" involved creating a digital terrain model for the Leningrad region with rapidly developing infrastructure. The project aimed to evaluate the terrain, aid navigation, conduct survey and design works, support the construction and reconstruction of telecommunication network infrastructure, determine object coordinates, calculate routes, compute radio network coverage, visualize network elements, and solve other tasks for a mobile network operator. One of the deliverables was a regional 2D digital relief model, which fulfilled all customer requests.
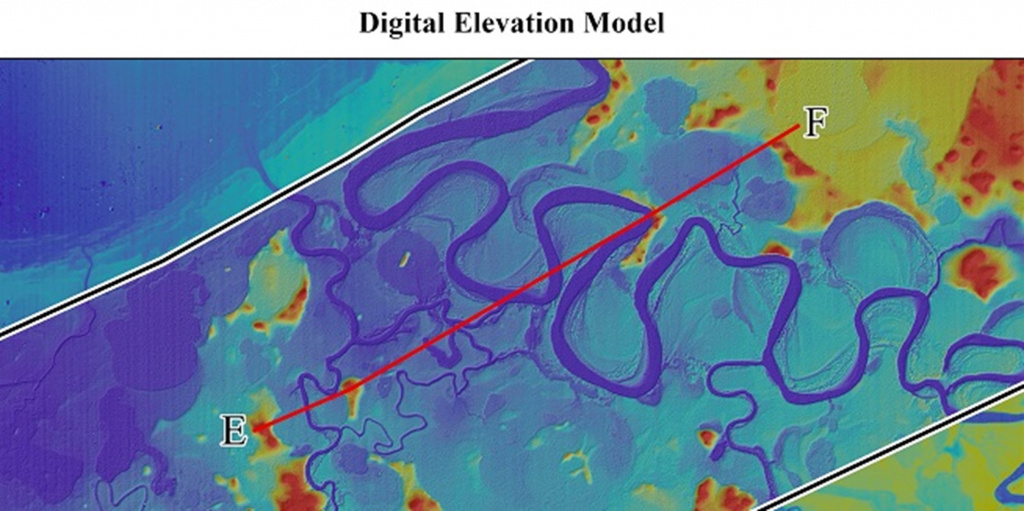
Another example of a DEM project comes from the experience of "Geo Innoter." The goal was to select satellite imagery, create a DEM, and produce longitudinal profiles of a gas field territory for hydrological engineering surveys to lay a pipeline. A digital relief model was developed during the project.
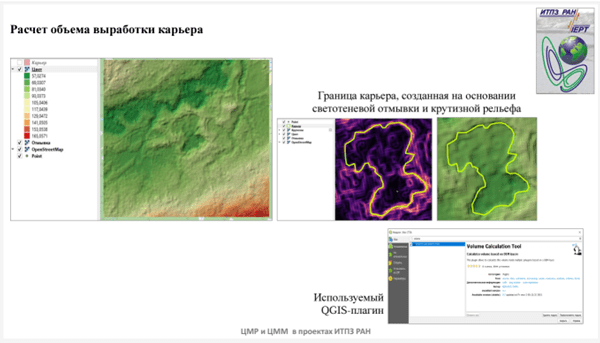
DEMs are widely used in projects of the Institute of Applied Geophysics (ITPZ RAS):
DEMs are also applied in agriculture. A project at Kazan University assessed the accuracy of global digital elevation models (SRTM C-SIR and ASTER GDEM) using a small watershed located on the eastern slope of the Central Russian Upland in the upper basin of the Veduga River. The findings concluded that the accuracy of SRTM C-SIR was sufficient for erosion calculation and medium-scale cartography at the small watershed level. However, its application for large-scale studies is limited to average erosion rate calculations over the watershed area.
DEMs are also used to identify potential sites for ski resorts. A project in the Republic of Mordovia identified possible locations for ski tourism centers.
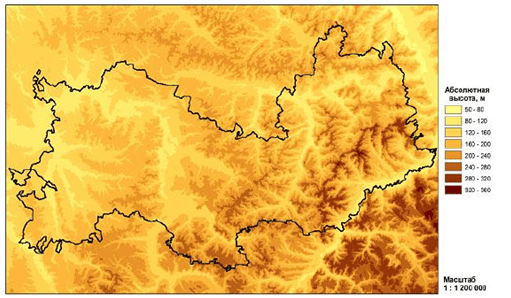
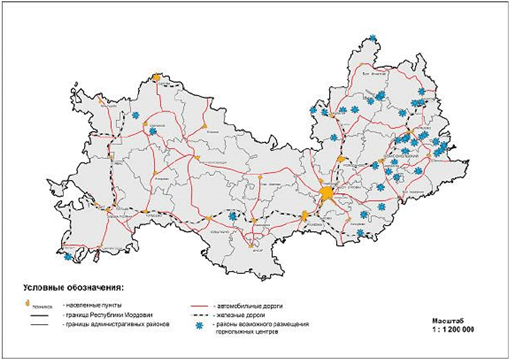
DEM analysis with GIS is an effective means of providing information for specialized terrain mapping. GIS enables spatial referencing of objects, determination of morphometric parameters, and the creation of numerous derivative geomorphometric maps. Using DEMs and publicly available remote sensing data facilitates comprehensive data collection and processing for specialized medium-scale terrain mapping. The Korshunovsky Mining and Processing Plant project demonstrated the creation of derivative geomorphometric maps based on DEMs.
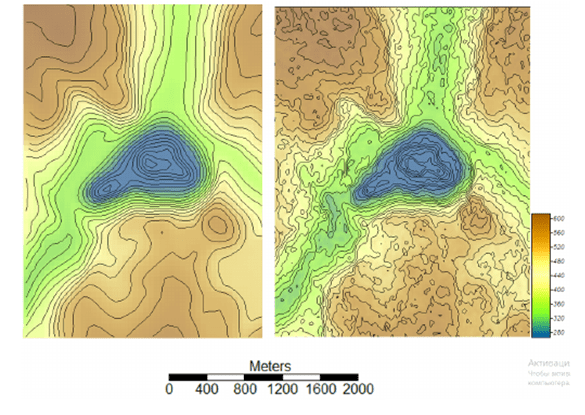
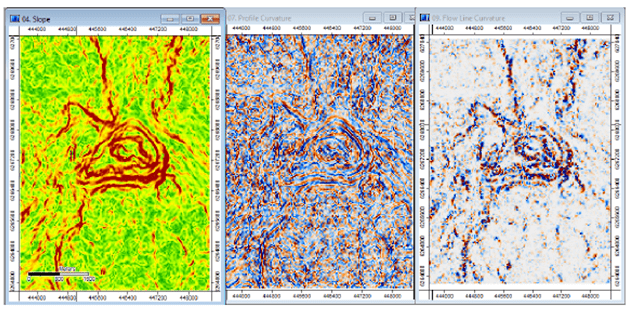
In Google Earth, elevation data is implemented using a digital elevation model. DEMs in Google Earth are three-dimensional models of the Earth's surface where elevation at each point is determined by latitude, longitude, and elevation values. These DEMs are constructed from various data sources, including radar satellites, LIDAR scans, photogrammetric methods, and other geoinformation technologies. The data is combined and processed to create a grid of elevation values for a specific area. Google Earth uses these data to create visual landscape representations in virtual models, enabling users to zoom, rotate, and explore areas from different perspectives.
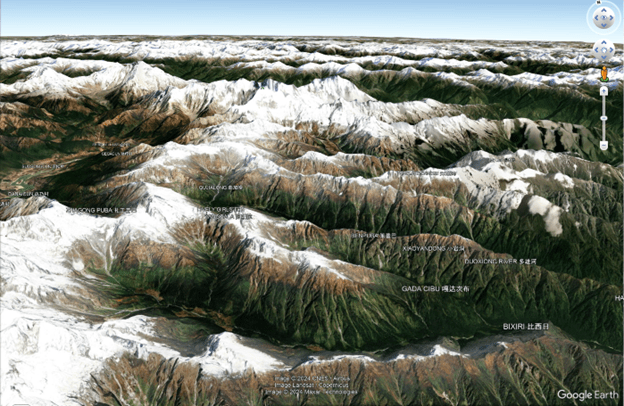
These are just a few possible applications of DEMs. As you can see, DEMs have numerous practical
applications that utilize Earth's surface relief information for more effective and precise
global development.
Conclusion
The elevation matrix is an indispensable tool for studying relief and planning various tasks in geology, hydrology, geomorphology, construction, and other industries.
This article also describes the different types of elevation matrices, data collection methods for their creation, and the process of building a digital elevation model.
