Consequences
Methods
Some of the main methods of Earth remote sensing used in ecological research include:
Multispectral Imaging:
Multispectral imaging captures image data in specific wavelength ranges of the electromagnetic spectrum. Wavelengths can be separated by filters or detected using instruments sensitive to certain wavelengths, including light frequencies beyond the visible range, i.e., infrared and ultraviolet. This can allow extracting additional information that the human eye cannot perceive with its visible receptors for red, green, and blue colors.
Multispectral satellites collect data in 5–20 spectral ranges. The image usually consists of three primary colors and several infrared parts of the spectrum. This makes them more cost-effective.
The advantages of this method include a wide spectral coverage, allowing for information gathering on various Earth surface characteristics. Comparatively low data cost and availability due to the presence of mass-produced satellite systems. Large data volume and the ability to conduct large-scale studies.
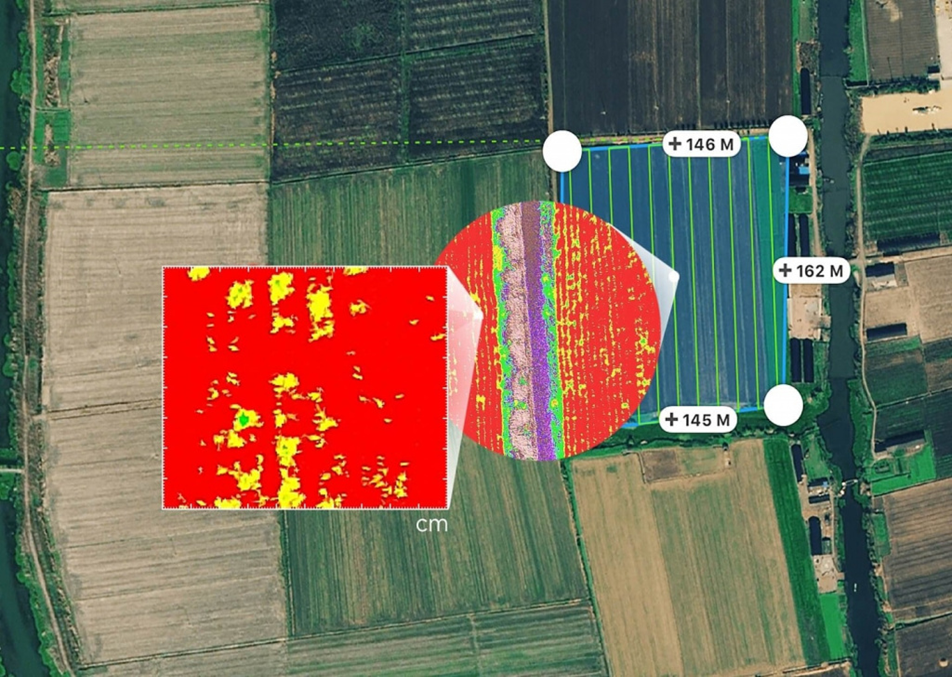
Fig.4. Example of multispectral imaging of fields using the DJI Phantom 4 Multispectral UAV.
Hyperspectral Imaging
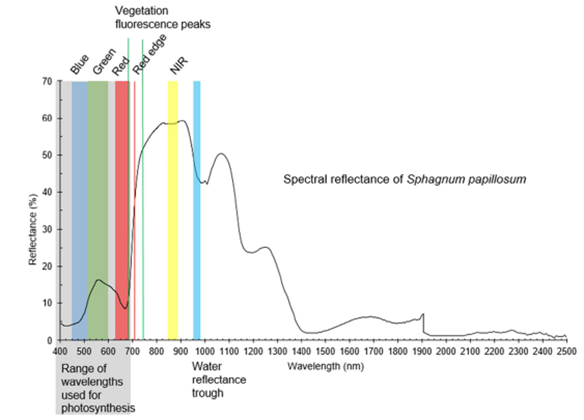
Hyperspectral remote sensing differs from classical optical multispectral approaches in the number and width of spectral bands recorded by the sensor. While multispectral sensors measure the optical part of the electromagnetic spectrum in several (< 10) relatively broad bands (approximately 40–100 nm wide), hyperspectral sensors measure the optical part of the electromagnetic spectrum in many (> 50, often many more) regularly spaced narrow bands approximately 5 to 10 nm wide. Hence, hyperspectral data allow for detailed selection of all spectral reflection characteristics that can be used for quantitative assessment of various biological, geological, and chemical properties of the Earth's surface.
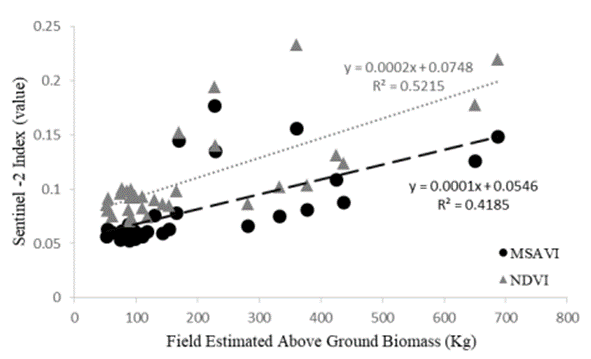
It is interesting to note that classical multispectral sensor systems are also increasingly using narrow spectral bands to measure specific vegetation properties. Multispectral instruments on board Sentinel-2a and Sentinel-2b, for example, have three narrow bands in the near-red spectral region, as well as a narrow band in the near-infrared region, allowing for a more detailed characterization of vegetation properties.
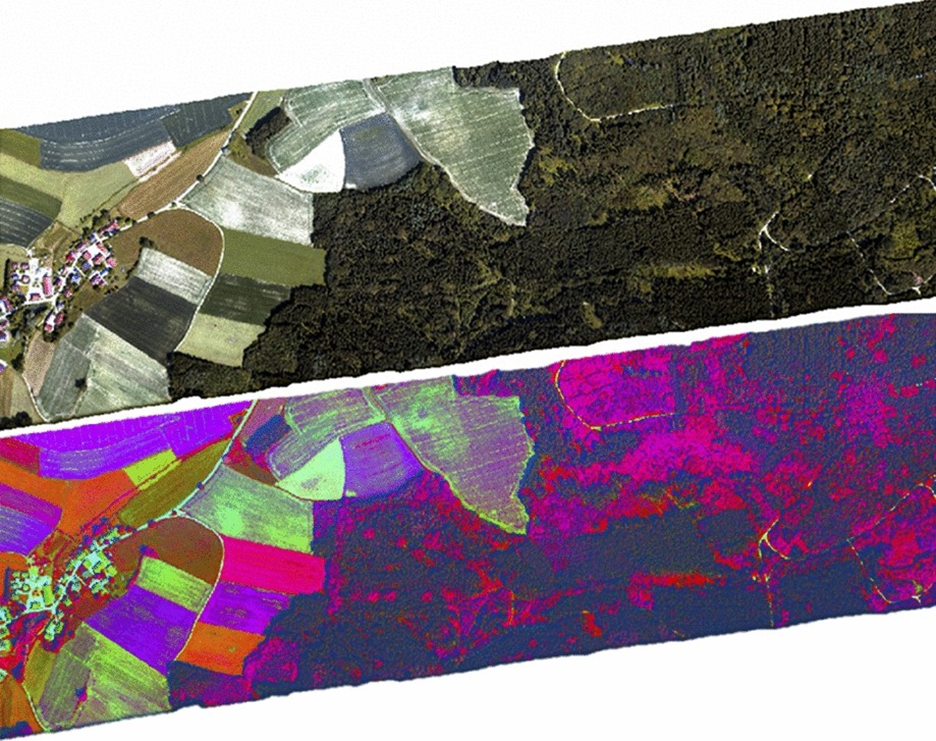
Currently, several spaceborne hyperspectral sensors are available (e.g., Hyperion on board EO-1 or the Compact High Resolution Imaging Spectrometer on board PROBA-1). These spaceborne hyperspectral sensors will help better understand the global spatial and temporal variability of ecosystem biogeochemical properties.
Lidar Scanning
Optical remote sensing is limited in studying vegetation cover due to the inability of sunlight to penetrate through tree canopies and other vegetation, leading to the emergence of a new type of active sensor - LiDAR. It allows for more precise and detailed study of vegetation structure. LiDAR sensors use laser beams to measure the time required for the laser beam to refract and reflect back to the sensor. Based on this data, the height above the ground can be determined. By creating a three-dimensional point cloud from reflected laser beams, maximum height values can be identified and converted into a digital surface model - a regular grid of cells reflecting vegetation height.
However, despite the capabilities of airborne LiDAR for understanding spatial (and spatio-temporal) dynamics of ecosystems, it remains an expensive tool due to the high cost of operating platforms such as UAVs, airplanes, and helicopters, especially over large spatial extents. Thus, analysis often is limited to areas with existing data or small areas and individual measurements. This gap can be filled by new spaceborne LiDAR data from the Global Ecosystem Dynamics Investigation (GEDI) system, which provides "LiDAR footprints" with a diameter of 25 m on a regular 60 × 600 m grid. By merging GEDI with optical satellite data in the future, global maps of key vegetation features, such as global tree height, can be created.
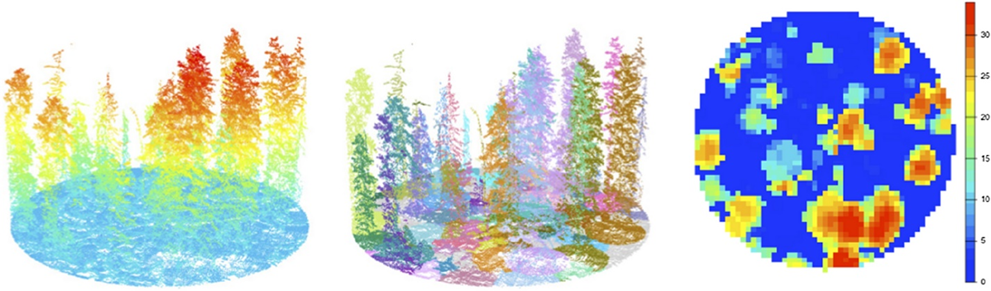
Fig.6. Examples of LiDAR point clouds for a research forest plot of 500 m 2 (left panel) with individual trees segmented to obtain structural metrics based on trees (e.g., height; middle panel). Data were collected from a helicopter in 2021 and processed using the lidR open-source package. The right panel shows the canopy height model derived from the point cloud at a spatial grain of 1 m2.
Radar Sensing
Radar is another type of active data collection using emitted microwaves by the system to determine the distance, angle, and physical properties of objects on the Earth's surface. An active radar sensor does not rely on sunlight as the radiation source and can therefore operate even at night and in cloudy conditions. Although radar methods themselves are not new and historically have been used for topographic mapping, radar data has played an increasingly prominent role in ecosystem dynamics research due to the emergence of open-access spaceborne radar systems, such as the ESA Sentinel-1 satellite, high spatial resolution of modern radar systems (<10 m), and the radar's ability to penetrate cloud cover.
Recent studies have tested the ability of radar to track vegetation phenology, forest disturbances caused by bark beetles and fires, as well as deforestation in the tropics, where the ability to see through clouds has significantly expanded monitoring capabilities. Depending on radar polarization, radar can penetrate vegetation and thus assess vegetation structure. Radar has also been applied to study wetlands and urban areas, thus its utility extends beyond more classical applications in forest ecosystems.
While additional research is needed, radar holds great promise for analyzing vegetation structure in space and time, regardless of cloud cover. Thus, future radar systems are specifically designed for global monitoring of biomass dynamics.
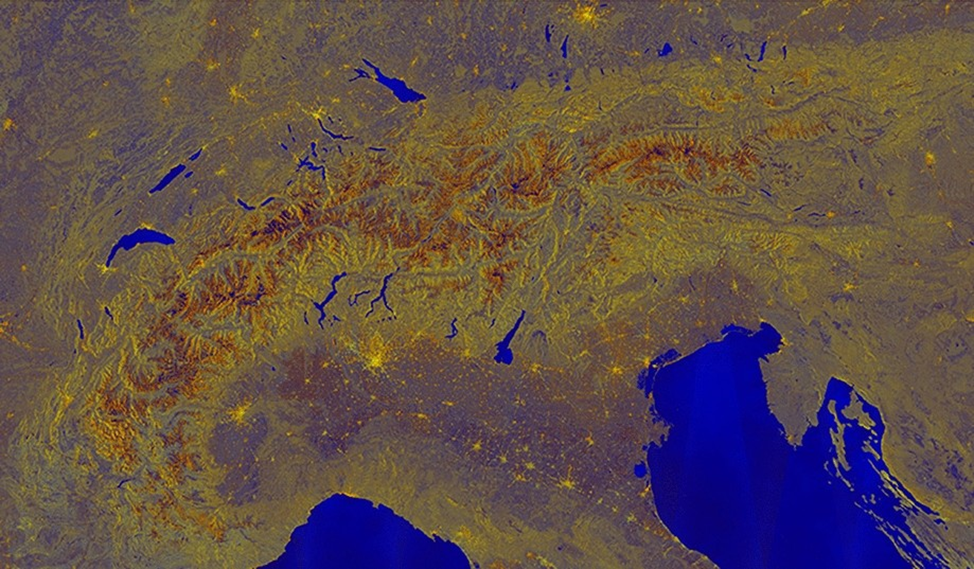
Fig.7. Example of seamless radar data set acquired over the European Alps from Sentinel-1. Red/green/blue colors show different radar signal polarizations, averaged for the summer of 2021.
Thermal Sensing:
Thermal cameras mounted on drones or satellites record infrared radiation, which is a reflection of the thermal radiation of objects on the Earth's surface. Thermal sensing allows researchers to study the thermal characteristics of ecosystems, including thermal anomalies, changes in the temperature of water resources, and heat distribution in urban areas.
Using thermal radiation to study processes related to the thermal balance in ecosystems. Detecting thermal anomalies and identifying sources of heat. Using for studying climate change and monitoring the thermal state of water resources.
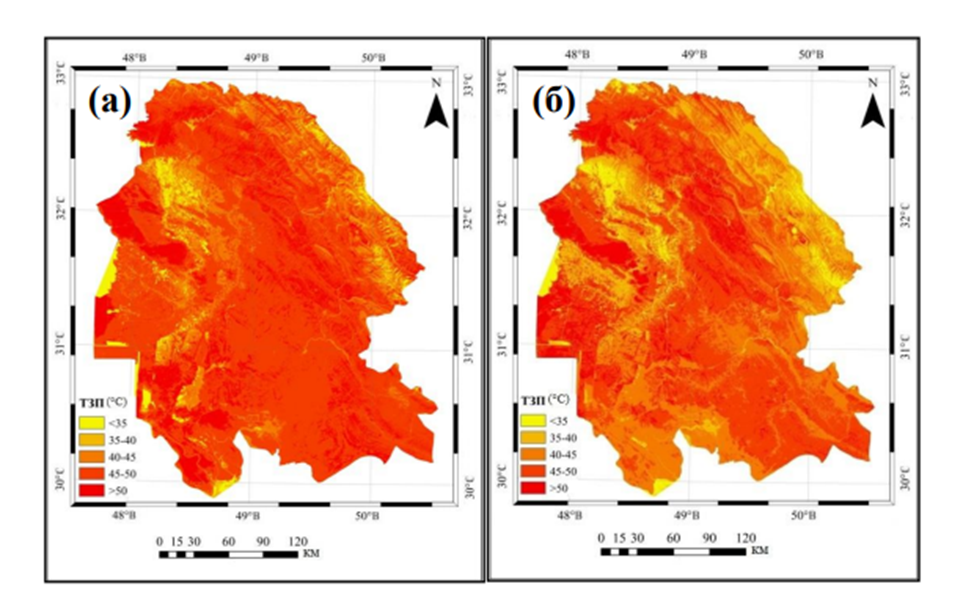
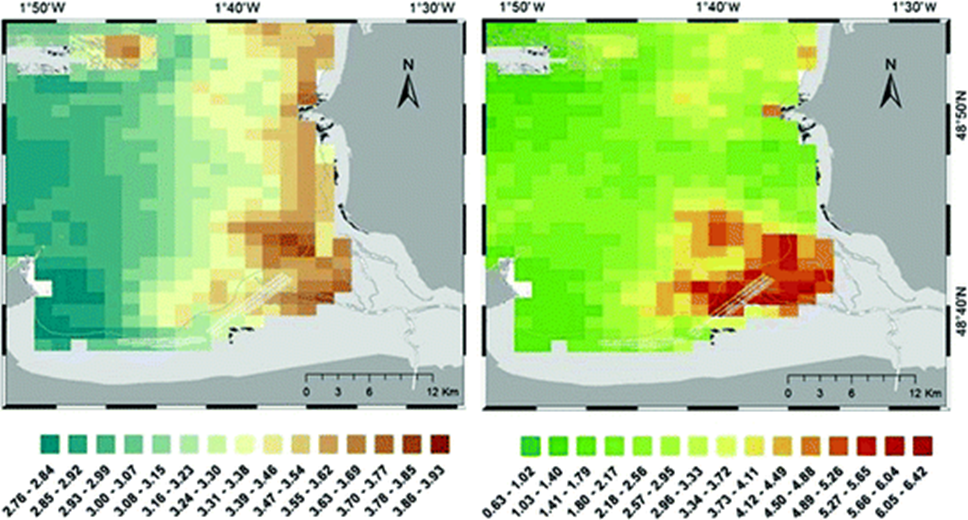
Fig.8. – Rasters of noon surface temperatures in degrees Celsius and vegetation index NDVI for the seasons of 2011, May (a), September (b).
These land remote sensing methods have unique capabilities for obtaining data on the Earth's surface and its condition. Researchers can use this data to monitor ecosystems, detect changes in the environment, and make informed decisions in environmental protection.
Application of Remote Sensing Methods in Ecological Research
Mapping Forest Distribution. Application of Remote Sensing in Forest Management and Biodiversity Conservation.
Images and subsequent mapping are widely used in forest ecology and restoration plans. Additionally, researchers rely on remote sensor data to assess biophysical and biochemical properties, down to individual trees in the forest. Currently, biodiversity needs to be protected primarily to maintain the mechanisms of functioning of living nature in forests and ecosystems; maintain the ability to withstand environmental changes, as well as to discover and use new opportunities that can contribute to the development and ensure the survival of future generations. The evolution of remote sensing tools allows for the improvement of existing approaches and the development of new innovative approaches for better assessing the response of biodiversity to the management of natural ecosystems and their preservation.
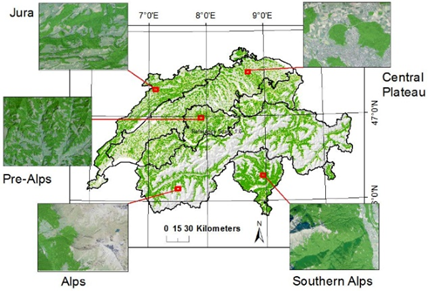
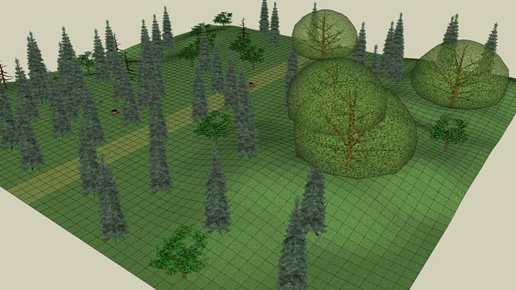
Fig.9. Forest mapping based on images down to the tree level
Land Use Information
In ecology, researchers seek to understand the relationship between living organisms and their physical environment. To do this, they must study vegetation cover and its use. There are "thousands" of ways to do this, but one of the most convenient and reliable is remote sensors. Remote sensors create images necessary for analyzing how land is used, and advanced LULC technology provides detailed indexes of its composition and critical changes towards deterioration. Images also clearly show the land surface, which is traditionally mapped to analyze the environmental situation (including mapping land composition indexes) and allows understanding the scale of potential environmental damage.
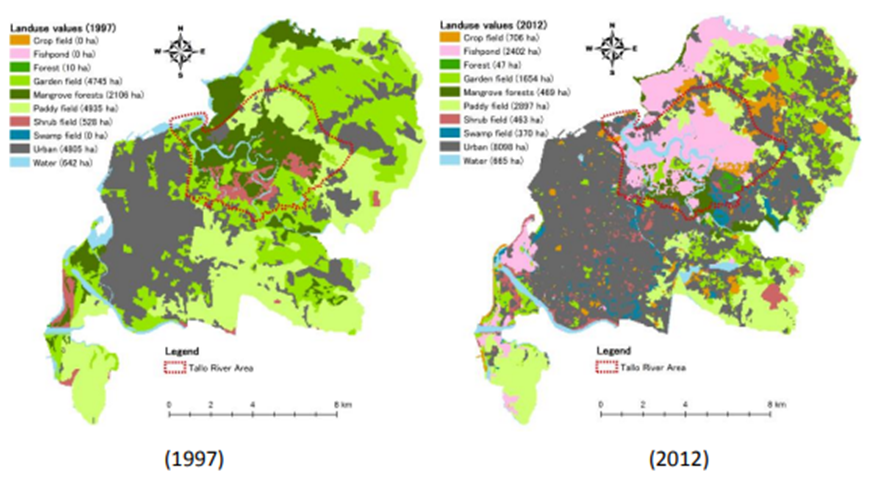
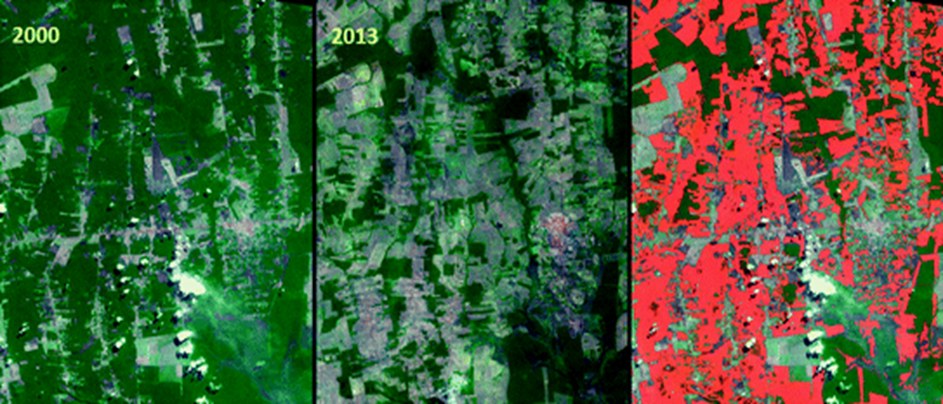
Fig.10. Mapping of ecological land use changes
Overall, the pace of land degradation on Earth today is still higher than the pace of land restoration. Despite the potential for climate change mitigation through global tree restoration, there is an urgent need for action. Rehabilitating 12 million hectares of degraded land per year can help reduce the emissions gap by 25% by 2030.
Given the need for accelerated action on a global scale, land planners, policymakers, and other stakeholders need the best available data to understand, plan, and manage ecosystem restoration and accurately calculate carbon sequestration in these ecosystems.
Plant Chemistry and Moisture
When studying vegetation and plant moisture, various tools are used. The chemical composition of vegetation is a crucial indicator of their ecological condition. Multispectral instruments with high and coarse spatial resolution, which are remote sensors, work wonders in studying the chemical composition of vegetation and moisture. Botanists rely on this sensor (detector) as the primary source of ecological data. Based on the synthesis of various multispectral channels, information about the state of vegetation can be obtained.
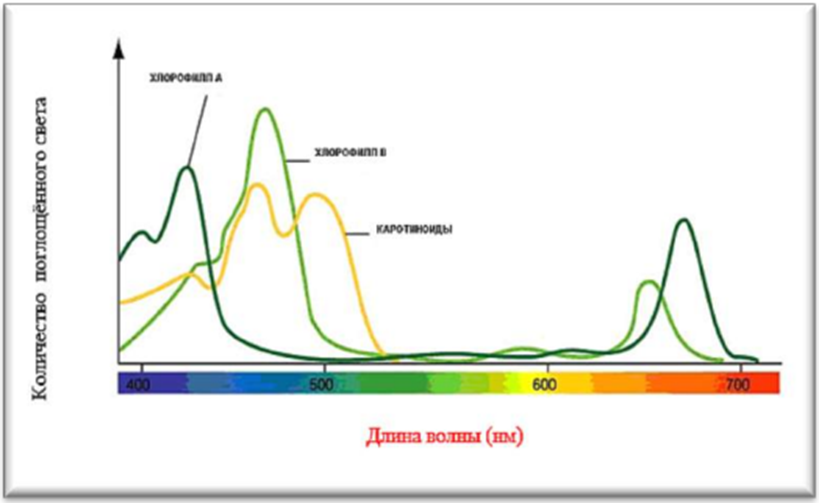
Fig.11. Absorption bands of chlorophyll by plants
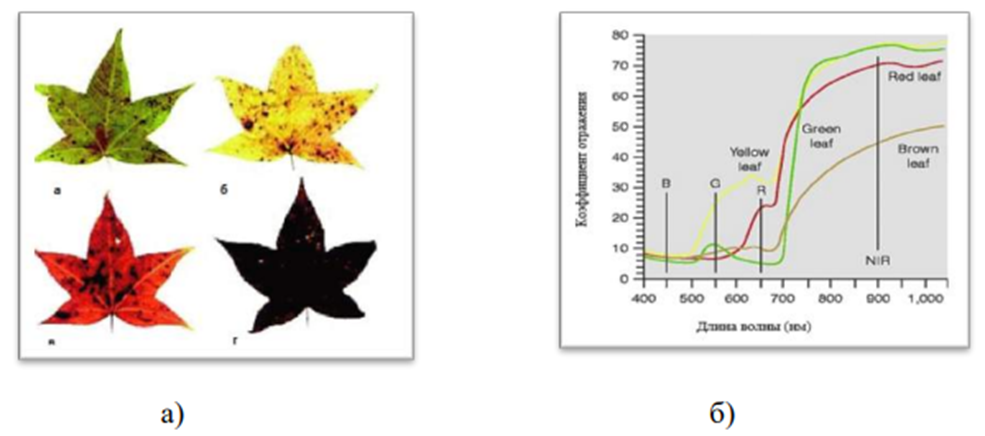
Fig.12. - Reflection spectra at different levels of chlorophyll content in the leaf