of geospatial solutions
Sat-Sun: Non-working days
Sentinel-5 Precursor (Sentinel-5P) is a space satellite launched in 2017 by the European space Agency (ESA) for the purpose of daily global monitoring of the chemical composition of the earth's atmosphere, the content and distribution of major pollutants and greenhouse gases in it. The main payload of the satellite is the TROPOMI sensor (Tropospheric Monitoring Instrument), which collects data in the ultraviolet (UV), visible (VIS), near (NIR) and mid-infrared (SWIR) bands. The spatial resolution of the sensor varies from 1.8 to 28 km, but for most channels it is 7x7 km (table 1). In channel 1, the larger pixel size is due to the low signal-to-noise ratio in this spectrum range. The temporary resolution of the sensor is only 1 day with global coverage.
Table 1. TROPAMI sensor features
| Channel № | Spectrum | Spectral range, nm | Spatial resolution, km |
|---|---|---|---|
| 1 | UV1 | 270–300 | 21х28 |
| 2 | UV2 | 300–320 | 7х7 |
| 3 | UVIS | 270–300 | 7х7 |
| 4 | VIS | 405–500 | 7х7 |
| 5 | NIR1 | 675–725 | 7х7 |
| 6 | NIR2 | 725–775 | 7х1,8 |
| 7 | SWIR | 2305–2385 | 7х7 |
- Total O3 content in the atmosphere (L2_ O3).
- O3 content in the troposphere (L2_O3_TCL).
- NO2 content in the troposphere and total (L2_NO2).
- The total content of SO2 (L2__SO2).
- Total CO content (L2__ CO).
- The total content of CH4 (L2__C4).
- Total HCHO content (L2__HCHO).
- Aerosol pollution index (L2__AER_AI).
The content of gases in products is determined in mol/sq. m of the vertical column of the troposphere / atmosphere, but for convenience, the value can be converted to mmol/sq. m. In addition, Sentinel-5P provides a lot of secondary data, such as cloud share, surface albedo, wind speed, and so on. Data is delivered in the NetCDF (Network Common Data Form) format, so special software and knowledge of programming basics are required for processing and geographical reference.
Since the spatial resolution of Sentinel-5P data is low, atmospheric pollution studies can be conducted starting from a regional scale. However, the most optimal studies are country-wide, continent-wide, or global.
According to Sentinel-5P data, it is possible to map atmospheric air pollution with nitrogen dioxide (NO2), which is also an indicator of nitrogen monoxide (NO) content. Nitrogen dioxide is obtained by the oxidation of nitrogen monoxide, which in turn is formed from atmospheric nitrogen and oxygen at high temperatures, respectively, the entry of this compound into the atmosphere is associated with the burning of fossil fuels. In nature, this compound is formed mainly during thunderstorms or during the decomposition of biomass. However, the values of natural nitrogen dioxide formation are small, which makes it easy to map anthropogenic NO2 pollution.
Main anthropogenic sources of atmospheric air pollution:
- Motor transport.
- Thermal power plants (CHP).
- Metallurgical enterprise.
- Chemical enterprise.
The spread of pollution is influenced by atmospheric conditions such as air pressure, wind speed and direction, vertical temperature distribution, and so on.
Nitrogen dioxide pollution
Because of the contrast between natural and anthropogenic sources of pollution, nitrogen dioxide is the most convenient atmospheric pollutant for mapping from space. Figure 1 shows the pollution of the troposphere of the Central Federal district with nitrogen dioxide for June 6, 2019. The spatial resolution of the image is approximately 5 km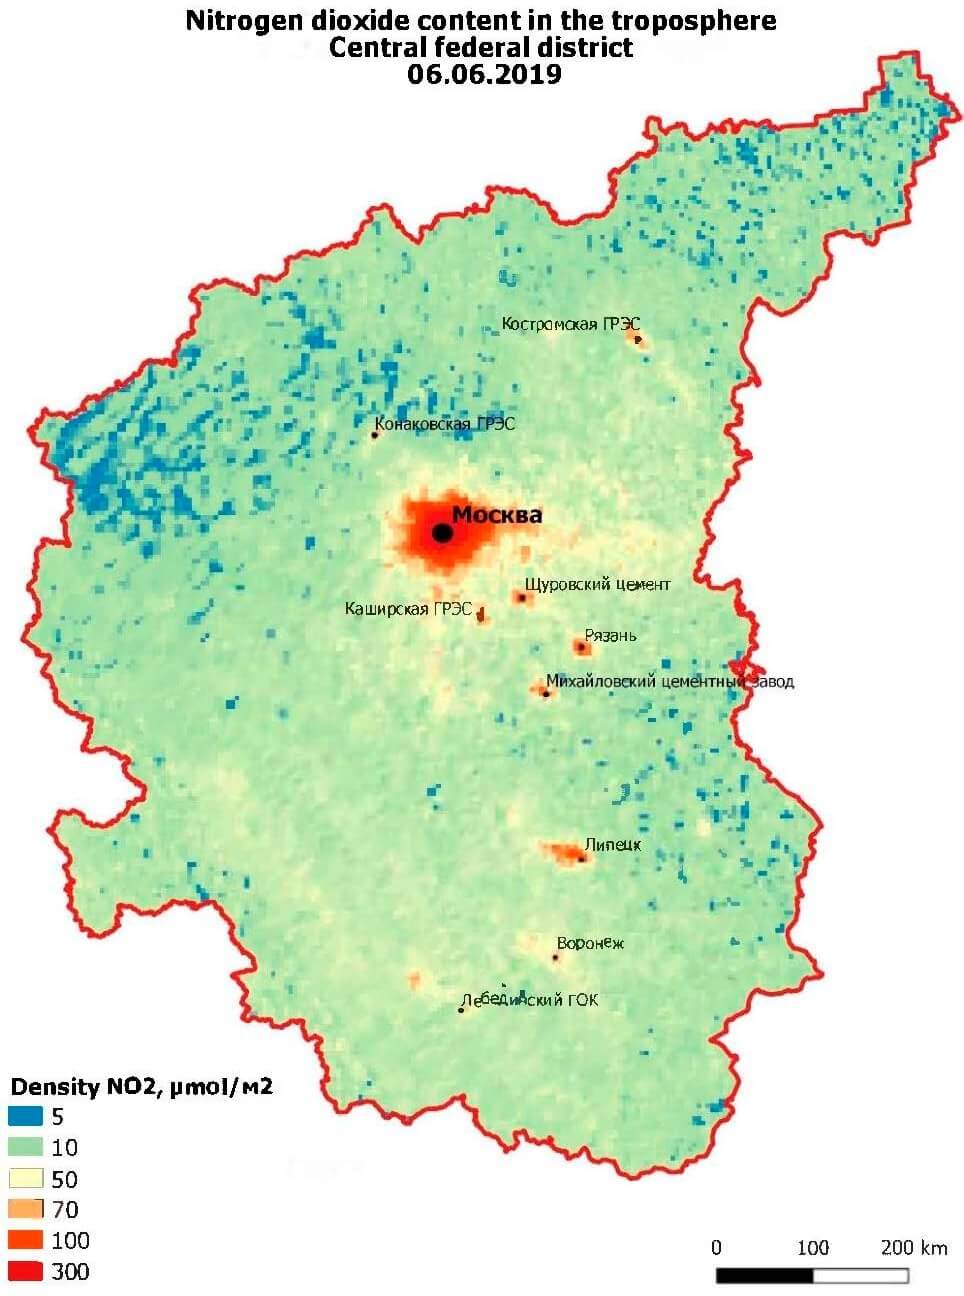
The emissions of industrial enterprises
The Moscow agglomeration is very much distinguished by the pollution of the troposphere with nitrogen dioxide due to the huge density of road transport and the abundance of industrial enterprises. The content of nitrogen dioxide in the Moscow region is 10-40 times higher than the background values. Nitrogen dioxide polluted the troposphere over large GRES: Konakovskaya, Kostroma and Kashirskaya. The concentration of NO2 over Lipetsk and Ryazan, where the Novolipetsk metallurgical plant and Ryazan oil refinery are located, is significantly exceeded. Against the General background, large cement plants are also identified, where nitrogen oxides are formed during firing and sintering of the mixture components.
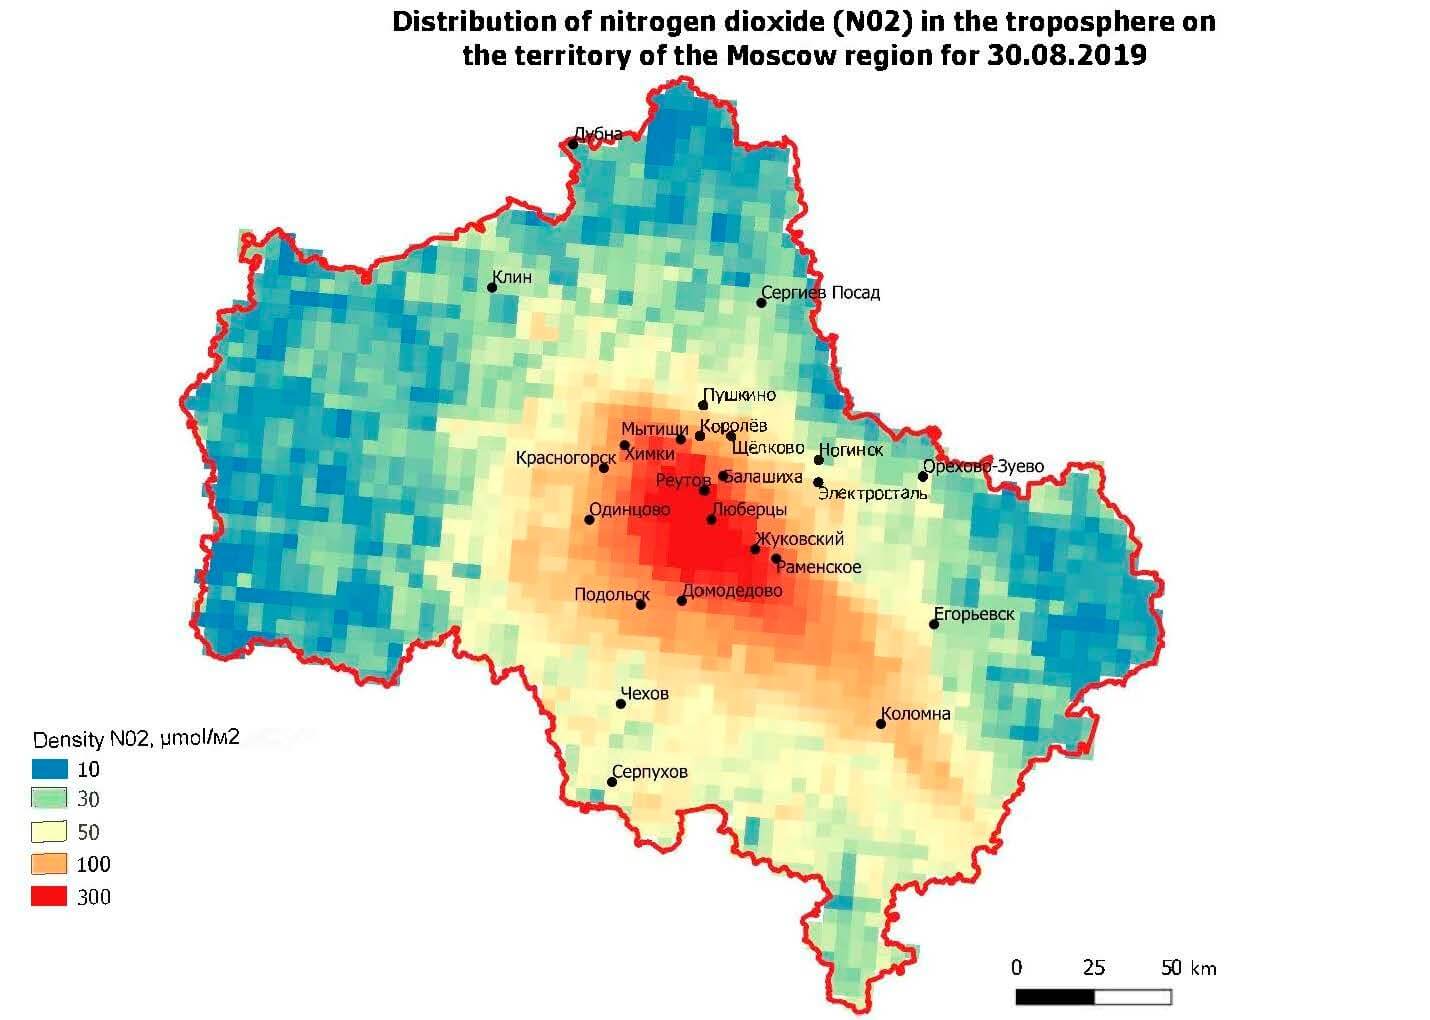
Regional pollution studies are also possible (figure 2). There is a plume of pollution in the South-East direction from Moscow, as well as low NO2 concentrations in areas with low population density and industry in the Western, Northern and Eastern parts of the region.
It is advisable to monitor the concentration of nitrogen dioxide on a daily basis, since the content of this compound can fluctuate sharply due to atmospheric conditions. Performing time averaging (week, month, season, and so on) will help avoid the influence of cloud cover, which reduces or makes it impossible to measure the concentration of pollutants in the troposphere.
Carbon monoxide pollution
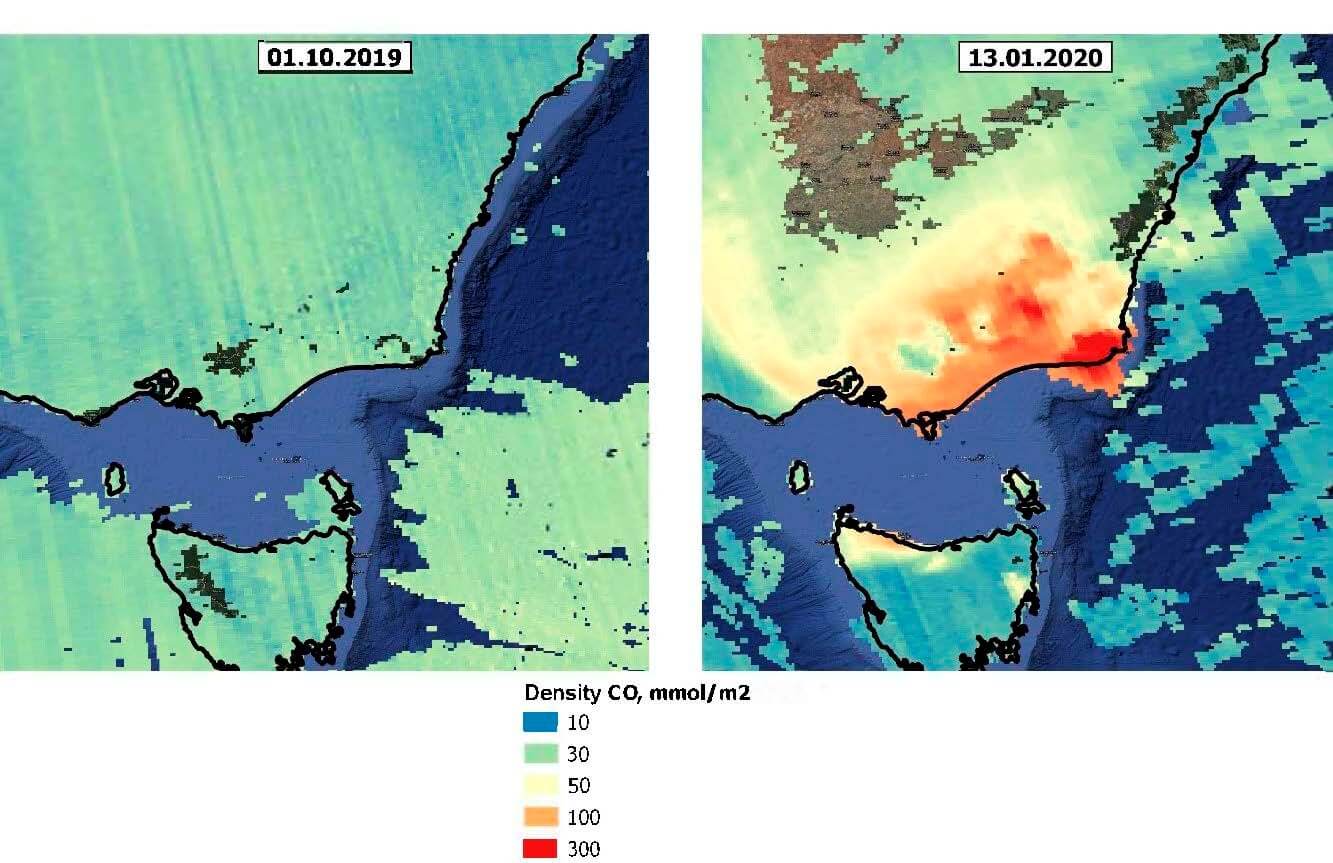
The main anthropogenic sources of carbon monoxide in the atmosphere are motor transport, metallurgical enterprises, thermal power plants, and chemical industries. In natural conditions, the carbon monoxide compound is formed when biota decomposes as a result of the life of organisms, during volcanic eruptions. Huge amounts of CO are released into the atmosphere during wildfires. In General, carbon monoxide is formed by incomplete combustion of organic fuel. Figure 3 shows a huge increase in carbon monoxide concentrations in South-Eastern Australia caused by wildfires in late 2019 and early 2020. In some places, the CO concentration exceeded the background concentration by 30-50 times. Missing pixels indicate poor data quality.
Pollution by sulphur dioxide
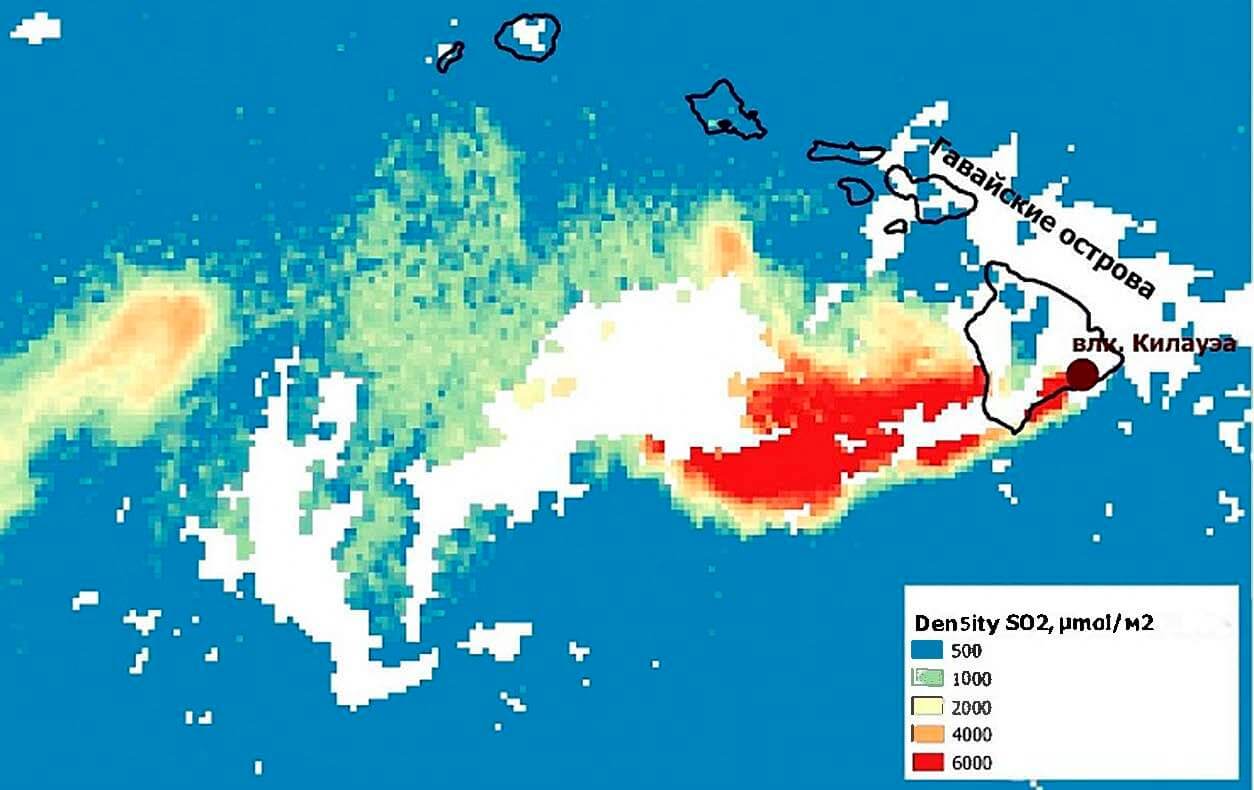
Sulfur dioxide is one of the main and dangerous pollutants in the atmosphere. The SO2 compound enters the atmosphere both naturally and as a result of human activity. Natural sources of sulfur dioxide are primarily volcanic eruptions. Figure 4 shows the content of sulfur dioxide in the air in the vicinity of the erupting Kilauea volcano, located in the Hawaiian Islands. A large plume of high CO2 content is visible, spreading in the Western direction from the volcano. The content of polluting gas as a result of a volcano eruption is several tens of times higher than the background one.
The main anthropogenic sources of sulfur dioxide entering the atmosphere: metallurgical enterprises, coal-fired power plants, chemical enterprises, etc. Figure 5 shows the content of sulfur dioxide in the atmosphere in the vicinity of the city of Norilsk, where the Norilsk mining and metallurgical combine is located, which annually emits more than 1.5 million tons of pollutants into the atmosphere. The SO2 content in the atmosphere due to the activities of the plant exceeds the background value by 40-70 times.
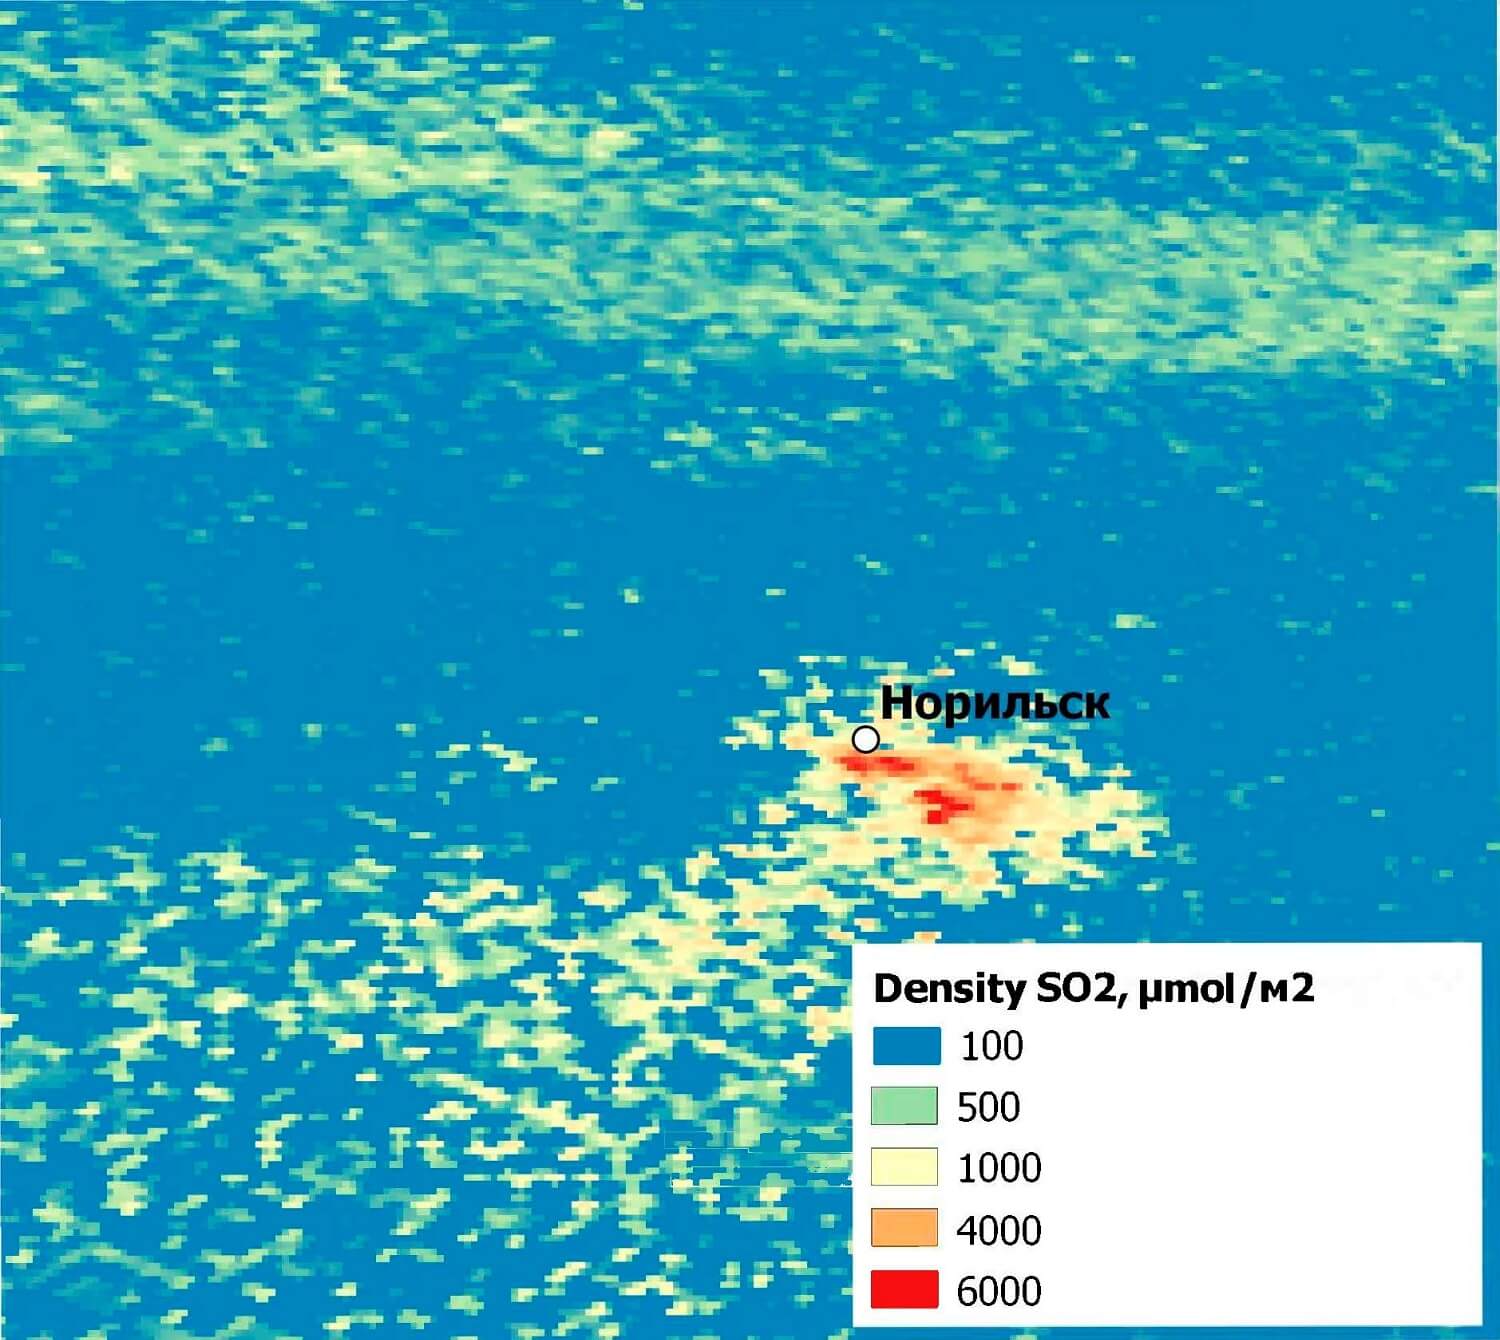
According to Sentinel-5P data, you can monitor industrial emissions in dynamics and compare the data obtained with official statistics.
Sulfur dioxide "lives" in the atmosphere for a relatively short time, a few days. When interacting with water and oxygen, sulfuric acid is formed from CO2, which, falling to the earth in the form of acid rain, causes significant environmental damage to the environment.
Of the methane pollution
Methane is the third (after water vapor and carbon dioxide) in the degree of influence on the thermal balance of the atmosphere by greenhouse gas. The methane content is usually measured in parts per million or billion (ppm and ppb, respectively). According to Sentinel-5P data, it is possible to study the content of methane in ppb of dry air. However, cloud cover greatly affects the determination of the concentration of this gas, so it is possible only in absolutely cloudless weather.
The main natural sources of methane entering the atmosphere are swamps, termites, and other water areas where anaerobic decomposition of organic matter occurs, the activity of methanogenic bacteria, gas hydrates, and others. Among the anthropogenic sources of methane formation are rice fields, animal husbandry, natural gas leaks during extraction andtransportation, landfills, chemical industry enterprises, etc.
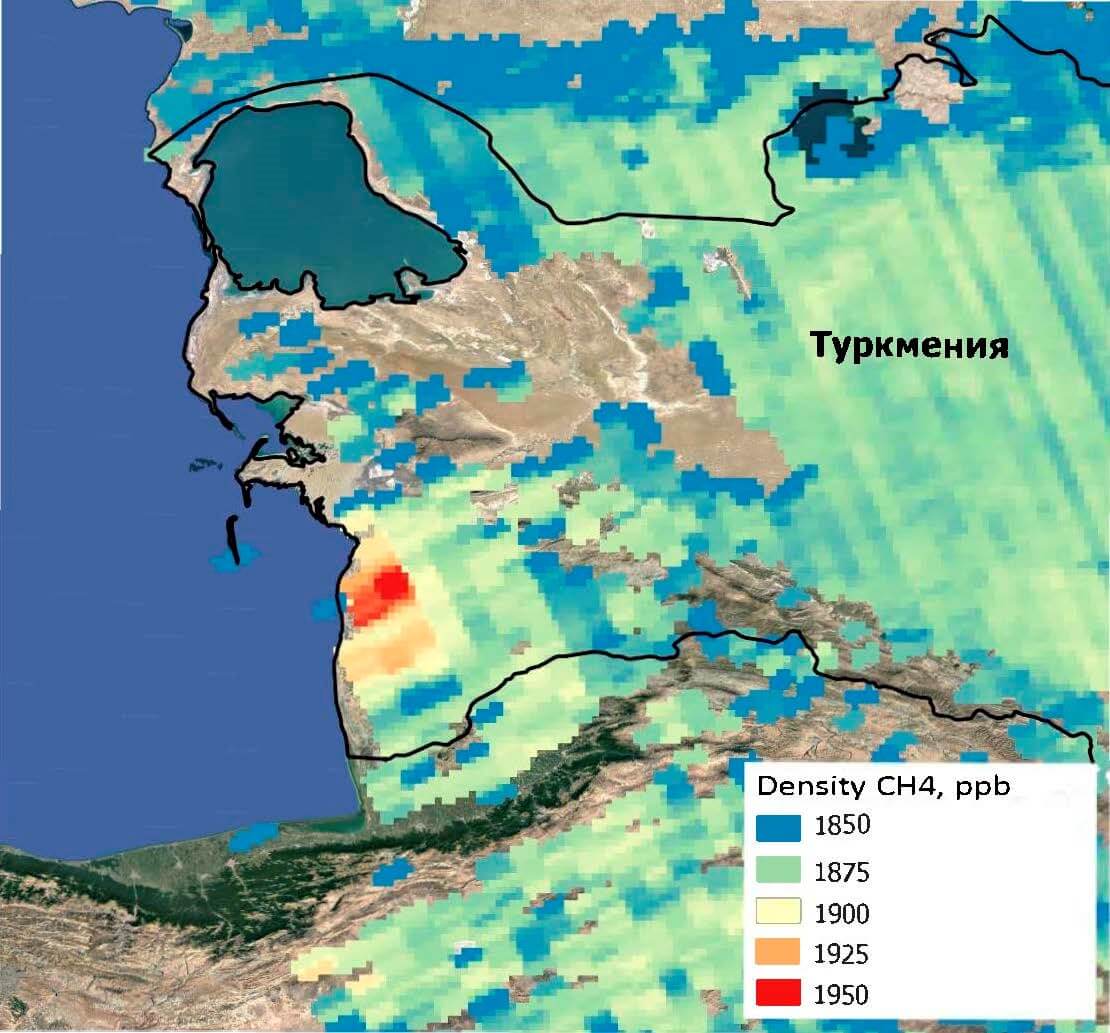
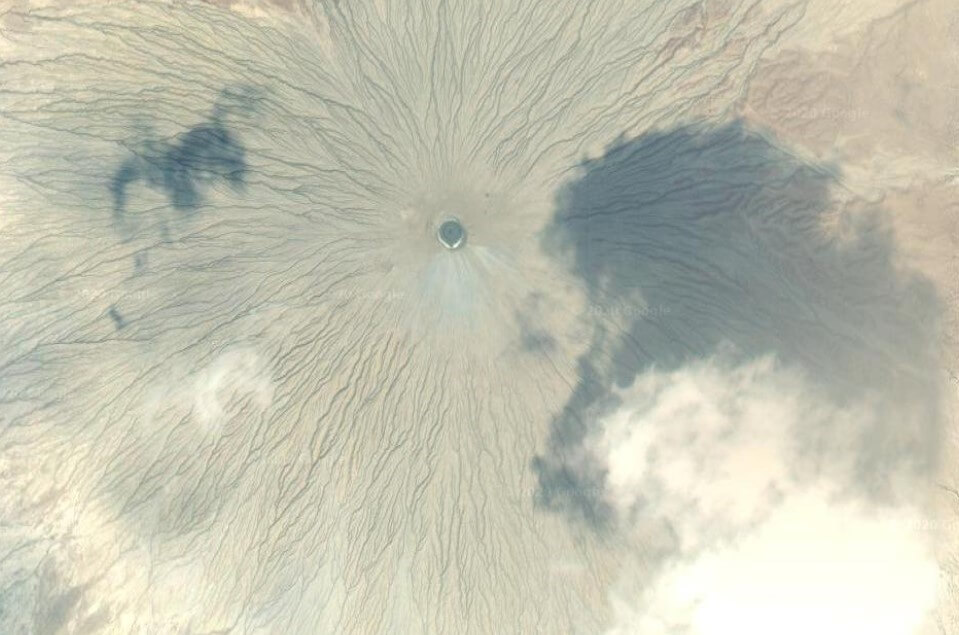
Figure 6 shows the excess concentration of methane in the air in the South-West of Turkmenistan in the area of spreading mud volcanoes, which are closely related to the emission of methane from the earth's crust. Figure 7 shows how such a volcano looks on the ground.
Due to the strong influence of cloud cover on the measurement of methane content, it is advisable to map its concentration averaging over a long period of time (month, season, year).
Formaldehyde contamination
Formaldehyde is an extremely toxic and carcinogenic compound. Natural sources of formaldehyde release into the atmosphere include forest fires, volcanic eruptions, animal activity, and so on. The main anthropogenic sources of emissions of this compound are pulp and paper mills, motor transport, thermal power plants, and chemical enterprises. Formaldehyde is often formed in the atmosphere from other hydrocarbons, such as methane.
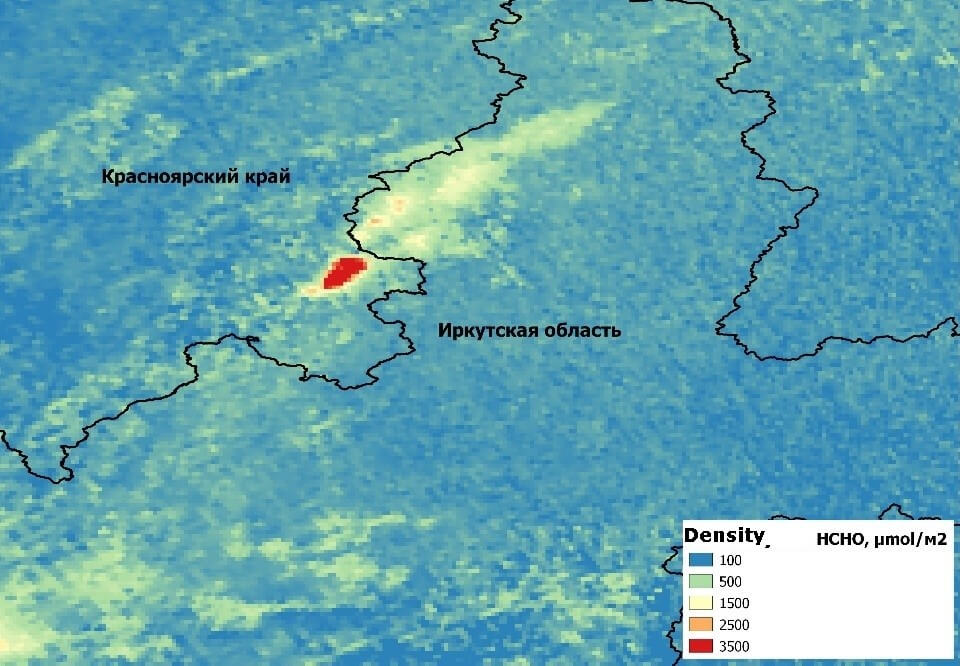
Figure 8 shows an example of an increase in the concentration of formaldehyde in the troposphere caused by forest fires on the border of the Krasnoyarsk territory and the Irkutsk region. Because of the fires, the background HCHO content is exceeded by 10-20 times.
Ozone pollution
There are stratospheric and tropospheric ozone. Ozone in the stratosphere (a peak at an altitude of 20-25 km) is necessary to support life on Earth, since it absorbs up to 99% of the sun's dangerous ultraviolet radiation. However, ozone in the troposphere is a greenhouse gas and a very dangerous pollutant (due to its strong oxidizing properties). In the lower atmosphere, the strong increase in O3 content in recent years is due to anthropogenic influence. Precursors of ozone in the troposphere are methane and nitrogen oxides, which are produced in large quantities as a result of human activity.
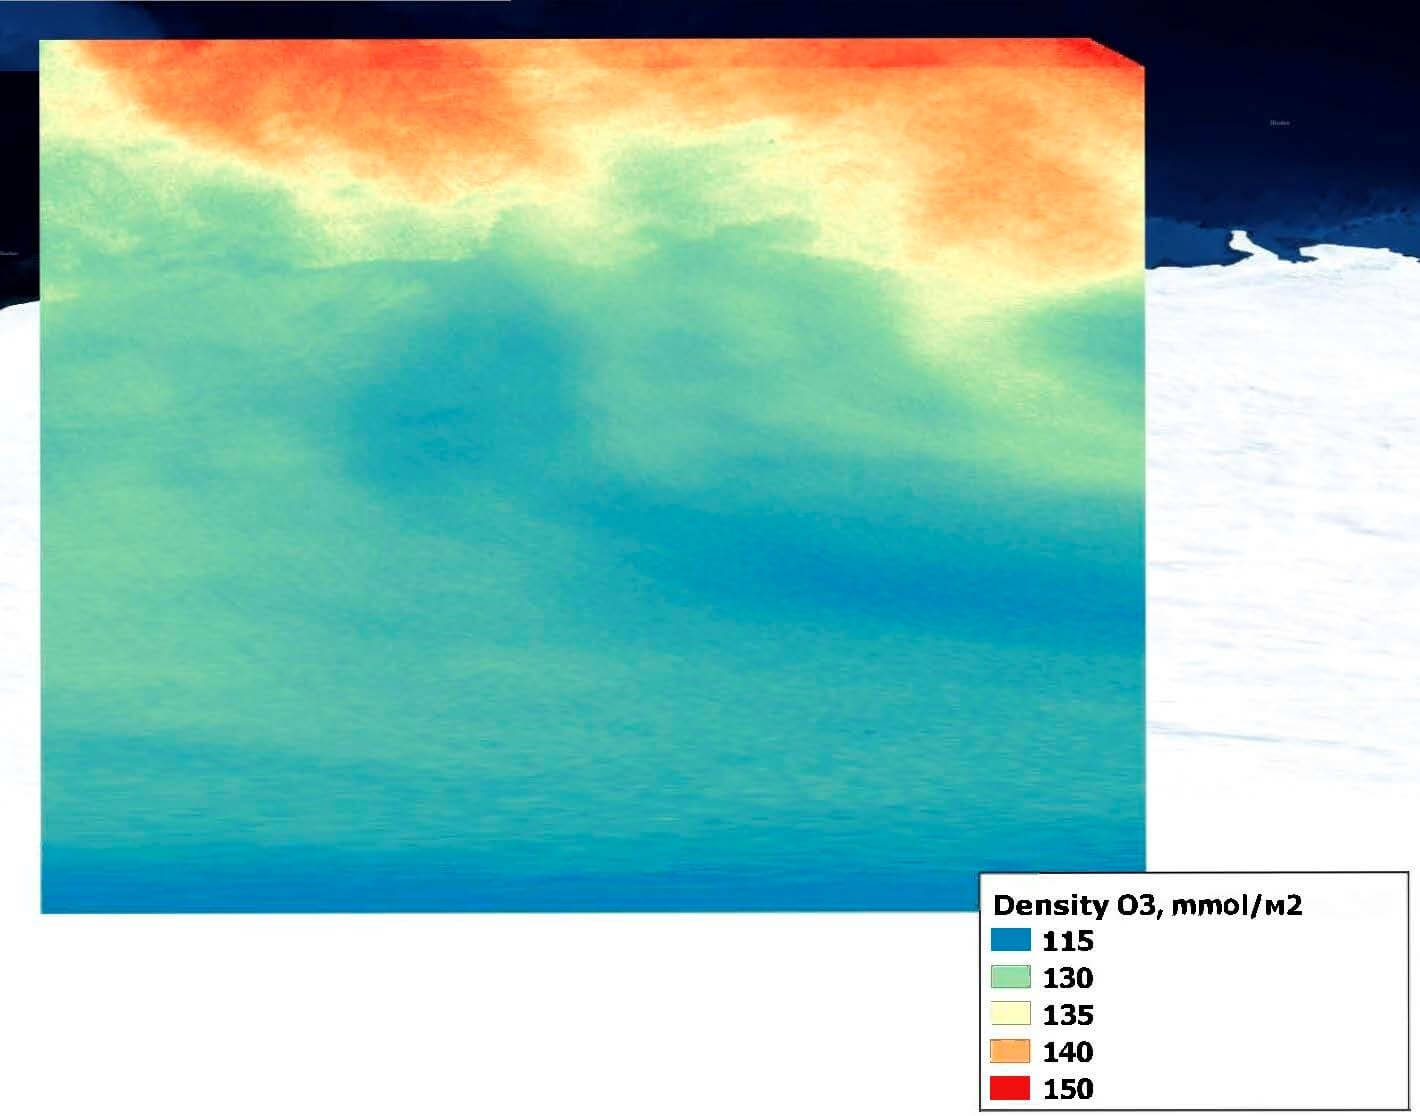
Figure 9 shows the distribution of ozone concentration in the Antarctic region in March 2019. There is a significant decrease in the ozone content closer to the South Pole ― this is the so-called ozone hole.
Conclusions
Sentinel-5P is excellent for monitoring the spread of major pollutants in the atmosphere, but the low spatial resolution does not allow for large-scale research. Data from the Sentinel-5P satellite is optimal for conducting research at a scale of 1: 1,000,000 or smaller. It is advisable to perform daily monitoring, as well as time averaging ― this will reduce the impact of atmospheric conditions on measurements. It is possible to monitor major emergencies. It is possible to build an animation with a time step of 1 day to study the dynamics of pollution propagation.
Sat-Sun: Non-working days