Sat-Sun: Non-working days
Clean water is essential for sustaining human life and is paramount to human health. Throughout history, people have built cities and states in close proximity to water sources. However, weak economies and lack of infrastructure lead to millions of deaths, mainly children, due to diseases linked to inadequate water supply, sanitation, and hygiene. More than 40% of the world's population suffers from water scarcity, a figure that continues to rise. According to experts, 783 million people lack access to clean water, and over 1.7 billion people residing in river basins need additional freshwater sources.
There are many reasons for the decline in freshwater availability: worsening climatic conditions, pollution of water bodies, unsustainable natural resource use, and others. The shortage of clean water is particularly acute in tropical climates and densely populated countries.
The water level in Poyang Lake, the largest freshwater lake in China, has significantly decreased recently due to diverting the flow of the Yangtze River through the Three Gorges Dam. The livelihoods of local residents depend directly on the lake, as the reduction in water level affects vegetation and the local economy. Monitoring the decline of major water bodies is challenging without the use of Earth remote sensing (ERS) data, due to high labor costs and time loss.
To calculate changes in the lake surface area, we compared images taken by Landsat satellites between 1984 and 2014. The Landsat satellite program, operational for over 40 years, is vital for monitoring changes affecting our planet.
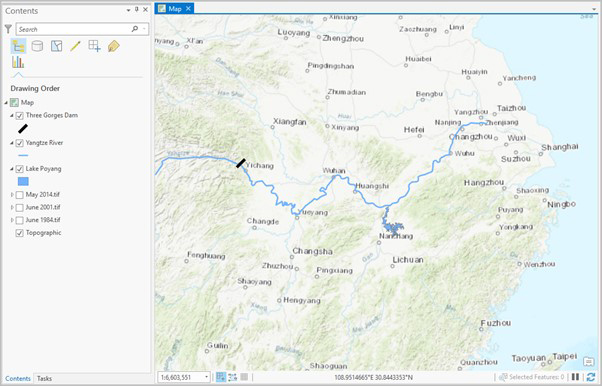
Figure 1. Project in ArcGIS displaying the eastern part of central China, Yangtze River, and Poyang Lake.
Comparison of Landsat Multitemporal Images
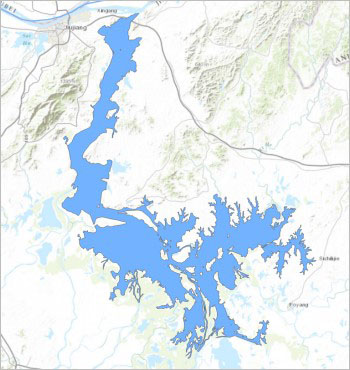 Figure 2. Image of Poyang Lake.
Poyang Lake is quite long and narrow, extending south from the Yangtze River. Given its shape, even a slight decrease in water level can lead to fragmentation of the water body. Additionally, the economies of several coastal cities depend on fishing and transportation across the lake. Nationally, this lake is the largest source of freshwater in China. Drying up of the lake could lead to catastrophic ecological and economic consequences.
For comparison, three Landsat images were selected during peak rainy seasons in 1984, 2001, and 2014.
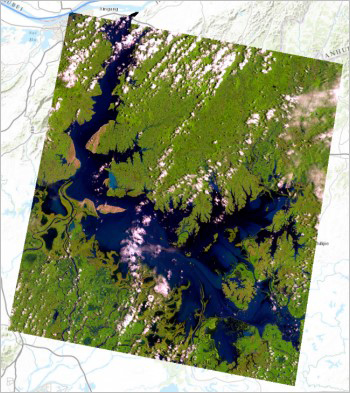
Figure 3 Landsat satellite image for 1984.
The image shows the lake in June 1984, obtained from Landsat 5 satellite. The Landsat satellite program is a joint initiative of two US government agencies: the US Geological Survey and the National Aeronautics and Space Administration.
The image vividly depicts the contrast between the blue lake and the growing greenery around it. These colors may appear natural, but they are actually a combination of electromagnetic spectra invisible to the human eye.
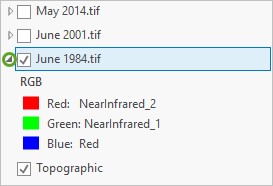
Figure 4. Legend of the ArcGIS project.
The electromagnetic spectrum colors, also known as channels, are listed under the layer. The image is usually created by combining three channels, namely RGB (red, green, blue). This image uses Near Infrared 2 for red, Near Infrared 1 for green, and Red for blue. Channel designations for different Landsat satellites are listed in the following table:
Table 1. Comparison of channels for different Landsat satellites
|
Channel |
Landsat 5 |
Landsat 7 |
Landsat 8 |
|
1 |
Blue |
Blue |
Coastal aerosol |
|
2 |
Green |
Green |
Blue |
|
3 |
Red |
Red |
Green |
|
4 |
Near Infrared 1 |
Near Infrared 1 |
Red |
|
5 |
Near Infrared 2 |
Far Infrared |
Near Infrared |
|
6 |
Thermal |
Thermal |
Far Infrared 1 |
|
7 |
Mid Infrared |
Far Infrared 2 |
Far Infrared 2 |
|
8 |
Panchromatic |
Panchromatic |
|
|
9 |
Cirrus |
||
|
10 |
Thermal Infrared 1 |
||
|
11 |
Thermal Infrared 2 |
All three images in the project use combinations of channels that highlight vegetation and make boundaries between the lake and surrounding areas clearer and more distinct. Now, let's compare the 1984 image with more recent images to see how the lake has changed.
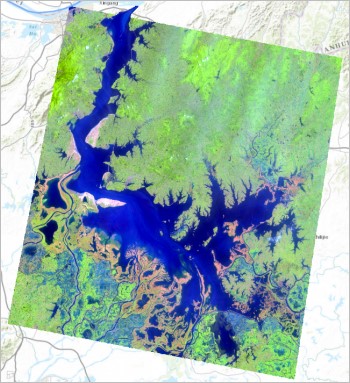
Figure 5. Landsat image for 2001
This image was taken by the Landsat 7 satellite, not Landsat 5, so the colors are different. Without a close comparison, it's difficult to see what exactly has changed. Therefore, we will use the "Hide" tool to compare the two images.
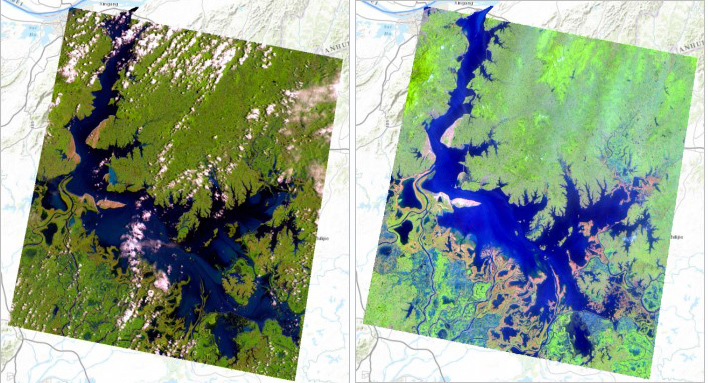
Fig.6 Comparison of Landsat satellite images for 1984 (left) and 2001 (right)
By moving the slider, you can see that most changes occurred on the southern and eastern edges of the lake. The areas where the lake receded are mostly orange because there is no vegetation there. Overall, in 2001, the lake visually occupied a smaller area than in 1984. Both images were taken before the opening of the "Three Gorges Dam" in 2008, so the reasons for the lake's water level decrease may be droughts or other meteorological phenomena.
Now let's compare images from 2001 and 2014.
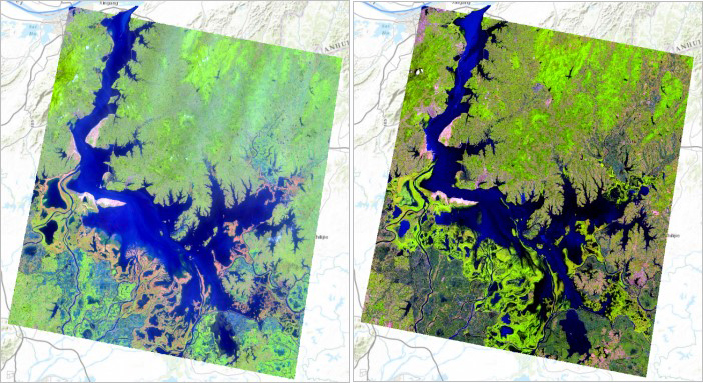
Fig.7 Comparison of Landsat satellite images for 2001 (left) and 2014 (right)
The image for 2014 was obtained from the Landsat 8 spacecraft. Orange areas, indicating land exposed after the lake receded, in the 2001 image have become light green due to vegetation growth, indicating long-term changes in water level.
When comparing images from 2001 and 2014, it is evident that the lake lost additional territory, mainly in the southern and western parts. It is obvious that the lake decreased during the period between 1984 and 2014 (at least during the rainy season, when all three images were taken), although the exact extent is unknown.
Classification of soil and vegetation cover
In order to quantitatively assess changes in the lake's surface area over time, it is necessary to classify the soil and vegetation cover in each image. Each individual pixel or cell in the image has a value in each channel. In Landsat images, these values correspond to colors. As seen in the dynamic image of Lake Po Yang Hu, there are many possible color values for various shades. By classifying the image, similar values are grouped together into one value that reflects the location of a spatial object or class of objects, such as water, plants, or urban development. These classes can be used to find areas of interest (in this case, Lake Po Yang Hu).
We will use a specific type of classification called "Unsupervised classification," in which the program uses statistical analysis to determine which values to group together into classes. We only need to specify how many classes there will be. To perform this procedure, we will use "Unsupervised Iso Cluster Classification."
In ArcGIS, there is a built-in tool called "Unsupervised Iso Cluster Classification." This tool runs unsupervised classification on an image layer, i.e., a selected raster. It uses the iso-cluster algorithm to determine the characteristics of natural cell groupings and creates an output layer based on the number of classes you want. We will run the tool three times, once for each image. After the tool completes, an output layer will be added to the map.
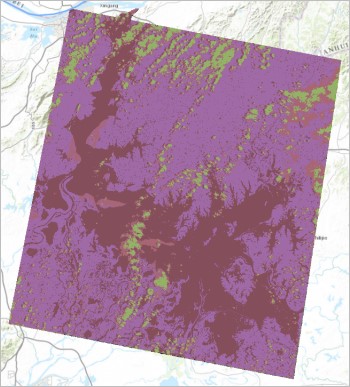
Fig.8 Result of Unsupervised Iso Cluster Classification
The new layer resembles the original June 1984 image but with changed colors, appearing more pixelated. All image layers consist of grids of pixels, also known as cells, but in the original image, pixels had thousands of different colors. The "Unsupervised Iso Cluster Classification" tool took all pixels from the original image and sorted them into four classes based on values, with each class having its color (output colors are generated randomly). All water bodies were classified into one value, while others represent vegetation or cloud cover.
In layer settings, we will change the color of water bodies to blue and the others to colorless. As a result, only water bodies will remain visible in the layer. We will perform the same procedure for the remaining two images and set their original colors.
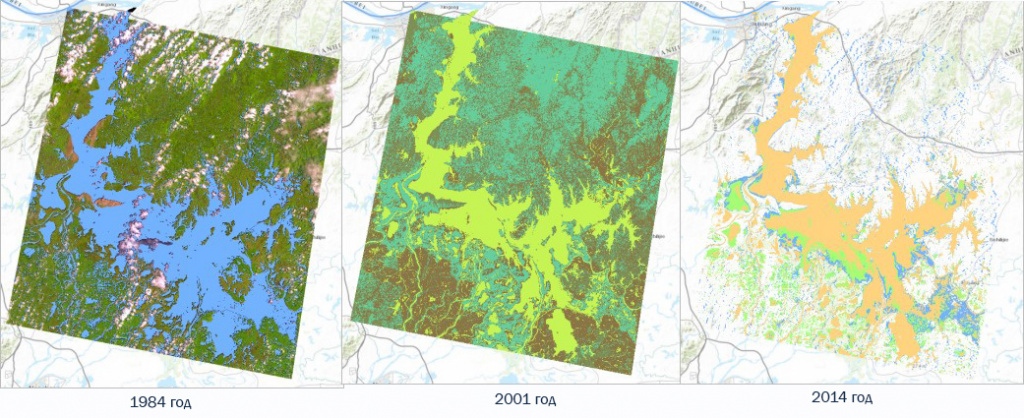
Fig.9 Comparison of classification result and image
Cleaning up the result
To ensure the accuracy of the performed classification comparison, small pixels that are irrelevant to Lake Poyang should be deleted. Some of them belong to small ponds and other water bodies, and some were the result of incorrect classification. In any case, they should not be counted when calculating the area of Lake Poyang. For this, we will use the geoprocessing tool called "Majority Filter". This tool is used for generalizing data. It replaces the values of raster layer cells, based on the majority values of adjacent neighboring cells. If the value in a cell is 1, but in three adjacent cells the value is 2, the tool will replace the value 1 and bring it into line with neighboring values.Generalization removed quite a few individual pixels, but some still remain. Additional generalization can be carried out, but there is a chance of deleting the required data (in this case, values representing Lake Poyang itself). To correct some remaining problems, we will use "boundary smoothing". This tool smooths the boundary between classes (or zones) by stretching and shrinking the boundary and then returning to the original sizes. Instead of values of individual pixels, the values of surrounding pixels are substituted. As a result, most small separate pixels were generalized.
Determining changes in area
After clearing the cleaned classified images and removing many small errors and pixel groupings, we can start calculating the changes in Lake Poyang's area. During the "Unsupervised Classification" of the images into four separate values, the number of pixels in each value was automatically recorded in the attribute table. Based on the number of pixels, we can determine the area of Lake Poyang in hectares for each image, starting from 1984.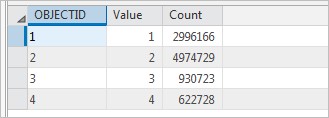
Fig. 10 Attribute table of the layer
Value 1 in the attribute table corresponds to water bodies and is close to 3 million. To convert from the number of pixels to units of real-world measurements, we need to know the pixel size of the original image in meters. The initial pixel size of the 1984 Landsat image is 30*30 m (900 square meters or 0.09 hectares). Therefore, the size of Lake Poyang in 1984 was nearly 270,000 hectares. Performing the same procedure for the remaining images, we get:
The area of the lake in 2001 was about 250,000 hectares, and by 2014 it had decreased to almost 200,000 hectares. From 1984 to 2014, the loss of Lake Poyang's area was about 70,000 hectares, approximately 2,300 hectares per year. Furthermore, the rate of reduction after 2001 increased. If over 17 years from 1984 to 2001 about 20,000 hectares were lost (1,200 hectares per year), then from 2001 to 2014 the lake decreased by approximately 50,000 hectares (3,900 hectares per year).
