of geospatial solutions
Sat-Sun: Non-working days
REMOTE SENSING PRINCIPLE
Laser scanning data in the remote sensing area over significant spaces (not spectroscopy or other laser applications) are obtained using sensors (instruments, detectors) commonly referred to as lidars in practice (strictly speaking, not entirely accurate, but the remote sensing classifier accepts this name). Laser scanning is a term sometimes used as a synonym for LIDAR, but more accurately describing the process of scanning objects or the Earth's surface using such technology that performs multiple measurements.
Laser scanning is a method of measuring distance using LIDAR, a device that uses lasers to determine distances to objects.
Laser scanning is a high-precision and high-speed measurement of distance and angles from the scanner to the object; three-dimensional models are formed based on the measurements (Fig.1).
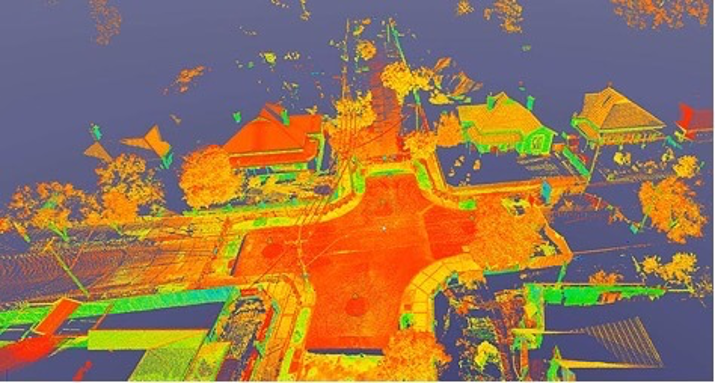
Fig.1
Lidar (Light Identification, Detection, and Ranging) is a technology for obtaining and processing remote sensing information using active optical systems (lasers), including phenomena of light reflection from the Earth's surface with the conduct of high-precision X, Y, Z coordinate measurements. Lidar for remote sensing was initially used in airborne laser scanning (ALS) applications and is an economically excellent alternative to traditional photogrammetric data processing.
Laser scanning is thus a type of active sensing. The laser sensor (lidar) operating in pulse mode conducts discrete scanning of the Earth's surface and objects on it, registering the direction of the laser beam and the time it takes for the beam to pass. Knowing the angles of rotation and relative displacements between the components of the described system, it is possible to unambiguously determine the absolute coordinates of each point of laser reflection in space (Fig.2).
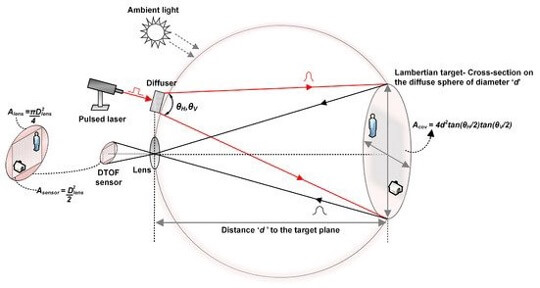
Fig.2
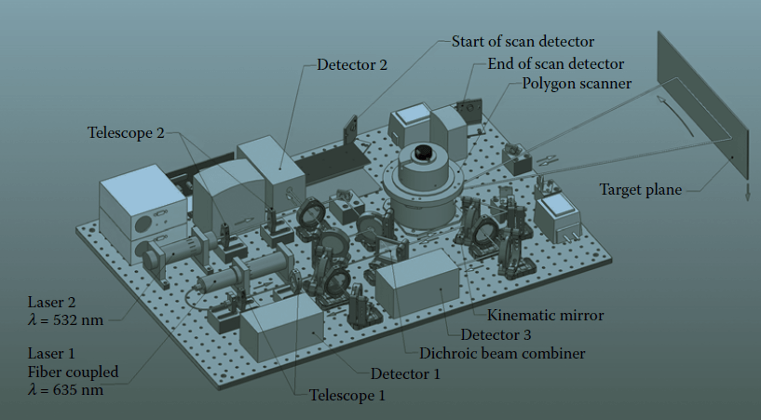
Fig.3 Laser (lidar) scanner device
Lidar scanning data consists of datasets containing point clouds that can be managed, displayed, analyzed, and collaboratively used with GIS.
Laser scanning and data creation always raise questions of cost; whether the resources for representation are vast and not always affordable for the client, the processing technology is complex, there is significant redundancy that hinders presenting a product that the client can understand. However, it is the most accurate method of creating remote sensing products.
LASER SCANNING PLATFORM
The primary hardware platform for a lidar setup includes a transportation vehicle or device (aircraft, UAV, helicopter, tripod), laser scanning system, GPS (Global Positioning System), and INS (Inertial Navigation System). The INS measures the pitch, roll, and yaw of the system.
The remote sensing laser scanning platform corresponds to remote sensing carriers, currently without satellite devices, namely:
· Ground-based laser scanning (lidar devices on a tripod)
· Mobile laser scanning (vehicles with lidar devices on the roof or on special cranes).
· Airborne laser scanning (ALS - aviation and UAVs).
During ground-based laser scanning, for example, in geodetic surveying, a surveyor moves on the ground, sets up the scanner on a tripod, and points it at objects, conducting 3D scanning. The scanner is positioned with consideration for the field of view, i.e., it is selected to cover more details and elements of objects. Based on this, scanning can be conducted anywhere a tripod can be set up. The efficiency of ground-based laser scanning depends on the number of elements in the object. When there are few elements on the object, i.e., low density, a productivity of 10 hectares to 20 hectares per day can be assumed when using a single scanner. For example, in industrial facilities with high density, even 1 hectare can be considered an ideal result. In ground-based laser scanning, it is correct to measure by the quantity of scanned data, not the area.
The second type of laser scanning is mobile laser scanning (MLS). This type of scanning operates in the decimeter range, with normal accuracy ranging from 2-5 decimeters. The laser scanner is mounted on some form of transportation, such as a car (Fig.4), scanning only what lies along the transport route.
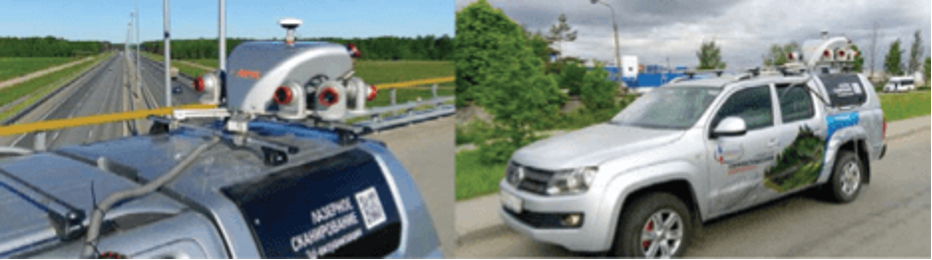
Fig.4
For example, when scanning from a car on a road in the city, only building facades and part of the facade are captured in the footage, as well as what is located in front of the facade, with everything else remaining in the shadows. Productivity depends on road congestion, i.e., the number of interferences on the roads (oncoming vehicles, traffic jams, obstacles on the road). On fortunate days, thousands of hectares can be scanned, but the results should be correctly evaluated in lane kilometers of roads.
Airborne laser scanning (ALS) involves high-frequency laser beam irradiation of the Earth's surface, including above-ground objects, from any airborne apparatus, obtaining the coordinates of laser points based on the time difference from emission to reception of the reflected beam. ALS serves as the basis for creating three-dimensional terrain models.
ALS is used for high-precision mapping of linear and area objects in scales of 1:500 to 1:5000 from airborne platforms (aircraft, helicopters, UAVs). Accuracy is within 5-8 cm, drawing detail is about 20-50 cm, and productivity reaches 800 linear kilometers of surveys per day (survey strip width up to 1000-1500 m).
This type of scanning already operates in the meter range, i.e., its normal accuracy is within 0.5-1.2 meters. In good weather conditions, with high-quality equipment, accuracy in the range of 10-40 cm can be achieved. The accuracy of mobile and ground-based scanning far exceeds ALS, but its advantages are not in accuracy. The advantage lies in the fact that everything is visible from the sky, i.e., the scan is not limited to where the scanner is placed, and shadow zones will only appear near elevated objects, such as a dense tree canopy or building roofs. Another advantage of this scanning is that tens of thousands of hectares can be covered in a single flight.
There are drawbacks related to low detail when scanning vertical planes (e.g., walls).
The unique capabilities of this scanning technology allow for:
– True surface relief, 3D terrain models (Fig. 1);
– Topographic plans and maps in areas where there are no ground landmarks (such as tundra, fully snow-covered territories, deserts, sandy beaches, etc.).
Mobile laser scanning is a modern, fast, and technological method of obtaining spatial data in the form of a 3D terrain model with very high accuracy. Mobile laser scanning is best suited for measuring linear and elongated objects, primarily, roads. The result of scanning is a very detailed (dense) set (cloud) of three-dimensional surface points – hundreds and thousands of measurements per 1 square meter.
LIDAR SENSORS FOR AIRBORNE LASER SCANNING (UAV)
Lidar is an active optical sensor (Fig.5) that emits laser beams towards the target while the ALS platform is in motion along specific survey routes.
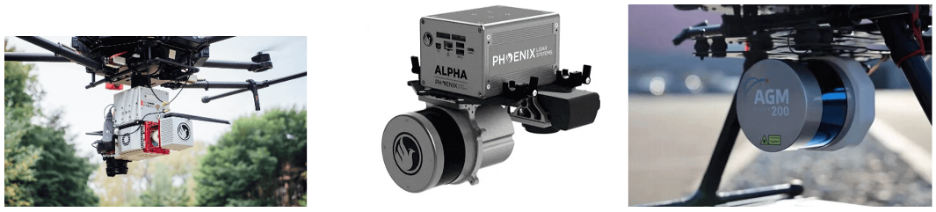
Fig.5
The reflection of the laser from the object is captured and analyzed by the sensor. Receivers record the precise time elapsed from the moment the laser pulse is emitted by the system to the moment it returns, in order to calculate the distance between the sensor and the target. Along with information on internal and external positioning (GPS and INS), these distances are converted into three-dimensional points representing the surface of laser pulse reflections. The point data undergoes further processing after collection, taking into account the laser's operating time range, scanning angle, GPS coordinates, and internal positioning information (INS), allowing for precise x, y, z coordinates to be obtained.
PHYSICAL PROCESSES OF REMOTE SENSING
There are different characteristics depending on the intended use of laser scanners. Important distinctions include:
- Range;
- Wavelength;
- Accuracy;
- Pulse frequency;
- Ability to distinguish single and multiple returns up to the full
shape of the reflected laser signal.
The laser emits coherent light with a very small divergence angle, allowing the light to be focused over a long distance. Depending on the divergence angle and the distance to the emitting laser, the laser beam will have a certain thickness. The wavelength of the emitted laser beam is usually in the bright green region of the spectrum (~ 532 nm) or in the near-infrared region (~ 1064 nm) of the energy spectrum.
Reflections of Lidar Laser Pulses
Laser pulses emitted by Lidar are reflected from both the Earth's surface and objects above the ground, such as vegetation, buildings, bridges, etc. A single laser pulse can reflect and return to the sensor once or multiple times. Any laser pulse undergoes multiple reflections as it moves towards the Earth's surface, splitting into as many parts as the number of surfaces it reflects off.
The first reflected signal is the most indicative and corresponds to the highest point of the landscape, such as the top of a tree or a building's roof. The first reflected signal can also correspond to the Earth's surface. In this case, only one reflection will be captured by Lidar. Multiple reflected signals are used to obtain the heights of several objects in the path of the laser pulse. Reflected signals from the middle of the "spectrum" usually correspond to vegetation, and the last reflected signals are used for models of the actual ground surface. However, the last reflection will not always correspond to the ground. For example, consider a case where the pulse hits a thick branch and does not reach the Earth's surface. In this case, the last reflection occurred not from the ground but from the branch (Fig.6).
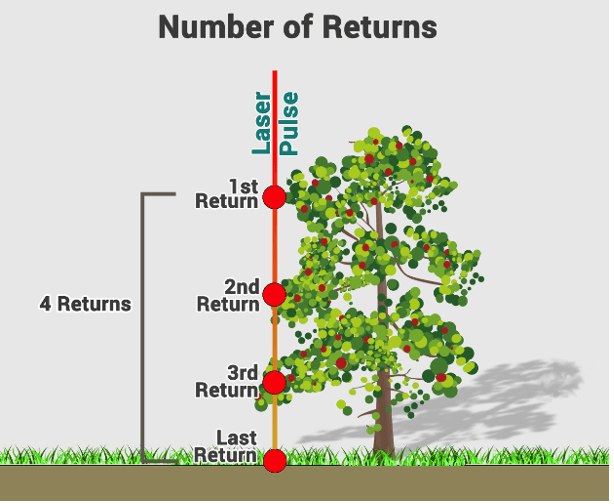
Fig.6
MAIN PRACTICAL PROCESSES OF LASER SCANNING PROCESSING
There is a considerable amount of software available for laser scanning processing, for example, Riegl software - a suite of software products for performing the complete cycle of work with Riegl laser scanners. Separate programs have been developed for working with ground and mobile laser scanners, allowing for the optimal organization of the technological process of obtaining field laser scanning data and subsequent processing of results. ORBIT software is a comprehensive suite for processing laser scanning and aerial photography data. Orbit GT solutions for processing mobile scanning data, UAV surveys, and digital aerial photography for 3D modeling.
The most well-known software includes Bentley MicroStation with MDL applications TerraScan, TerraModeler, TerraMatch, TerraPhoto.
Software from all traditional and well-known laser scanner manufacturers.
Primarily, data processing software for aerial laser scanning and remote sensing allows addressing the following tasks:
· Creating a topographic base for design and survey works,
· Geometric measurements of engineering structures,
· Updating topographic maps,
· Building digital terrain models (raster model, TIN, GRID),
· Constructing mathematical models using the intensity of laser pulse reflections,
· Deciphering terrain objects,
· Creating orthophotoplans based on classified ground points.
In one way or another, laser scanning data is linked to GIS representation and contains common descriptions of Lidar pulse reflections and point clouds:
Lidar Point Attributes
In addition to positional values x, y, and z, the system also retains additional information. For each laser pulse, the following attributes are recorded and saved: intensity, return number, number of returned signals, point classification values, flight line edge points, RGB values, GPS time, scanning angle, and direction. The following table describes the attributes that can be obtained for each point.
|
Lidar Attribute |
Description |
|
Intensity |
The strength of the reflection of the laser pulse corresponding to the Lidar point. |
|
Return Number |
The number of times the laser pulse was reflected. |
|
Number of Returns |
The total number of returns for a given laser pulse. |
|
Point Classification |
Classification value assigned to the point based on its characteristics. |
|
RGB Values |
Color information assigned to the point. |
|
GPS Time |
Time of the GPS fix corresponding to the point. |
|
Scan Angle |
The angle at which the Lidar sensor was scanning. |
|
Scan Direction |
Direction of the Lidar sensor's scanning motion. |
Number of Returns
The emitted laser pulse can create up to five reflected signals depending on the objects from which it reflects and the capabilities of the laser scanner. The first returned pulse will be marked as return number one, the second as number two, and so on.
Number of Returns
The number of returns is the total number of returns for a given laser pulse. For example, a laser data point may be the second return out of five returns.
Point Classification
Each processed Lidar point may contain a classification value that determines the type of object from which the laser pulse is reflected. Lidar points can be classified into several categories, including ground surface, upper boundary of a flat forest, and water surface. Classes are assigned integer code values stored in LAS files.
Flight Line Edge
Points will be marked with a value of 0 or 1. Points located on the flight line will receive a value of 1, while others will receive a value of 0.
RGB
Lidar data can be assigned an RGB attribute. This attribute information is often taken from images obtained simultaneously with laser scanning.
GPS Time
GPS time corresponding to the moment of pulse emission. The time value corresponds to the number of seconds elapsed in the week.
Scan Angle
Scan angle is a value in degrees ranging from -90 to +90. At 0 degrees, the laser pulse is emitted perpendicular and scanning is nadir. At a value of -90 degrees, the laser emits pulses to the left, and at +90 degrees, to the right of the aircraft in the direction of flight. Most laser scanning systems operate in the range of -30 to +30 degrees.
Scan Direction
Scan direction is the direction of motion of the scanning system mirror at the moment of emitting the laser signal. A value of 1 corresponds to the positive scanning direction, and 0 corresponds to the negative direction. A positive direction means that the scanner is moving from left to right in the direction of flight, and a negative direction means the opposite.
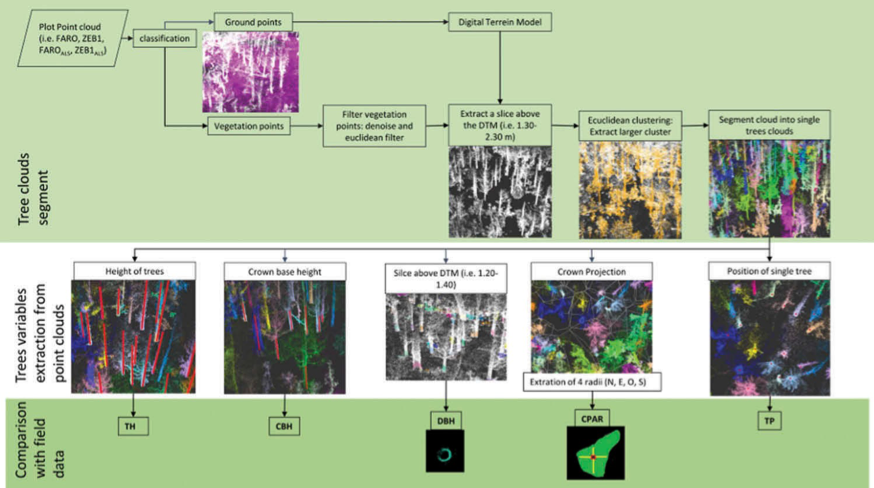
Figure 7. Example of point classification attributes highlighting forest as the object type in Lidar survey results
Lidar Data Storage
Initially, Lidar data is obtained exclusively in ASCII format. With the accumulation of large volumes of Lidar survey data, a binary format called LAS began to be used for work and turned into a standard format for organizing and distributing laser data. Now Lidar data in LAS format is quite common. LAS is the most suitable format as files in this format contain more information and, being binary, can be read more efficiently during import.
LAS Dataset or LAS File
Mosaic Dataset
Point Cloud Scene Layer
Data Placement
File System
Geodatabase
Scene Layer Package
Relation to Original LAS Files
Points
Points
Caching
Size Limitation
Limited by disk space
Limited by acceptable geodatabase size
Limited by disk space
Surface Constraints
Supported
Not supported directly (supported if part of LAS dataset or terrain dataset)
Not supported
Lidar Input
LAS files, ZLAS files
LAS files, LAS datasets, and terrain datasets
LAS dataset
Lidar Types
Terrestrial and aerial Lidar
Aerial Lidar
Terrestrial and aerial Lidar
Display
Points, Triangulated Surface, Displayed in 2D and 3D
Raster
Points visible in 3D
Analysis
Tools working with point clouds or TIN data.
Use with tools like 3D Analyst.
Use with tools supporting raster data.
Use with Spatial Analyst tools and other tools designed for processing raster datasets.
Use with tools that support raster data.
Use with Spatial Analyst tools and other tools designed for processing raster datasets.
Not supported
Display
Sparse points.
Can adjust display by selecting different class types or data types.
Uses cache for faster display of data.
Can adjust display by selecting different class types or data types.
Can modify display using Layer Properties or Imagery Analysis window.
Sparse points.
Uses cache for faster display of data.
Can adjust display by selecting different class types or data types.
Editing Points
Can edit point classifications in LAS files.
Cannot edit points.
Cannot edit points.
Joining with Data
Supports LAS files, spatial object classes, and shapefiles.
Supports LAS files, LAS datasets, terrain datasets, and other raster formats.
Supports LAS datasets.
LAS or ZLAS Files - Lidar Data
Individual LAS or ZLAS files can be used in GIS, allowing you to quickly explore the LAS or ZLAS file without creating a LAS dataset. This functionality enables you to explore the data before the file is used as input in another dataset. LAS and ZLAS files behave similarly to LAS datasets in GIS and can be presented to the user.
Working with LAS and ZLAS files can be done in the following ways:
Display in 2D or 3D as points using their elevations or through various point display methods based on a set of lidar filters applied to the point cloud:
· Display as a Triangulated Irregular Network (TIN) model.
· Display using elevation, slope, aspect, or contours, based on specified lidar filters.
· Use as input for analysis tools, such as 3D Analyst.
· Edit point classifications.
· Use lidar as a LAS dataset.
LAS datasets provide quick access to large volumes of lidar and surface data without the need for data transformation and import. You can work with thousands of LAS files covering an entire administrative area or with a few LAS files for a specific study area. This allows you to quickly review LAS or ZLAS files, providing complete statistics and coverage of the area covered by the LAS or ZLAS files.
Working with LAS datasets involves the following:
· Display in 2D or 3D as points using elevation or point attribute-based rendering based on specific lidar filters applied to the point cloud.
· Display as a Triangulated Irregular Network (TIN) model.
· Display using elevation, slope, aspect, or contours, based on specified lidar filters.
· Use as input for analysis tools, such as 3D Analyst.
· Edit point classifications.
· Edit LAS files.
· LAS datasets can be edited to update the classification of the source LAS files or surface model boundary objects. Editing point classification in ZLAS files is not currently supported.
· Use lidar in a mosaic dataset.
· When you add your lidar data to a mosaic dataset, it will be used and displayed in raster form. This allows you to do the following:
· Use tools such as Visibility, Contour, and Profile.
· Estimate volumes.
· Use as Digital Terrain Model (DTM).
· Use for orthorectifying images.
· Use in applications that support rasters but not LAS files and datasets.
Mosaic datasets are similar to LAS datasets, as they also contain only references to the source data and do not move all points from one format to another. They are quickly created, have a small size, and can be easily updated with additional LAS files. Alternatively, you can convert LAS files or datasets to a raster dataset.
You also have the option to use a mosaic dataset to catalog all your lidar data.
Lidar data can also be represented using point cloud scene layers.
Point cloud scene layers allow you to quickly display large volumes of point cloud data with configured symbols and filters. They are optimized for displaying and publishing various types of sensor data, including lidar.
Terrain Datasets
Terrain datasets are surfaces with variable resolution based on measurements stored as spatial objects in a geodatabase. They are typically created from lidar, sonar, and photogrammetric sources. Terrain datasets are associated with a geodatabase, with object classes used to create them included in object datasets.
Terrain datasets include participating object classes and rules.
Common spatial object classes that function as data sources for terrain include:
· Multi-point spatial object classes 3D point clouds created from lidar or sonar data sources.
· 3D point and line spatial object classes created on photogrammetric workstations using stereo imagery.
· Study area boundaries used to determine the terrain dataset boundaries.
Terrain dataset rules control how objects are used to define the surface. For example, a spatial object class containing the edge lines of a road might participate in a rule that specifies its objects are used as sharp bend lines. This provides the desired effect of creating linear non-uniformities in the surface.
Rules also specify how a spatial object class behaves at different scales. Edge of sidewalk objects might be necessary to represent only in medium- and large-scale surfaces. Rules can be used to exclude them from consideration at small scales, improving processing speed.
The Terrain dataset in the geodatabase refers to the original spatial object classes. It effectively stores the surface not as a raster or TIN but organizes data for fast retrieval and generates the TIN surface "on the fly." This organization includes creating "Terrain pyramids," which are used to quickly locate only the necessary data to create a surface with the appropriate Level of Detail (LOD) for a given Area of Interest (AOI) from the database. The corresponding pyramid level is used concerning the current display scale or can be changed by the user in analytical functions to use the selected resolution level to meet accuracy requirements (Fig. 8.9).
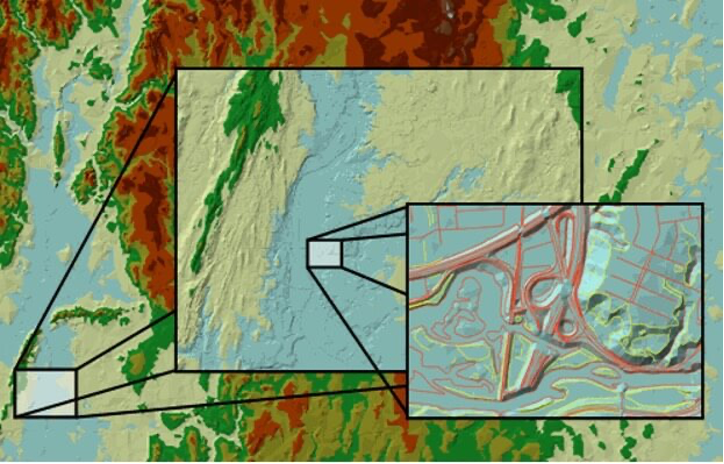
Fig.8
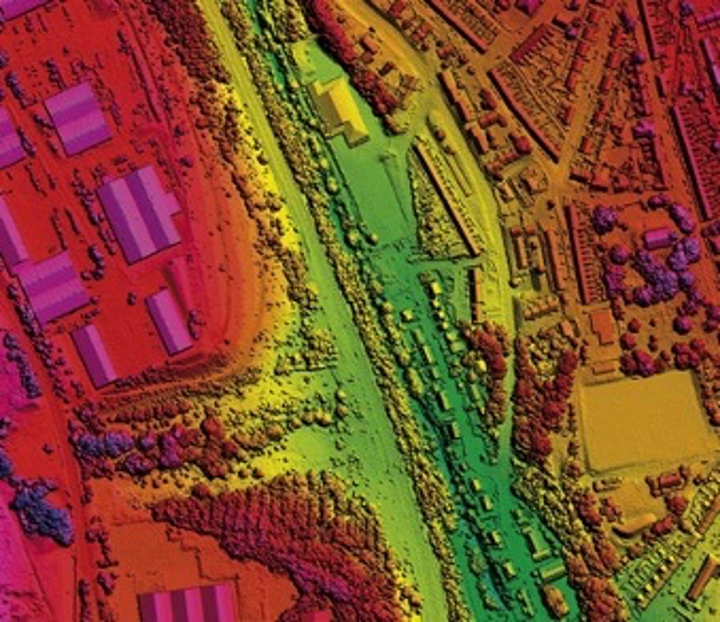
Fig.9
The Terrain dataset, along with its supported tools, unloads memory and serves vector-oriented measurements of surface dimensions in combination with the ability to use surfaces derived from these measurements. Geodatabase data processing functions are provided to load data from external sources into the geodatabase spatial object classes. Editing and geodatabase tools are applied to maintain and update data over an extended period. Interactive display and query tools provide the ability to explore and use Terrain surfaces. TIN networks – Triangulated Irregular Network (Fig. 10) and rasters (Fig. 11) can be extracted from Terrain based on the specified Area of Interest (AOI) and Level of Detail (LOD). The toolset provides comprehensive means of creating and using surfaces.
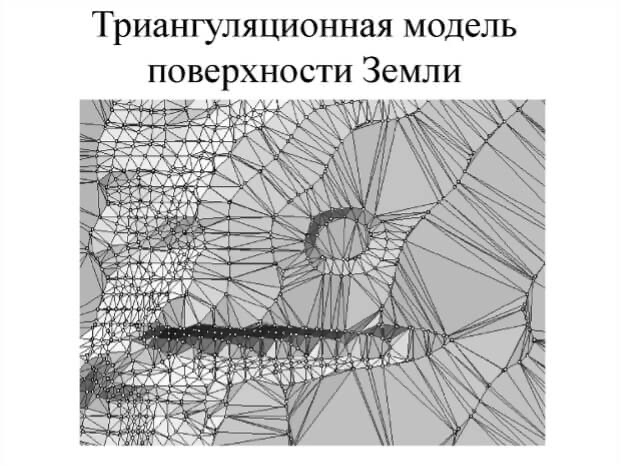
Fig.10
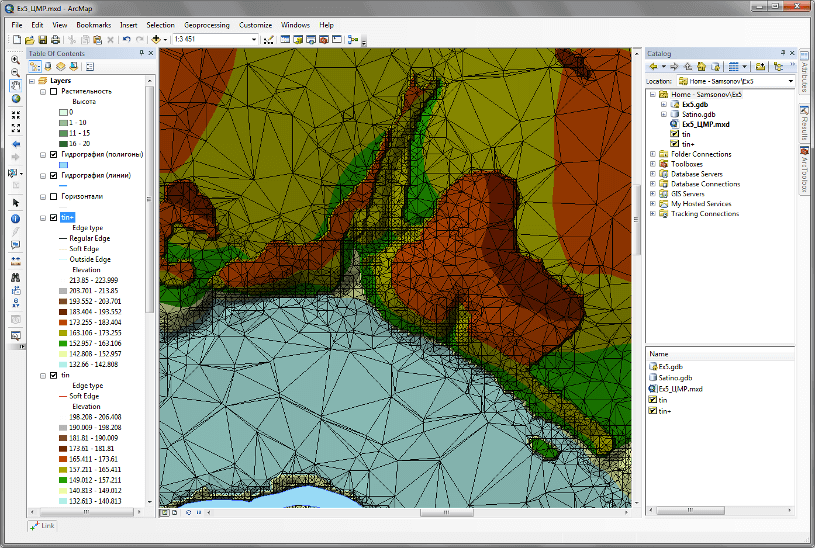
Fig.11
The Terrain dataset is supported as a 2D layer in GIS. Therefore, it can be used to represent elevations, slopes, exposure, and more, and it can also be draped onto surfaces in 3D. The Terrain dataset itself cannot be used as a surface source in 3D views in GIS. It is recommended to perform something similar to converting the Terrain dataset into a raster Digital Elevation Model (DEM) and use the resulting raster as the height source.
Modern laser scanning technologies involve obtaining a "point cloud" with very small accuracy, not exceeding 1 cm indoors and 2–3 cm outdoors. There is also the possibility of obtaining results with higher accuracy (up to 1–5 mm). The accuracies in this case are ±2 mm at 10 m and 25 m.
Distinctive features of laser scanning:
– Full implementation of the principle of remote sensing, which allows studying an object from a distance;
– High point density and accuracy on the surface of the object (Fig. 12);
– High scanning speed.
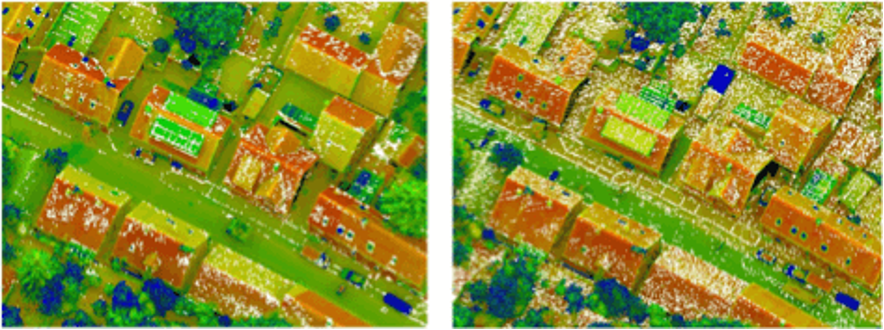
Fig.12
LASER SCANNING PRODUCTS BY INDUSTRY CLIENTS
In the process of global research, about 600 applications of laser scanning data and product creation based on this data have been identified. Today, there are numerous areas of laser scanning application in human economic sectors:
|
Field of Application |
Purpose |
|
Urban Planning |
Determination of precise building area, calculation of existing construction volume, m3/ha, inventory of existing construction, determination of building heights, determination of direct line of sight, determination of areas for densification, urban zoning, determination of areas for construction, calculation of population density |
|
Industrial and Infrastructure Construction |
Determination of areas for construction, design of industrial sites, road construction, design and construction of linear infrastructure objects, calculation of volumes of land works (volumes of extracted soil, etc.) |
|
Hydraulic and Hydrological Modeling |
Determination of the exact course of rivers and streams, identification of watershed boundaries, clarification of boundaries of flooded areas, digital modeling of water flow directions, determination of impermeable surfaces, modeling of rain floods and design of drainage systems, risk analysis, monitoring of dams and artificial water objects, design of water supply, drainage, and sewage systems |
|
Forestry, Fisheries, Nature Conservation |
Forest taxation, measurement of tree heights, calculation of wood volume, calculation of biomass, determination of true relief, analysis of urban greenery, parks, forest parks, determination of carbon sequestration, observation and analysis of habitat ranges |
|
Emergency Situations |
Calculation of the volume of flammable mass of forests during forest fires, analysis of relief for fire spread modeling, analysis of smoke and chemical plumes, risk analysis, digital modeling of forest and wall fires, floods, possible consequences of typhoons and hurricanes, cost reduction in the process of creating orthophotoplans, construction of digital models of landscape and relief, 3D modeling for economic development purposes |
|
Geology |
Determination of morphological characteristics, analysis of landslide risks, determination of damage from landslides, search for cracks, pits, faults, mapping and monitoring of volcanic activity, search and extraction of minerals, monitoring of mineral extraction |
|
Coastal Area Management |
Determination and monitoring of coastal inundated areas, ground settlement monitoring, shoreline erosion, monitoring of sea level rise, determination of coastal zone stability, beach area management, risk analysis, mapping of flooding during hurricanes and tsunamis, bathymetric studies of the coastal zone. |
Examples of laser scanning images of urban development (Fig.13), forest areas (Fig.14), and an oil refining plant (Fig.15).
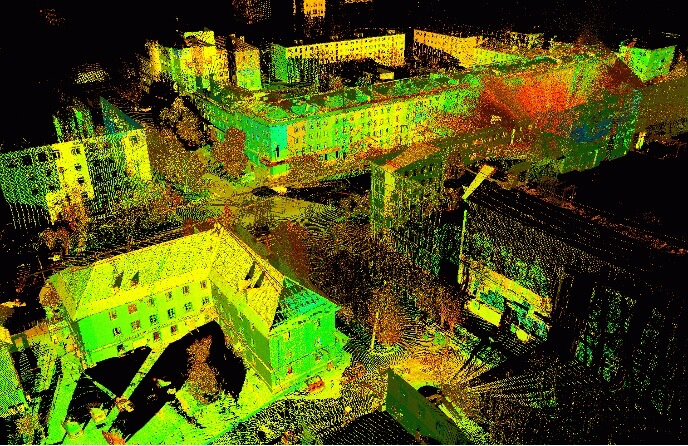
Fig.13
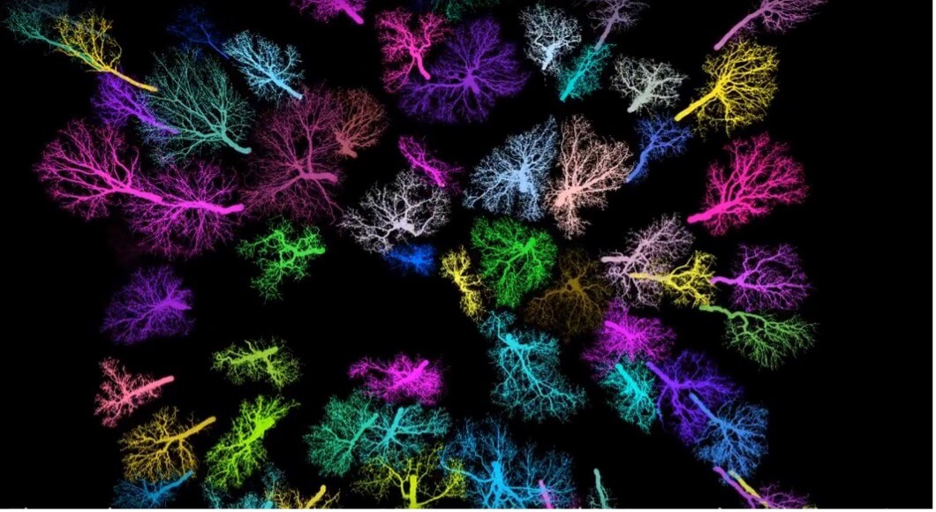
Fig.14
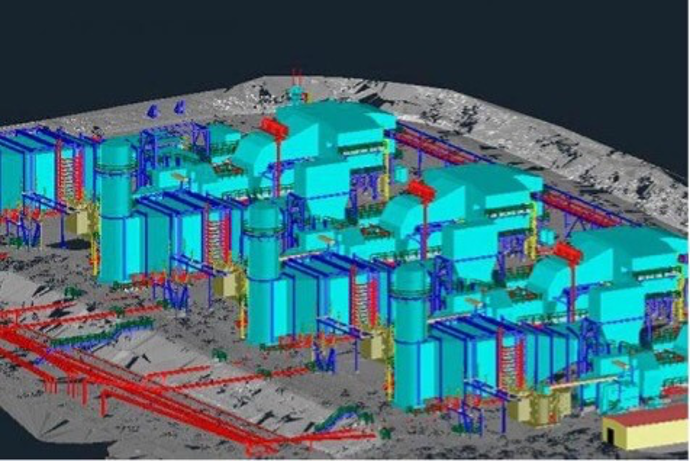
Fig.15
This is by no means an exhaustive list of laser scanning applications and products based on it.
CONCLUSION
Advantages of ALS compared to ground-based survey methods:
· Creation of a 3D model of objects and territory in real-time;
· High accuracy for area and extended territories, up to 1 cm in plan and height;
· Data collection in GIS;
· Surveying in desert, hard-to-reach, and hazardous areas.
The cost of data collection and object modeling using 3D laser scanning ALS is generally comparable to traditional survey methods, and in the case of large areas or long distances, it can be lower. ALS has an advantage over photogrammetric survey methods.
It provides higher measurement accuracy compared to photogrammetric methods.
Disadvantages of ALS:
· No tie to a unified coordinate system;
· Detailed scanning of complex objects does not allow achieving resolution at the millimeter level;
· Additional work for the installation of coordinate control points;
· The level of software (automatic processing) is relatively low.
Sat-Sun: Non-working days