Sat-Sun: Non-working days
Abstract
This article examines the application of lineament analysis in the context of geological and oil and gas research. The main advantages and capabilities of this method are discussed, as well as its role in understanding Earth's surface structures and their surrounding environment. The benefits of using remote sensing in lineament analysis are analyzed. Examples of lineament application in specific geological and oil and gas research scenarios are considered.
Introduction
Lineament analysis in remote sensing (RS) is a method aimed at detecting, classifying, and measuring linear features on the Earth's surface using satellite imagery. Linear features may include various geological elements such as mountain ranges, faults, boundaries of different geological formations, lava flows, riverbeds, and much more.
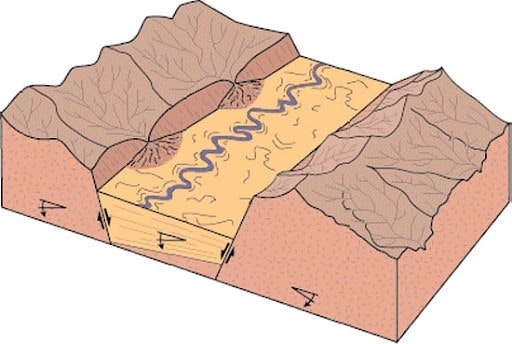
Applications and Roles of Lineament Analysis
-
Lineament analysis is used to locate mineral deposits, such as metals, oil, gas, and diamonds. Linear structures often indicate potential deposits.
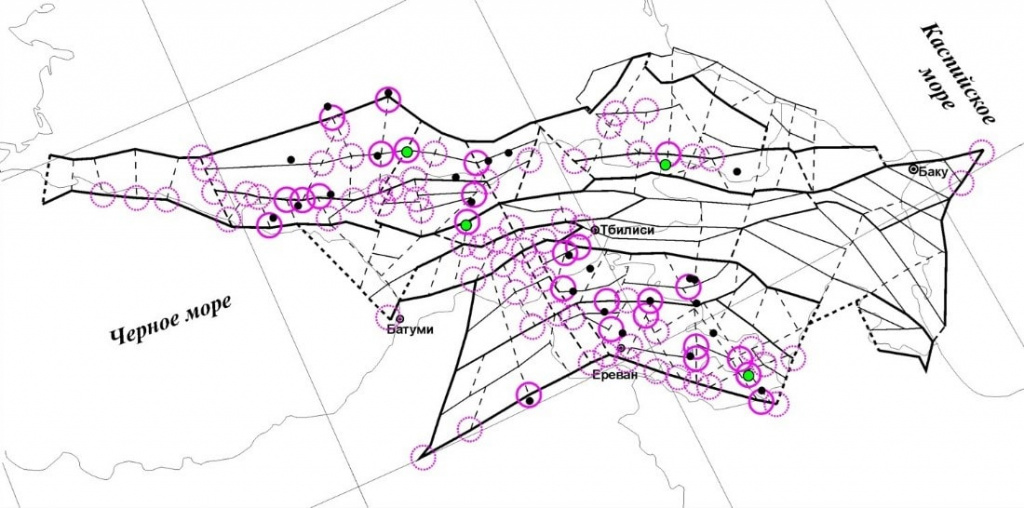
Fig. 2. Lineament-block structure of the Caucasus and identified ore-bearing nodes -
Lineament analysis is an essential component of GIS, enabling the creation of spatial models and maps, improving the analysis and understanding of geological and geophysical maps.
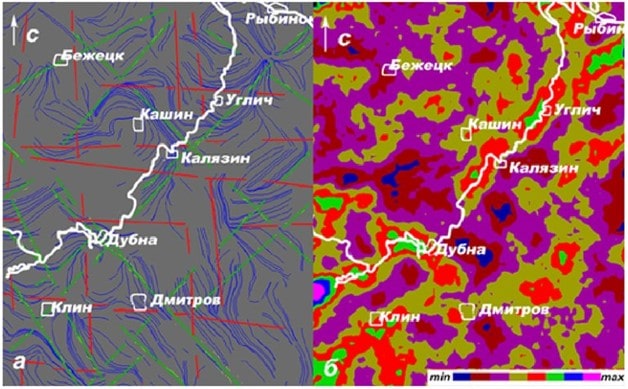
Fig. 3. Example of topographic map interpretation at a scale of 1:100,000: left – lineament diagram of orthogonal and diagonal orientations and elongation lines; right – lineament density diagram -
In environmental studies, lineament analysis can be used to study the impact of geological structures on ecosystems and water resources, as well as to predict natural disasters such as landslides and earthquakes. Additionally, lineament analysis aids in studying crustal deformations, analyzing seismic activity, and forecasting hazardous geological phenomena.
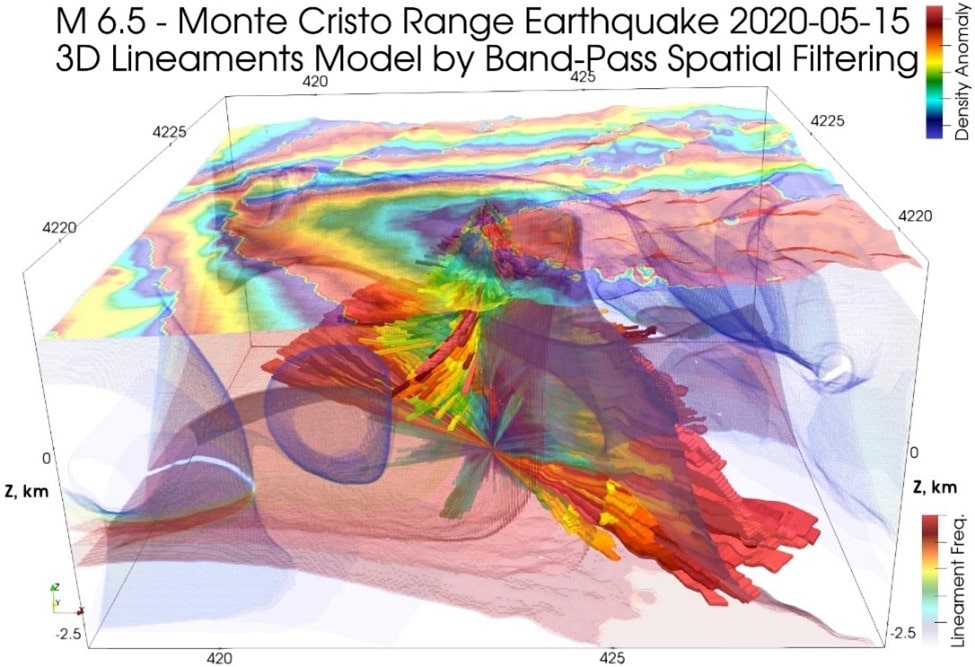
Fig. 4. 3D lineament geological model of an earthquake -
In engineering geology, lineament analysis helps determine geological risks during construction, planning dams, tunnels, and other engineering projects. It also assists in selecting optimal locations for infrastructure placement.
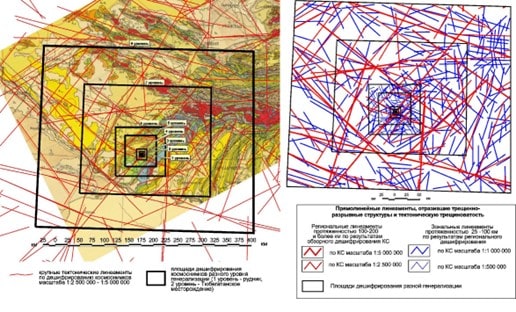
Fig. 5. Determining geological risks in construction using lineament analysis
Lineament Analysis in the Oil and Gas Industry
Lineament analysis in the oil and gas industry using remote sensing (RS) methods is a crucial tool for studying structural geology and identifying promising hydrocarbon deposits. The application of aerospace methods for detecting and exploring oil and gas fields is based on the unique features of the Earth's surface. For instance, vertical movement of formation fluids, including hydrocarbons, is most active in fault zones and areas with increased fracturing, which may manifest as lineaments and circular structures. These features can be detected using multispectral and hyperspectral satellite imagery.
The process of lineament analysis in the oil and gas sector begins with obtaining multispectral or hyperspectral images of the Earth's surface. These data represent multidimensional arrays containing information about the spectral characteristics of various surface types, including rock formations, soils, water bodies, and vegetation cover.
Geological features, manifested as systems of straight and arcuate lineaments as well as oval-circular formations, are identified on satellite images through structural-morphological analysis. The structural-morphological characteristics of the lineament network, recorded in satellite images, reflect the deep structure of the lithosphere. These features serve as informative indicators for assessing prospective hydrocarbon-bearing structures and evaluating their hydrocarbon potential.

To automatically detect linear structures and oval-circular formations in satellite images, various computer-based lineament analysis methods are often used with software tools such as LESSA (WinLESSA) by Alexander Zlatopolsky, pyLEFA (Lineament Extraction and Fracture Analysis), PCI Geomatics (CATALYST), Rockworks, and others. This approach enables efficient data processing and the extraction of characteristic features of geological structures for the oil and gas industry and beyond.
Lineament Analysis in Geological Exploration
Lineament-geodynamic analysis involves the use of various methods such as geological and geomorphological mapping, remote sensing data analysis, and other techniques to study tectonic fracture fields and geodynamic activity.
The analysis process begins with the creation of an initial model of linear features through the interpretation of multispectral aerospace survey data. This is followed by the approximation of computed data and the ranking of territories based on the degree of geodynamic activity. Subsequently, cartographic models with varying levels of detail are constructed.
Computer-based cosmogeological image interpretation and data processing are carried out using ESRI's ARC GIS software and its modules. The methodology involves identifying lineaments with various orientations based on the characteristics of the imagery, mapping neotectonic block structures and morphostructures, and comparing them with geological and geophysical materials. Computer-based interpretation is performed through systematic analysis at different scales, from small to large.
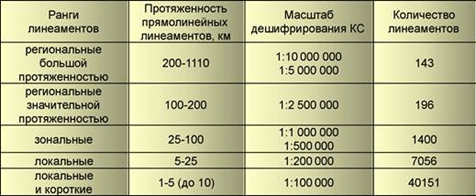
For instance, multispectral aerospace imagery interpretation in the Perm Pre-Urals region revealed a network of primary linear structures with various directions. These structures reflect recently activated narrow subvertical zones of fracturing and fault structures and regions of tectonic fracturing in the Paleozoic sedimentary cover and basement. A total of 48,946 linear structures were identified and categorized into five taxonomic levels based on their length.
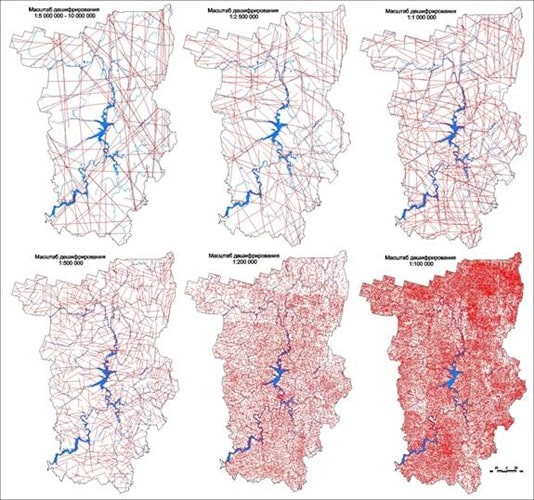
Further, in assessing the geodynamic activity of the territory, the density of lineaments and megafractures is considered, ranked into six gradations based on statistical intensity distribution scores. Variability in this indicator is attributed to block tectonics and differentiated neotectonic movements. Numerous small anomalies with increased and high intensity levels are characteristic of boundary areas of neotectonic block structures. Most deep faults are manifested as lineaments in satellite images, either spatially coinciding with their axial lines or running parallel to them. A distinct system of five primary submeridional faults of the Perm Pre-Urals and Urals can be identified, including the Main Ural Fault.
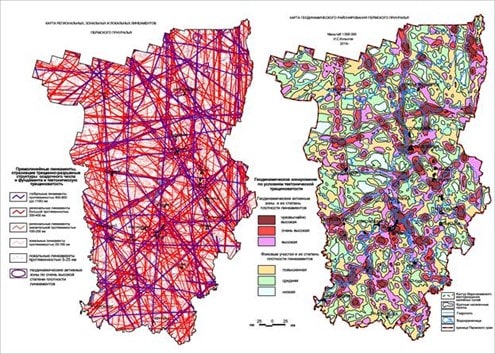
The obtained results are of great significance for assessing the geological safety of urban and mining areas with undermined sections, as well as karst safety zones where geodynamic activity poses significant risks.
How the Lineament Analysis Process Works
The lineament analysis process begins with acquiring satellite images or remote sensing data from platforms such as Landsat, Sentinel, Modis, and others. These images can be multispectral or hyperspectral, enabling researchers to extract information about various surface types and materials.
Specialized software tools such as LESSA (WinLESSA) and image processing algorithms are then used to identify and classify linear geological features in the imagery. This includes delineating mountain ridge boundaries, fault lines, lava flows, riverbeds, and other geological structures.
LESSA (WinLESSA) is one of the programs that automates lineament analysis for various types of geological research, including images, diagrams, and digital elevation models. This tool allows users to generate numerical descriptions of the data texture.
The first step in the program is to load the source data. Users then input the required calculations and parameters before executing the computations. After identifying and classifying linear features, their analysis and measurement follow. This includes determining the length, width, orientation, slope, and other characteristics of geological structures. These images can be viewed individually, overlaid, or superimposed on other raster images added to the program.
The process involves several key stages:
- Binarization of images: Transforming images into black-and-white based on brightness extremes to simplify analysis. This helps highlight contrast areas that may indicate linear structures.
- Filtering: Applying filters such as Sobel or Canny filters to detect object boundaries and contours. These filters analyze brightness gradients in the image, aiding in identifying linear features.
- Contour extraction: Computer vision algorithms identify linear structures, such as faults, based on contrasts and texture features in the image. This may include texture analysis methods and morphological operations to highlight linear elements.
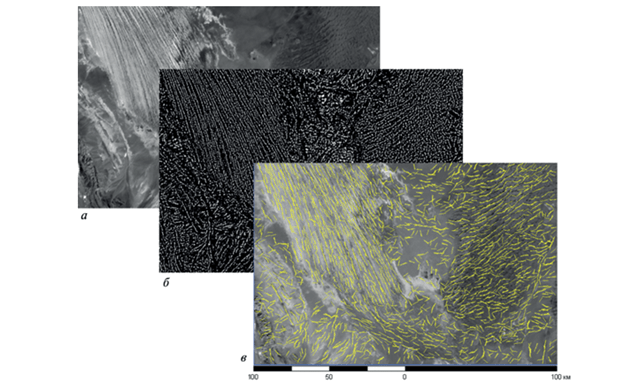
Once linear features are identified, their analysis and measurement are performed:
- Orientation: Calculated based on the angle of inclination of linear features relative to the north.
- Length: Determined using geometric methods to measure the extent of linear structures.
- Width: Assessed based on the width of brightness gradients.
- Slope: Computed relative to the horizontal plane using digital elevation model data.
After completing the calculations, a mask is created from the drawn regions, as well as from areas automatically generated based on brightness ranges. The final result is customized individually, depending on the required brightness, density, and other parameters.
The resulting data are used to create geological maps and relief models and to predict geological processes such as landslides, seismic activity, and more.
Advantages of Lineament Analysis Using Remote Sensing
- Modern satellite imagery has high resolution, enabling accurate detection and analysis of targeted features.
- Remote sensing allows the acquisition of lineament data over large areas, making it an ideal method for global monitoring and analysis.
- Using remote sensing for lineament analysis reduces the time and cost of field studies, making the process more efficient and economically viable. This is crucial for comparing results and conducting repeated measurements over different time intervals.
- Remote sensing data help identify linear structures such as faults, folds, ridges, and other structural elements. This is essential for understanding the geological and tectonic history of regions.
- Remote sensing enables the monitoring of changes in linear structures over time. This is useful for analyzing the dynamics of geological processes, such as earthquakes, landslides, and other geological phenomena.
- Remote sensing data can be integrated with other geological information sources, such as geophysical data or geological maps, to create a more comprehensive picture of the geological features of a region.
Current Limitations of Lineament Analysis
- Even with high-resolution remote sensing imagery, the accuracy of data georeferencing can remain relatively low, limiting the precision and reliability of detecting linear structures. Despite significant advancements in the resolution of modern remote sensing images, some smaller linear structures may go unnoticed due to limitations in resolving power.
- Terrain relief and surface slope can create distortions in images, complicating the accurate delineation and interpretation of linear structures. Remote sensing cannot always clearly distinguish natural linear structures, such as geological faults, from paths, roads, and other anthropogenic features.
- Despite advances in machine learning and automation of image analysis, fully automated detection and classification of linear structures remain challenging, especially in complex geological settings. Results obtained from lineament analysis using remote sensing data typically require field verification and refinement to confirm their nature and significance.
Future Prospects of Application
- Lineament analysis is used for the exploration of mineral resources such as gold, copper, oil, gas, and others. Linear structures serve as important guides for geological prospecting.
- Lineament analysis can aid in locating geothermal reservoirs, which is crucial for producing clean and sustainable energy.
- Linear structures can play a significant role in engineering and construction projects, helping to account for geological features during infrastructure design and development.
- Lineament analysis assists in understanding the dynamics of the Earth's crust, potential tectonic processes, and seismic activity.
- Lineament analysis can be utilized for monitoring and predicting the impact of natural disasters, such as landslides and earthquakes, on the environment.
Conclusion
In conclusion, this article on "Lineament Analysis" highlights the importance of this method and its wide range of applications across various fields of science and industry. Lineament analysis is a powerful tool for identifying and analyzing linear structures in geological samples or on the Earth's surface. From geology and geographic information systems to engineering and environmental sciences, lineament analysis plays a key role in understanding structural geology, resource exploration, risk assessment, and optimizing construction projects.
Modern data processing methods and geographic information system technologies make lineament analysis more accurate, efficient, and accessible for researchers and engineers. The continued development of lineament analysis will enhance the understanding of geological processes, improve resource exploration efficiency, minimize risks in infrastructure design, and refine environmental protection strategies.
Specialists at GEO Innoter LLC typically do not rely solely on a single lineament method when addressing geological challenges but use it in conjunction with other approaches. A critical expertise at the initial stage is the collection of materials for analysis. Suboptimal selection of remote sensing data will limit the potential results of interpretation and thematic analysis from the outset. Since 2000, the INNOTER team has been selecting and interpreting remote sensing data to serve the interests of end customers as well as numerous partners in the fields of geological exploration and seismic activity analysis.
