Sat-Sun: Non-working days
Agriculture is characterized by high instability, particularly noticeable in regions with fluctuating climates or low crop cultivation intensity. In such conditions, there is an increased need for both operational and continuous monitoring of agricultural lands using remote sensing data (RSD).
The goal of our study is to explore the algorithm for monitoring agricultural lands. The main objectives include studying crop vegetation periods, determining the optimal RSD source, conducting classification with training, and analyzing the obtained data.
Currently, agricultural land monitoring is predominantly carried out by governments, with occasional involvement from private companies. Examples of monitoring systems include "VEGA-Science" services [1] and the Unified Federal Information System on Agricultural Lands [2]. Typically, agricultural monitoring results in thematic maps with calculated NDVI indices or results from visual interpretation.
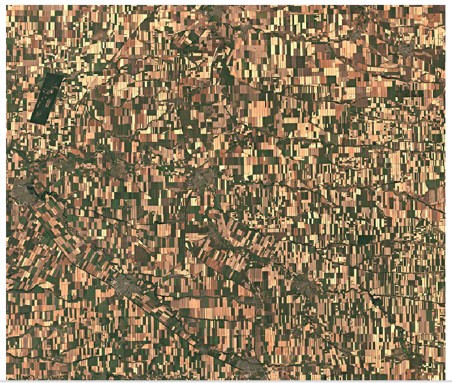
For the purposes of our research, agricultural fields located between Rostov-on-Don and Tikhoretsk in the northern part of Krasnodar Krai were selected. The study focused on corn, sunflower, and sugar beet fields.

During monitoring, it was crucial to identify optimal vegetation periods for the selected crops, study their growth characteristics, and select an imaging system to acquire RSD at specified time intervals, within an acceptable spectral range, and with adequate spatial resolution of channels.
The vegetation period for corn ranges from 85 to 140 days depending on the variety. In Russian conditions, early, medium-early, and medium varieties are mainly suitable, with vegetation periods ranging from approximately 90 to 120 days. Initial shoots appear approximately 10 days after planting. The active growth stage spans the first 30-40 days, followed by grain maturation [3].
The sunflower vegetation period ranges from 80 to 100 days. In southern regions, medium-early varieties with maturity periods of 90-100 days are more common. Initial shoots appear approximately 10-15 days after planting. The active growth stage spans the first 50-60 days, followed by head formation and flowering [4].
The sugar beet vegetation period is approximately 160 days for the first year and around 120 days for the second year. Initial shoots appear approximately 10 days after planting. The active growth stage spans the first two months of vegetation [5]. Analyzing the vegetation periods of the studied crops suggests that the optimal RSD interval for monitoring is approximately every 10-20 days.
The chosen RSD source must meet specific requirements:
- Free data access.
- Spatial and radiometric resolution sufficient for crop type recognition.
- Adequate availability of cloud-free images over the study area.
For these criteria, the Sentinel-2 imaging system is the optimal choice. This system offers open-access data, with a spatial resolution of 10 meters and a radiometric resolution of 12 bits per pixel, which is adequate for this study. The selected operational channels are the visible range (bands 2 – blue, 3 – green, 4 – red) and the near-infrared range (band 8A). All selected bands have a spatial resolution of 10 meters, enabling straightforward integration without additional processing.
Practically all crops were sown in early May, and considering the vegetation periods, the required monitoring interval was determined. For the analysis of the study area, 18 Sentinel-2 images taken between May 26 and November 7, 2018, with intervals mostly between 5-15 days, were used. All images underwent atmospheric correction using specialized SNAP software (Sentinel Application Platform).
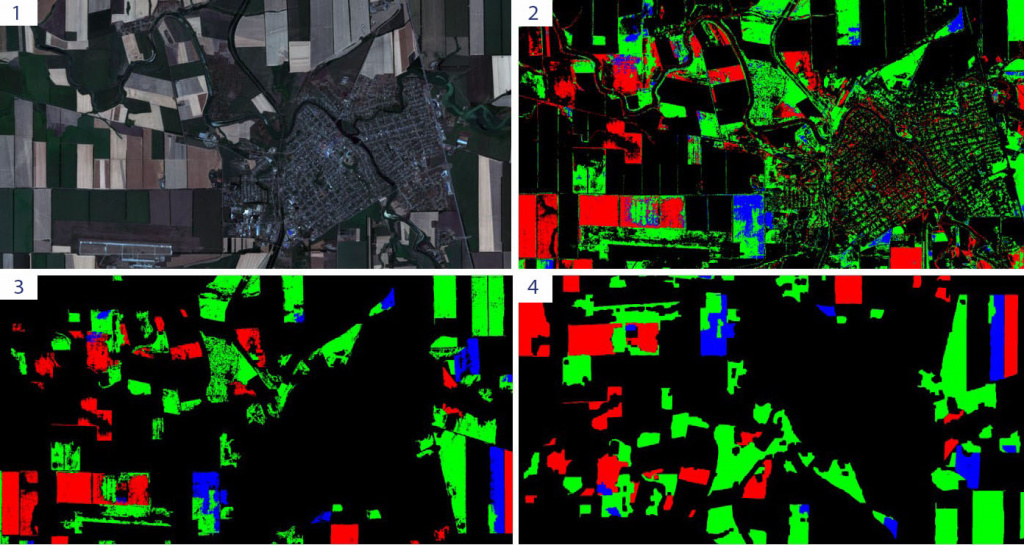
Automated classification of agricultural crops was performed using supervised classification algorithms in ENVI (Exelis Visual Information Solutions) software.

Before starting classification, significant attention was given to selecting training samples for supervised classification to ensure the reliability of the results. Field decoding was conducted to create reliable samples for both classification and accuracy assessment. Notably, information on these samples can be obtained from various sources, such as "VEGA-Science."
Maximum Likelihood classification method was chosen for classification. This method assumes normal distribution of brightness values for each class and calculates the probability of each pixel belonging to a specific class.
During processing, a probability threshold and data scalability coefficient were specified. The probability threshold sets the limit at which a pixel is assigned to a class, set to 0.9 for this study. The data scalability coefficient is calculated using the formula (2^n – 1), where n is the radiometric resolution of the imaging system and is equal to 4095 in our case.
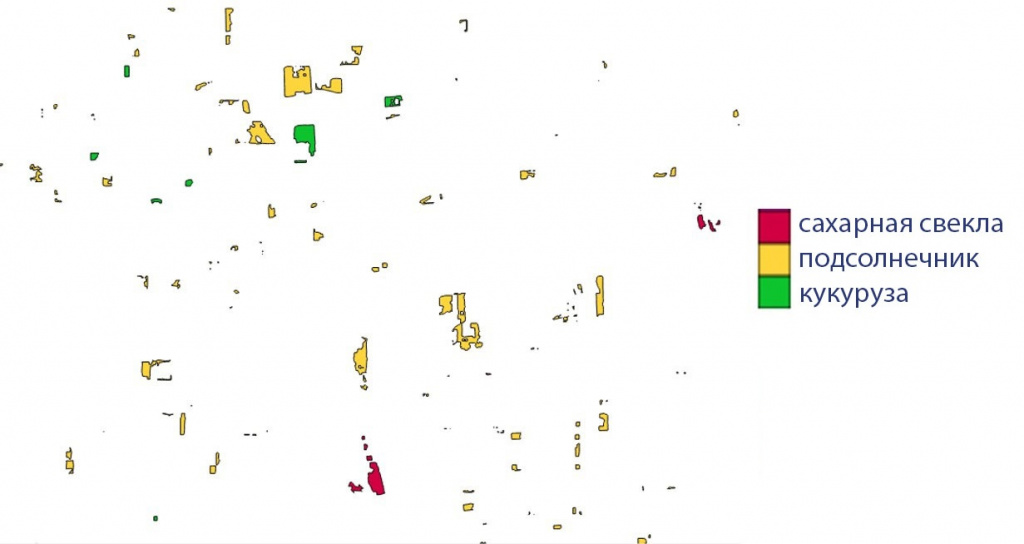
After performing classification for each crop on each image, classifications were overlaid and areas with low overlap were removed. This process yielded areas where the same class was identified throughout the monitoring period.

This monitoring method is significantly influenced by cloud cover. Even if clouds do not obscure the training samples, they can still affect the overall classification results.
Future plans include expanding this monitoring method by incorporating channels with different spectral ranges, using alternative channel combinations, and enhancing the accuracy assessment of this algorithm.
