DEM, Morphometric,Bathymetric
Methods Based on Digital Elevation Models (DEM)
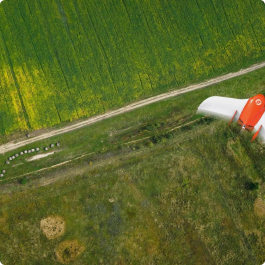
A Digital Elevation Model (DEM) is a type of three-dimensional terrain model that contains data only about elevation (without trees, buildings, and other objects). In recent years, DEMs are created after processing images obtained from unmanned aerial vehicles (UAVs).
To create a DEM, numerous elevation points with known geodetic coordinates are used. The digital model is constructed based only on points classified as land surface elevation points. Each elevation is determined using an elevation interpolation rule, ensuring a detailed digital terrain model with varying elevations between elevation points.
The purpose of a digital elevation model is to obtain information about the terrain with a specified level of accuracy and detail for a designated area. It is used in various applications, including:
- Displaying terrain for creating and updating digital topographic maps and plans of various scales.
- Creating thematic and specialized maps and plans for specific purposes.
- Hydrodynamic modeling of terrain flooding.
- Building a three-dimensional geological model.
- Radar (radar) interferometry.
- Creating navigation maps with different levels of detail and address information.
- Creating topographic plans.
- Predicting landscape processes.
- Land use planning.
- Construction of roads, highways, and interchanges.
- Environmental protection tasks, including modeling ecological situations.
- Studying and quantitatively assessing the current state of the natural environment.
- Land management and cadastral work.
- Creating digital terrain models for planning and developing telecommunications networks.
- Determining the depth of groundwater.
Currently, a large number of satellites are launched to obtain high and very high-resolution images, and technical and software tools are developed and used to create DEMs.
Data from satellites can be obtained more quickly, as they may already be available in the operator's archive. Aerial photographs taken from an aircraft or UAVs are also used.
DEMs obtained through stereophotogrammetric processing of satellite images and aerial photographs are characterized by high accuracy and informativeness.
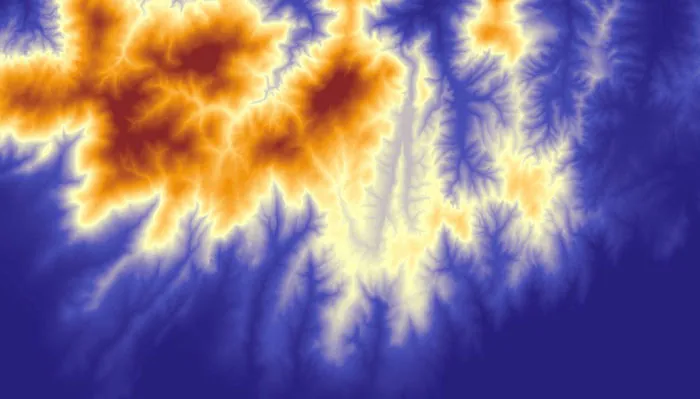
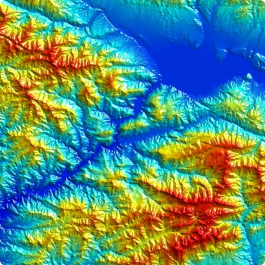
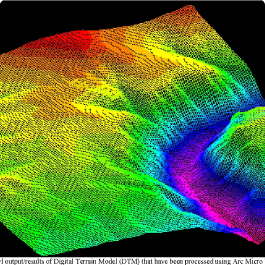
Figure 5: Example of a Digital Elevation Model (DEM)
With the help of new Geographic Information System (GIS) technology, unlike its predecessor - conventional "paper" maps, digital data can be processed, and a spatial three-dimensional digital terrain model that closely approximates reality can be created.
GIS packages typically include specialized tools for visualizing DEMs, allowing for the display and/or printing of two- and three-dimensional terrain images (block diagrams) with the ability to change the viewing position in terms of direction (by rotating the terrain block diagram around the vertical axis) and height. They also allow overlaying any other information layer from the database onto the terrain surface (provided that the raster size matches), as well as zooming in or out of the image.
The set of spatial analysis functions for digital elevation models in different GIS packages varies significantly. The construction of a digital elevation model is based on a structural interpolation model in which reference points are set on structural lines of the terrain - watersheds and thalwegs. In this case, to determine the elevation of the topographic surface at any point not coinciding with the reference points, only data from the reference points located on the same slope are used, which excludes the distortion of the relief's morphology, even when using the simplest interpolation methods.
Morphometric Methods for terrain analysis
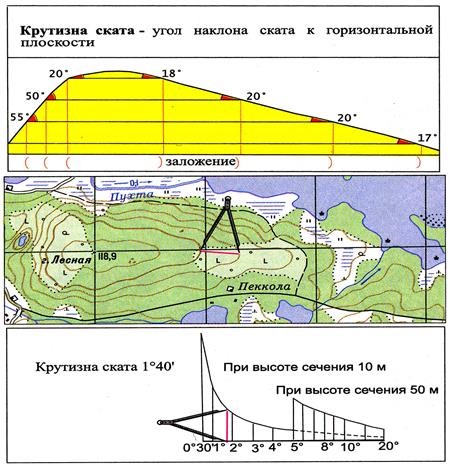
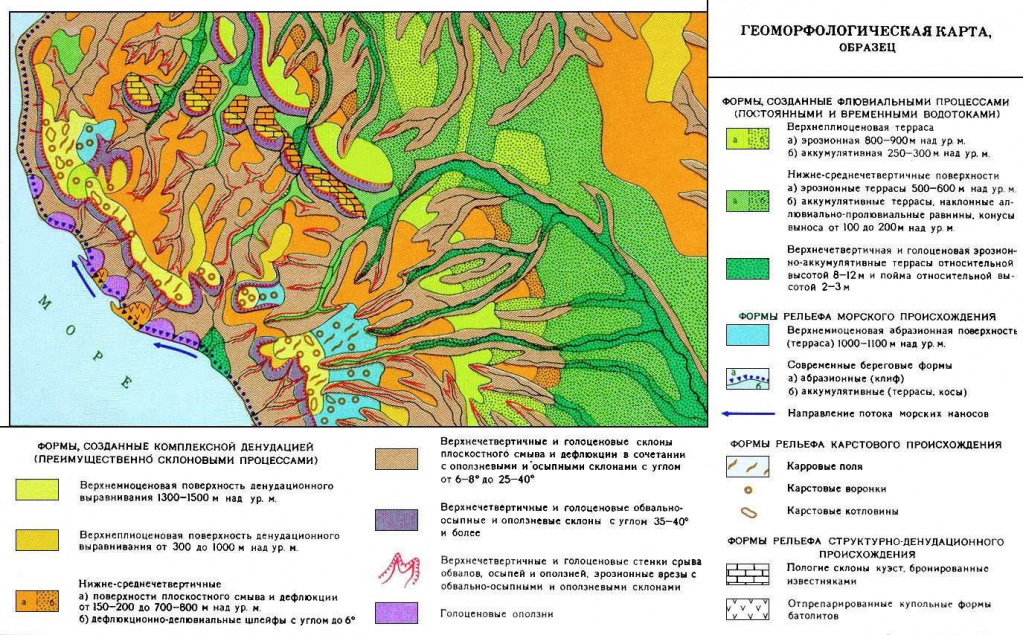
In the field of terrain analysis, morphometric methods are widely applied. These methods rely on quantitative characteristics of the terrain that can be obtained through the analysis of topographic maps, geomorphological profiles, satellite and aerial imagery, and, more recently, digital elevation models (DEMs). The goal of morphometric methods is to identify tectonic deformations based on exogenous landforms, their morphology, and distribution over an area.
The suite of morphometric methods includes, first and foremost, the determination of the degree of horizontal and vertical terrain dissection, especially in plain regions.
Horizontal dissection is determined by the density of all linear erosion forms of permanent and ephemeral watercourses, measured by the quantity of forms or by the total length of these forms per unit area.
Vertical dissection of the terrain is determined by the difference in elevations (maximum and minimum) of the Earth's surface on individual plots, as well as by the depths of erosion incisions relative to watersheds. Areas experiencing uplift exhibit a higher degree of both horizontal and vertical terrain dissection compared to areas undergoing subsidence or remaining stable. Both methods are employed to detect various deformations, primarily in closed plain regions.
Another technique used in morphometric analysis involves constructing morphohypsometric maps. This entails generalizing a topographic map, removing small landforms created by linear erosion, and reconstructing the original terrain surface, where the position reflects tectonic deformations such as uplift or subsidence. Smooth lines, known as morphohypsometric curves, connect positive elevations of individual contour lines, revealing ovals of tectonic uplift. Lower values of morphohypsometric curves delineate negative structures. Maps of valleys of various orders also enable the identification of areas with different tectonic motion patterns. Areas experiencing recent uplifts exhibit a rapid transition from simpler erosion forms, considered lower-order forms like runoff basins and streams, to larger, higher-order forms like rivers. In areas undergoing subsidence, the increase in the order of valleys occurs more slowly.
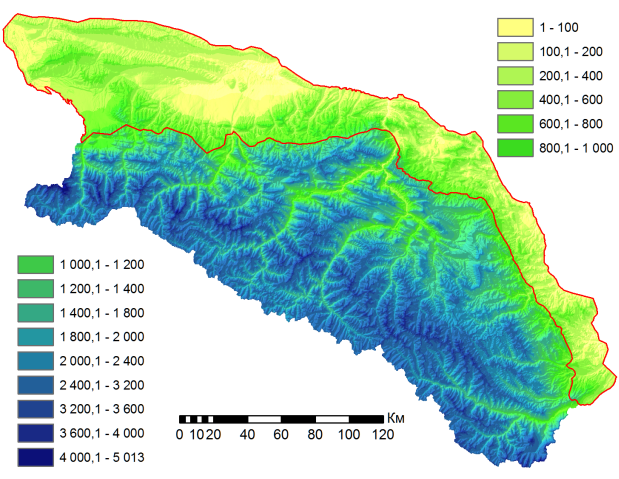
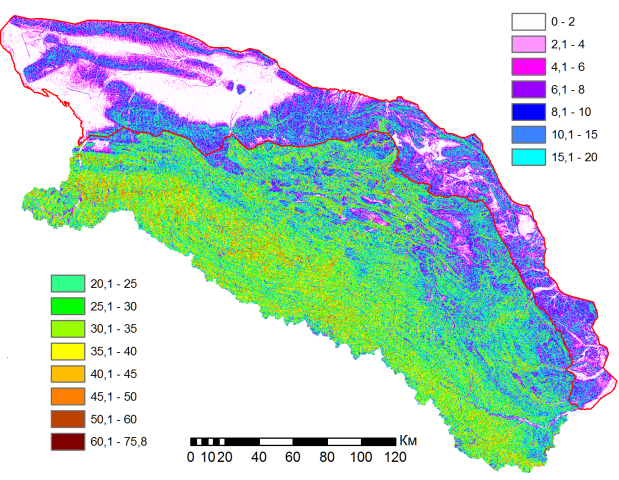
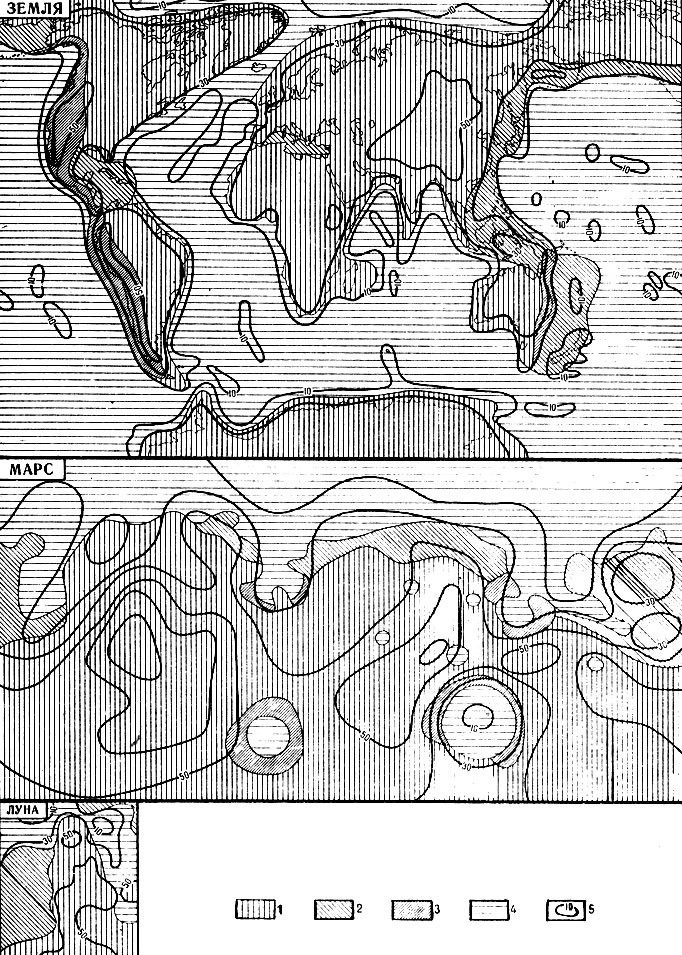
Fig. 6 Distribution of elevations in the Northeastern Caucasus region
Bathymetric Method for terrain analysis
The bathymetric method is employed in the study of underwater topography in seas and oceans. It is based on the analysis of existing seafloor maps and the creation of new ones using techniques such as echosounding, seismic acoustics, seismostratigraphy, and drilling. Underwater relief is also captured through photographic surveys using deep-sea photography equipment. A significant portion of the seafloor features, both large and small, comprises either tectonic features (elevations – uplifts, basins – depressions) or volcanic formations. Analyzing the depths of the seabed allows for more cost-effective placement of pipelines or internet cables encircling our planet.
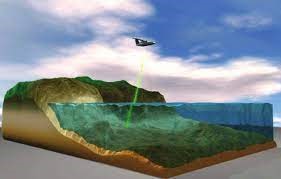
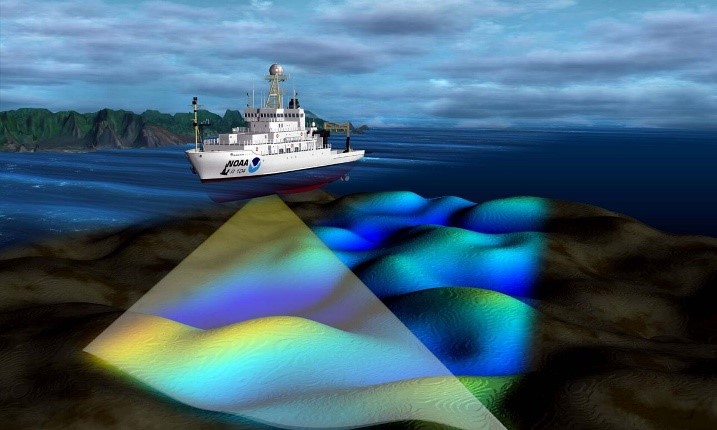
Fig. 7,8 Bathymetric Method
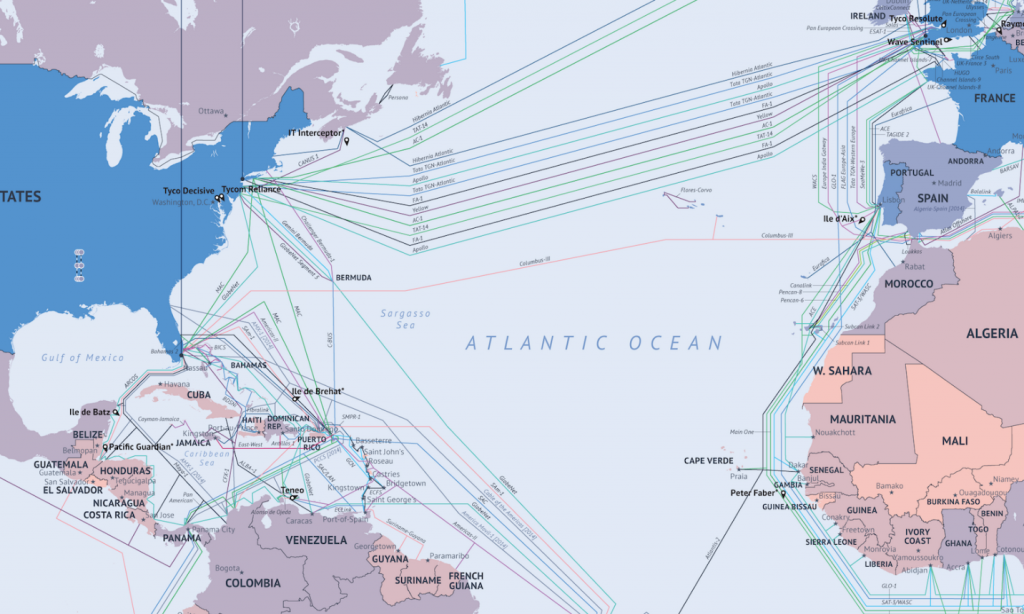
Fig. 9 Submarine Internet Map from 2014