of geospatial solutions
Sat-Sun: Non-working days
Retrospective analysis is a detailed analysis of data that changed within a specific time frame. The period from some event in the past to the present is taken into account. The result is the determination of change in quantitative and qualitative terms.
Retrospective analysis is a historical study of the territory (sometimes also of objects) for a time period (from 5 to 40 years) using remote sensing methods.
The dynamics of the territory development leads to the assessment of its current state, as a rule, to a sharp deterioration of its indicative indicators, environmental situation and critical infrastructure data.
RS reveals certain changes in qualitative and quantitative direction, which allows, on the basis of analytics, to make the right decisions for improvement and countermeasures to eliminate developing problems.
It is important that historical analysis allows, for example, to look at the dynamics of yields of individual fields and plots over several years, comparing farming methods, weather conditions, varieties, etc. with the yields obtained at the end of the season, or a sharp reduction in forest areas, slowing down the growth of the necessary varieties of trees, representing the lungs of the planet.
Subject of Retrospective Analysis
The interconnection between the past and the present is valuable to track in various fields and areas of scientific activity. Analyzing the dynamics allows us to observe not only the changes that have occurred but also to understand the approaches employed by predecessors.


Key Stages of Retrospective Analysis
The research is conducted following a specific algorithm that involves four stages:
- Acquiring and working with relevant data. The time interval for analysis is determined, which can span up to 5 years or more.
- Identifying significant information. This is necessary to justify the set task. This stage requires considerable time during research, as it involves analyzing primary sources and sorting selected materials by dates.
- Interpreting the obtained information correctly. It is determined how a particular situation developed, which problem-solving methods were applied, and what consequences ensued.
- Providing recommendations based on the conclusions drawn. In other words, solutions to the task are developed, taking into account the experience gained over the past years.
Technical and economic departments, as well as other divisions of the enterprise, participate in the analysis. An explanatory note with an assessment of economic activities and options for improving the situation in future periods is attached to the annual report. The essence of the method lies in comparing current results with indicators from earlier time intervals.
Goals and Objectives of Retrospective Analysis
Conducting research allows obtaining data based on which the necessary parameters are determined to get a comprehensive view of the financial activities of the organization. This includes profits, losses, and changes in assets and liabilities over a period. The analysis helps choose the most effective ways of operation, abandon unprofitable directions, and allocate resources wisely.
Goal: Obtain retrospective data that enables decisions about stagnation or improvement in situations for specific territories or objects that are in a state of destruction or degradation.
Therefore, retrospective analysis is used to address the following tasks:
- Analysis of agricultural lands where sowing is impossible;
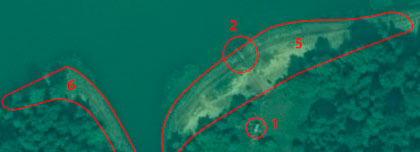
- Analysis of forest lands that have suffered losses in the forest fund, logging, deforestation, fires, floods, etc.;
- Determining the dynamics of polluted lands, water resources, and the surrounding environment over the years around industrial enterprises or places of mineral extraction;
- Detecting deformations of slopes or underground hollow structures;
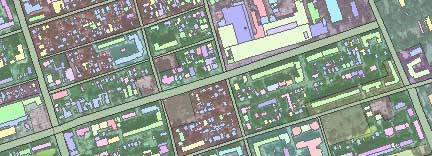
- Assessing the decline of cities and settlements;
- Long-term "silent" changes in ecology;
- Retrospective modeling;
- Creating retrospective multi-vector maps by years in the directions of remote sensing.

The task of creating retrospective maps is to obtain cartographic products that are as close as possible to the possible development of the situation and assist individuals, companies, the client in making the right prospective decisions for the future. In accordance with current regulatory and technical documents and the client's technical task.
Basic tasks of historical analysis include:
- Obtaining objective information about the state, managing the results of financial and economic activities;
- Finding unrealized reserves and using them to improve the economic situation in production in subsequent periods;
- Identifying shortcomings in the enterprise's activities over the established period;
- Achieving a balance in the material and moral aspect of work results.
Retrospective analysis is conducted over historical periods, where the results of economic activities are evaluated, and payments are made to production teams, making it an integral part of the financial calculations of the enterprise. Strategic issues related to management and planning are resolved based on the obtained results.
Advantages of Using Remote Sensing Data (RSD)
Remote sensing of history is the process of recording information from sensors, usually installed on satellites (the Landsat satellite system has existed since the 1970s). Archiving RSD data. This method is applicable for assessing the historical degradation of nature and human habitats, representing recurring events or processes that leave traces of their historical manifestation. No other historical archival data provide a global concentration of Earth's condition over a 30-40 year period.
Retrospective analysis based on satellite imagery is, in some cases, the only way to collect reliable historical information about the land when archival data from other sources are absent or do not cover the analysis area.
Identifying the location of historical events and/or determining the conditions of their degradation through RSD allows identifying trends in the creation of natural hazards to take measures to reduce them, reducing the social and economic impact of future potential disasters.
As a result, a set of cartographic materials for specific time periods is provided.
Adding vector thematic historical forecast layers to GIS, where RSD data are present in any case. Without them, a modern GIS is not created. Transition to interactive retrospective maps.
Advantages of Retrospective Analysis
The conducted research pursues two goals simultaneously – it contains data for operational analysis and serves as a prospective analysis. In other words, a more complete picture of the economic activities of the organization is formed.
Comprehensive retrospective analysis serves as a qualitative basis for prospective analysis capable of evaluating the effectiveness of solving tasks set by operational management of the enterprise.
Obtaining unified reporting and the possibility of excluding random events affecting key indicators such as revenue, cost, etc., allow for highly accurate forecasting of the situation in the short or medium term. Based on the analysis, it becomes possible to understand what, with what financial influences, can achieve a specific effect.
The analysis evaluates production reserves, calculates the costs of their mobilization, with an emphasis on economical ways to achieve the goal to minimize investments.
Drawbacks of Retrospective Analysis
Remote sensing satellite operators capture images according to their plan, based on the economic feasibility of covering the territory with images. Humanity has not yet mastered the ability to go back in time and capture something anew. The analysis is conducted based on the images available in the archives.
To conduct an analysis in a near real-time mode, fresh images are required, which are significantly more expensive than archival ones. To guarantee the availability of images for analysis, it is necessary to order new capture or, at a minimum, place an order for speculative capture without a commitment to purchase satellite images.
Possibilities of Remote Monitoring
Remote control over territories and resource management is enabled by methods of space monitoring. During the analysis, business activity is identified, and necessary information about the economic activities of an enterprise is collected from any part of the planet.
Space imagery collects statistical data, which is not always public for various objective reasons. It allows remote observation of changes taking place in the territories of other countries.
In some cases, retrospective analysis based on satellite imagery is the only way to gather reliable information about the terrain when archival data is unavailable. It eliminates problems associated with incomplete coverage of the territory.
Result: a set of cartographic materials for tracking qualitative and quantitative changes in the territory over specific time periods.
Frequently Asked Questions (FAQ):
1) What information can be obtained about the history of changes in vegetation, soil, and other target objects in the field?The results of the analysis of historical remote sensing data allow:
- Track changes in field boundaries and crop rotations;
- Compare the development of plants in different years;
- Study the reaction of plants to changes in weather conditions;
- Identify the causes of reduced crop yields;
- Cartographic representation of field features;
- Obtain information for local response and take necessary measures to address issues.
2) What is the essence of landscape retrospective remote sensing data?
- Long-term retrospective analysis of the evolution of landscape features using the potential of time series of historical archival, for example, optical satellite imagery, allows obtaining temporal trajectories and characteristics of the disruption or stability of the territory, which are then used as input data for assessing the current state of local ecosystems.
3) What are the most well-known models of retrospective remote sensing analysis?
- Water Quality Index (CWQI) and river turbidity models over a 30-year period.
- Model of deterioration of water quality in natural subregions (over 40 years), including mixed grasses and dry mixed grasses, associated with irrigation agriculture.
- Model of cyanobacterial bloom in the Baltic Sea, related to changes in hydrometeorological conditions (river discharge, water temperature, and wind conditions) and their year-round patterns.
- Model based on waste accumulation analysis using retrospective statistical data and assessment of the level of anthropogenic impact on vegetation cover and soils near solid waste landfills.
- Soil cover model. A series of land use maps (8 maps) using retrospective monitoring technology with a frequency of 5 to 10 years. These maps allowed tracking changes in land use types and comparing them with soil cover. It was found that the intensity of land use change in general and land abandonment in particular is closely related to soil cover, especially in unfavorable economic conditions. Graphic dynamic analysis, time series, linear regression analysis, polynomial regression, and three-dimensional spline response surfaces were used to characterize the historical response of measuring indicators.
- Model of pasture degradation. The inability of traditional field monitoring to cover the range of variability of ecological indicators and disturbances, including climatic effects and land use practices, at spatial scales from regional to national, and time scales over decades, was addressed using remote sensing technology. This model presents a protocol for retrospective monitoring and assessment of pasture degradation using historical time series of remote sensing data and catastrophe theory as an ecological basis for accounting for both gradual and rapid changes in condition.
- Mangrove forest degradation model. Provides a quantitative and qualitative assessment of the degradation of vegetation structure and dynamics of mangrove communities over a 25-year period using satellite imagery in a geographic information system (GIS) in combination with ground data for various layers of vegetation and faunistic ecological factors.
Sat-Sun: Non-working days