of geospatial solutions
Sat-Sun: Non-working days
|
Channel |
Channel 1 |
Channel 2 |
Channel 3 |
Channel 4 |
Channel 5 |
Channel 6 |
Channel 7 |
Channel 8 |
Channel 9 |
|
PC 1 |
0,1396 |
0,1127 |
0,7539 |
0,4395 |
0,2202 |
0,2232 |
0,2066 |
0,1741 |
0,1869 |
|
PC 2 |
-0,1772 |
-0,2392 |
0,6162 |
-0,2317 |
-0,2859 |
-0,3035 |
-0,3034 |
-0,3153 |
-0,3357 |
|
PC 3 |
0,5871 |
0,5966 |
0,1439 |
-0,5106 |
-0,099 |
-0,0529 |
-0,0556 |
0,0386 |
0,0276 |
|
PC 4 |
-0,2958 |
-0,2993 |
0,1714 |
-0,6633 |
0,1248 |
0,1158 |
0,2767 |
0,309 |
0,3906 |
|
PC 5 |
0,0316 |
0,014 |
-0,0098 |
0,1811 |
-0,3798 |
-0,7265 |
0,4358 |
0,2864 |
0,1479 |
|
PC 6 |
-0,1449 |
0,1229 |
0,0095 |
-0,0635 |
-0,3604 |
0,4059 |
0,4774 |
0,201 |
-0,6299 |
|
PC 7 |
-0,0396 |
-0,0006 |
0,0011 |
0,1171 |
-0,7497 |
0,3652 |
-0,2628 |
0,0208 |
0,4688 |
|
PC 8 |
-0,0599 |
0,0025 |
0,0107 |
0,0427 |
0,0496 |
-0,0721 |
-0,5428 |
0,8023 |
-0,2201 |
|
PC 9 |
0,6998 |
-0,685 |
-0,0393 |
-0,0093 |
-0,0762 |
0,1034 |
0,0634 |
0,0822 |
-0,1098 |
You can order from us


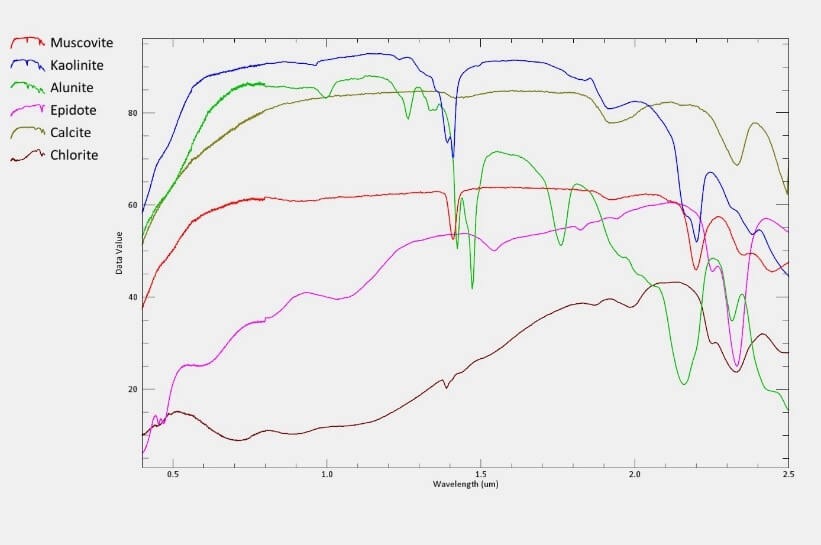
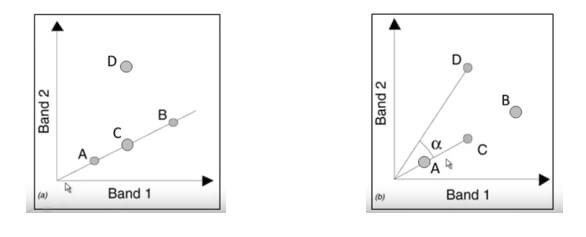
Spectral angle method (SAM)
The method for comparing image spectra to individual spectra or to a spectral library (Boardman, unpublished data; CSES, 1992; Kruse et al., 1993a) is based on estimating spectral similarity in (n - dimensional) feature space by computing the spectral angle between them.SAM computes the spectral angle between the closest set of spectra and the reference spectra, where A is the reference spectrum, B, C, D are the set of pixel spectra, and α is the spectral angle between the vectors.
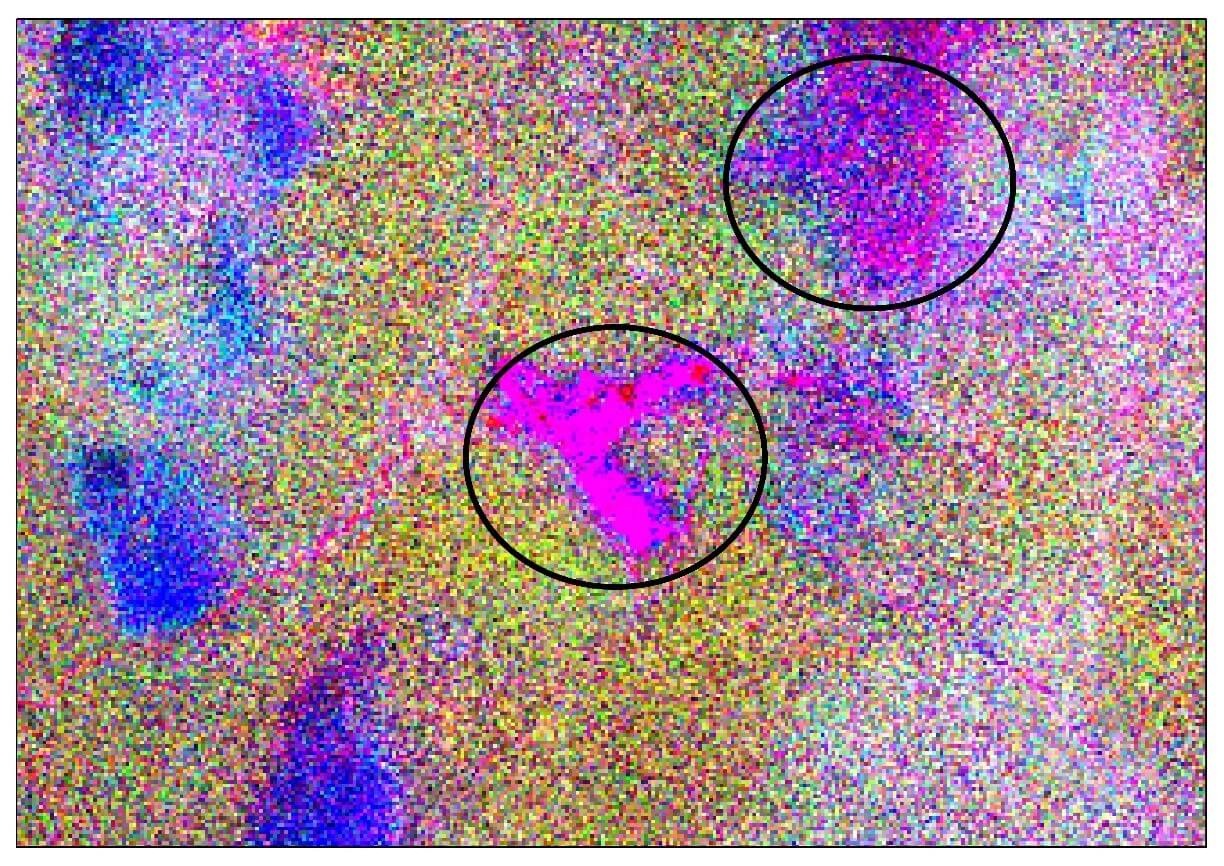
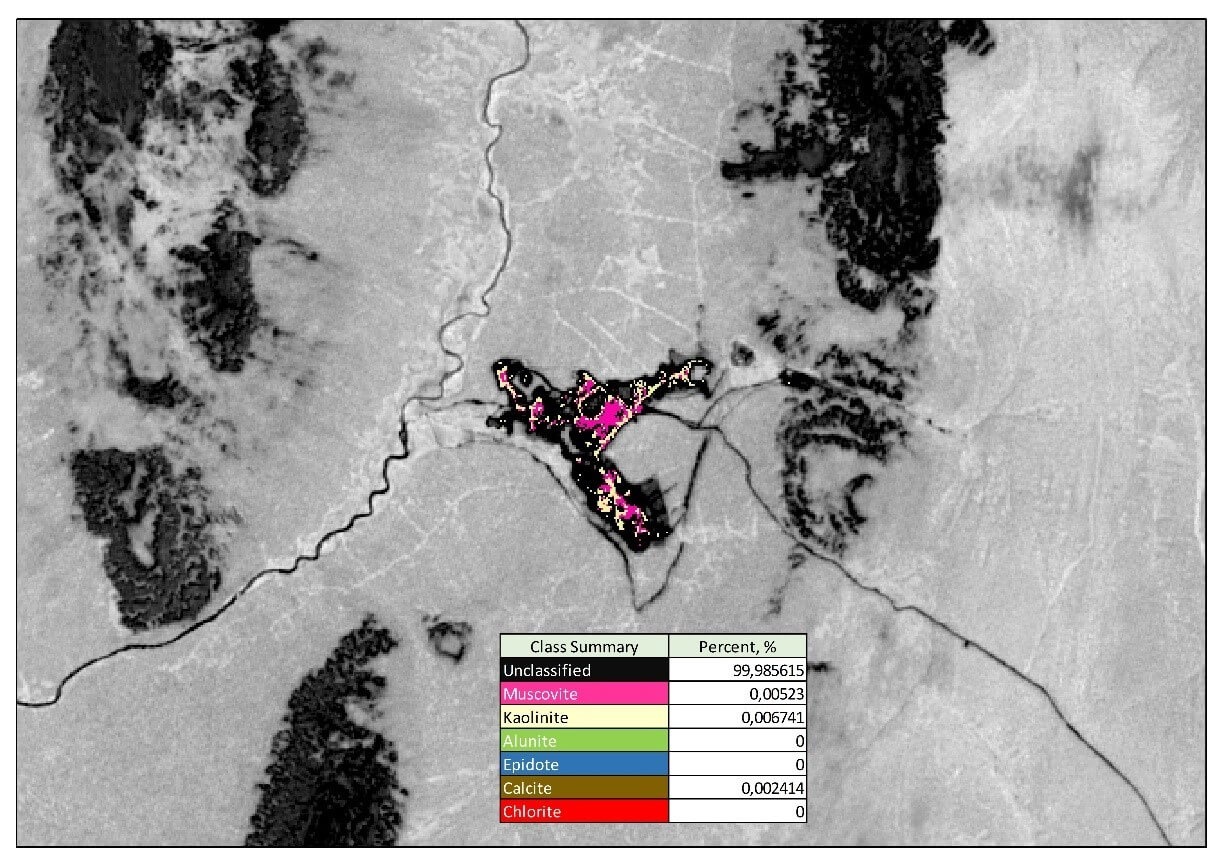
Having applied the SAM method to the territory of the Urals, we obtained a map of the Al (OH) mineral group (Fig. 4).
Calculation of mineralogical indices
Mineralogical indices allow to identify the area of certain mineral groups. In order to compose mathematical operations with the channels of the spacecraftspacecraft, the spectral characteristics of the mineral, namely the absorption zone, must be taken into account. The Al(OH) group was identified using the AL(OH)=(B4/(B6)*(B8*B8)) channel operation. ASTER data in channel 4 has a high reflectance spectral index, while channel 6 and 8 have absorption spectra.
Ural region. The Ural region has been studied to such an extent that no new large deposits are expected to be discovered, but small and possibly medium-sized deposits can be found, also largely due to the use of remote sensing methods.<br>
<br>
exploration. In addition, a systematic reassessment of the resource potential of the Ural region is needed due to fundamental changes in the understanding of the geology of the area. Today, the Ural fold belt is viewed as a collisional structure with a complex paleogeodynamic history, rather than as a mobile geosynclinal zone, the doctrine of which was developed in the late 19th and mid-20th centuries. All major issues of the resource potential of the Urals have been described and solved from the geosynclinal theory. This applies to the issues of mineralogy, tectonics, and paleogeography of the area. Most of the material on geology requires systematic revision within the framework of new paleogeodynamic ideas about the formation of the Urals, in correlation with the history of development of paleotectonic movements, paleogeographic settings, ore genesis, etc., as well as with the history of paleotectonic movements. The performed studies with the use of innovative methods will allow to consider the history of formation of coal-bearing formations of the Ural region in a new way and assess the geological prospects of their productivity.<br>
<br>
Administratively, the work sites are located in the Ural Federal District (Khanty-Mansiysk Autonomous District, Perm Krai, Sverdlovsk Oblast, Komi Republic). Geologically, the work area covers the Trans-Urals marginal trough and the West Siberian Plate.
<h2>
Iran.</h2>
There are many known copper porphyry type deposits in the Central Iranian volcanic belt located in the northeast of the country (Fig. 6, p. 84). Iran has great potential for exploration of copper porphyry type deposits using remote sensing data due to its good physiographic conditions and high degree of outcrop. Thus, the region becomes an interesting area for studying the prospects of discovery of epithermal gold mineralization of copper-porphyry and vein type (Fig. 7, p. 84). <br>
<br>
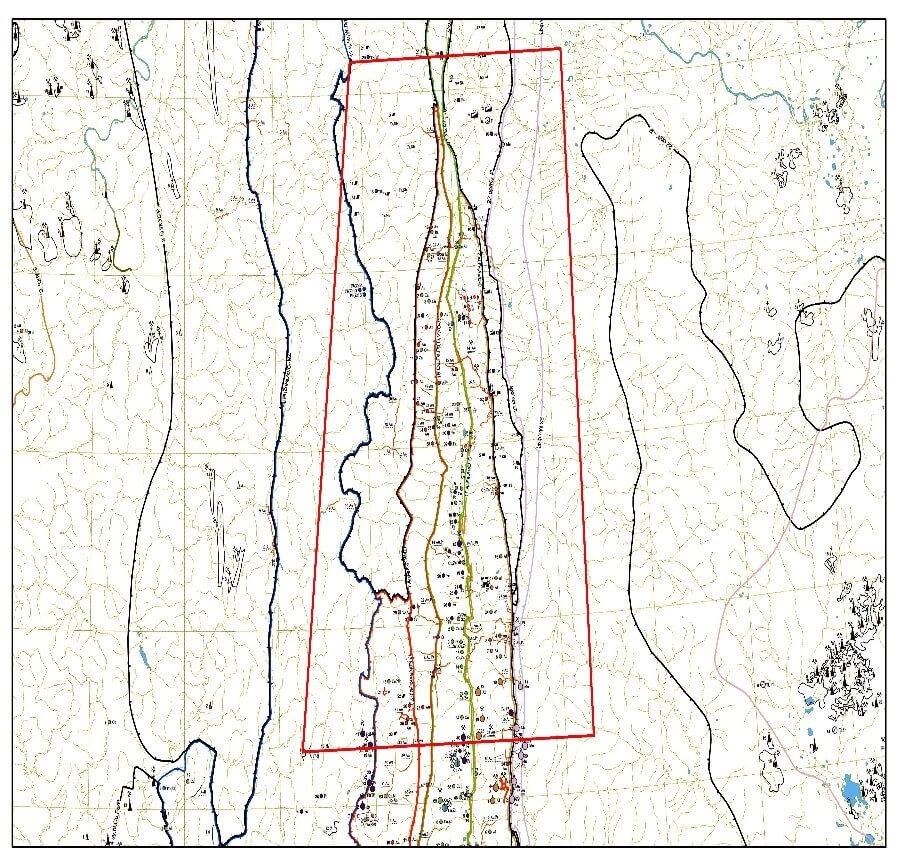
In the present study, two copper mining areas in the southeastern segment of the volcanic belt, Meiduk and Sar-Cheshme, were selected. ASTER space images were used exclusively.<br>
<br>
This paper utilizes efficient spectral transformation techniques to identify hydrothermal alteration minerals. Methods of principal component analysis, calculation of mineralogical indices, minimum noise fraction (MNF) were used.<br>
<br>
Principal component analysis is a method based on statistical approaches in which new coordinate axes (components) are created with directions corresponding to the directions of greatest scatter of the original data. Multispectral image two or three components are able to describe almost all variability of spectral characteristics. Thus, by canceling the other components, it is possible to reduce the amount of data without data loss.<br>
<br>
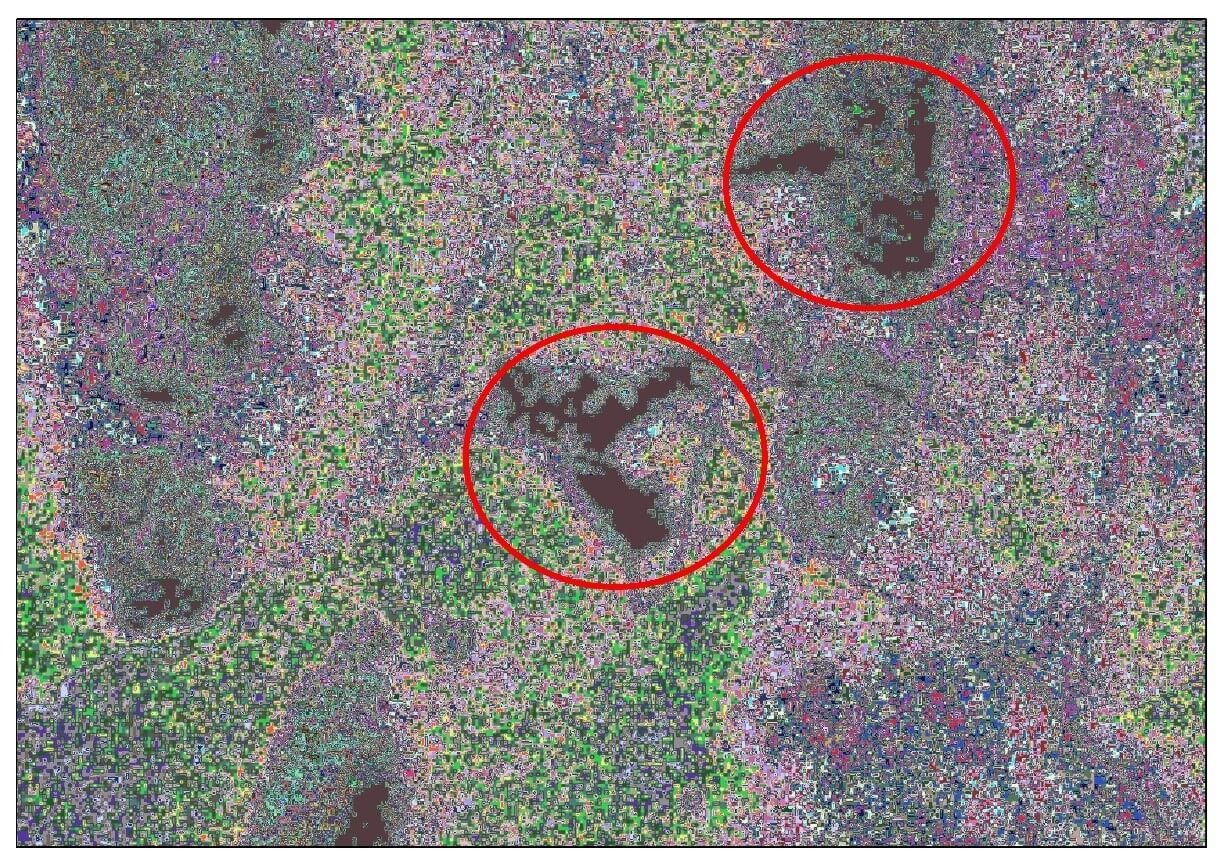
Through principal component analysis, RGB composites PC5 (plant data), PC6 (Al(OH) group), and PC7 (Fe, Mg(OH) group) were obtained showing hydrothermal alteration in the Meiduk and Sar-Cheshme areas (Figure 8 on p. 84, Figure 9).<br>
<br>
Mineralogical index (BR) calculations identified minerals such as muscovite. The index was calculated from the difference of channels 7/6, where bright pixels corresponded to the mineral Muscovite.<br>
<br>
With Minimum Noise Fraction Transform, data reduction is achieved by eliminating channels containing the highest noise fraction. Minimum Noise Fraction Transform is a direct transformation. It also excludes channels containing connected (coherent) images (Boardman and Kruse, 1994). <br>
<br>
The table of eigenvalues of all SWIR ASTER channels in Meiduk and Sar-Cheshme territory was calculated. As a result, composite RGB images were obtained, which are shown in Figures 13 and 14.<br>
<br>
The hydrothermal changes in RGB images are similar to those obtained by PCA and BR. The results proved to be effective and consistent with the results of field and laboratory studies (Amin Beiranvnd Pour, 2011).
<h2>
Conclusions</h2>
Thus, it is confirmed that processing and analysis of ASTER space images is a valuable tool for mapping mineralogical units. The use of high-resolution space images allows us to interpret the distribution of mineral groups and hydrothermal alteration zones. Each of the methods described in the paper showed almost similar results in cardinally different regions, which proves the feasibility of their application.<br>
<br>
Zones of mineral hydrothermal alteration associated with copper porphyry mineralization were studied using VNIR and SWIR channels. Spectral methods can adequately detect hydrothermal alteration zones using exclusively remote VNIR and SWIR data on a regional scale.<br>
<br>
It is necessary to realize that complex use of both traditional and modern remote sensing methods is necessary to solve geological problems. However, a significant share of classical tasks related to the diagnosis of material composition, geological boundaries, elements of ore body occurrence can be solved with the help of remote sensing. Introduction of such innovative methods into the cycle of geologic and prognostic works will allow to significantly reduce time and financial costs.<br>
<br>
Е.М. Шемякина - научный сотрудник геологического факультета МГУ им. Ломоносова, ассистент инженерной академии РУДН, ведущий специалист отдела ГИС - геолог ООО "Иннотер".<br>
Список литературы:<br>
<br>
1. Boardman, J. W., and Kruse, F. A., 1994. Автоматизированный спектральный анализ: геологический пример с использованием данных AVIRIS, север Грейпвайн Маунтинс, Невада: в материалах Десятой тематической конференции по геологическому дистанционному зондированию ERIM, Институт экологических исследований штата Мичиган, Анн-Арбор, MI, стр. I-407 - I-418.<br>
<br>
2. Центр изучения Земли из космоса (CSES), 1992. Руководство пользователя SIPS, Система обработки спектральных изображений,<br>
<br>
Версия 1.2, Центр изучения Земли из космоса, Боулдер, CO, стр. 88.<br>
<br>
3. Hubner, H., 1969a. Геологическая карта Ирана Лист № 5, Южно-Центральный Иран: Тегеран, Национальная иранская нефтяная компания, масштаб 1:1000 000.<br>
<br>
4. Hubner, H., 1969b. Геологическая карта Ирана лист № 6, юго-восточный Иран: Тегеран, Национальная иранская нефтяная компания, масштаб 1:1,000,000<br>
<br>
5. Mars, J.C., Rowan, L.C., 2006. Региональное картирование филлитовых и аргиллитовых пород в магматической дуге Загрос, Иран, с использованием данных усовершенствованного космического радиометра тепловой эмиссии и отражения (ASTER) и алгоритмов логических операторов. Геосфера 2 (3), 161-186.<br>
<br>
6. Амин Бейранвнд Пур, Мазлан Хашим, 2011. Идентификация минералов гидротермального изменения для разведки порфирового медного месторождения с использованием данных ASTER, Южный Иран, Journal of Asian Earth Sciences 42 (2011) 1309-1323.<br>
<br>
You can order from us


Sat-Sun: Non-working days