Spill maps in PDF, GeoTIFF and shapefile, pollution GIS layers, a drift forecast and an analytical report on the water area.
Search the site
Spill maps in PDF, GeoTIFF and shapefile, pollution GIS layers, a drift forecast and an analytical report on the water area.
Total cost — from 300 000 ₽
Timeline — from 20 working days
Consultation and preliminary analysis — free of charge
If the listed information cannot be provided, describe the water area, task and period — specialists will analyse the need and propose an option.
Describe the territory, questions and analysis dates — we will assess the archive and the scope of work.
Satellite environmental monitoring of a marine area detects surface pollution by petroleum products, districts and likely sources, transport pathways and environmental damage.
Tasks: an emergency spill over a large area; fuel dumping from ships; likely slick sources; drift direction; tracking the appearance, trajectory and disappearance of slicks; assessment of environmental consequences; confirmation of reclamation; integrated assessment of coastal areas; information support for prevention and clean-up of emergency spills.
Pollution causes are the human factor (tanker collisions, shipwrecks), natural disasters, failures of offshore drilling rigs or underwater oil pipelines.
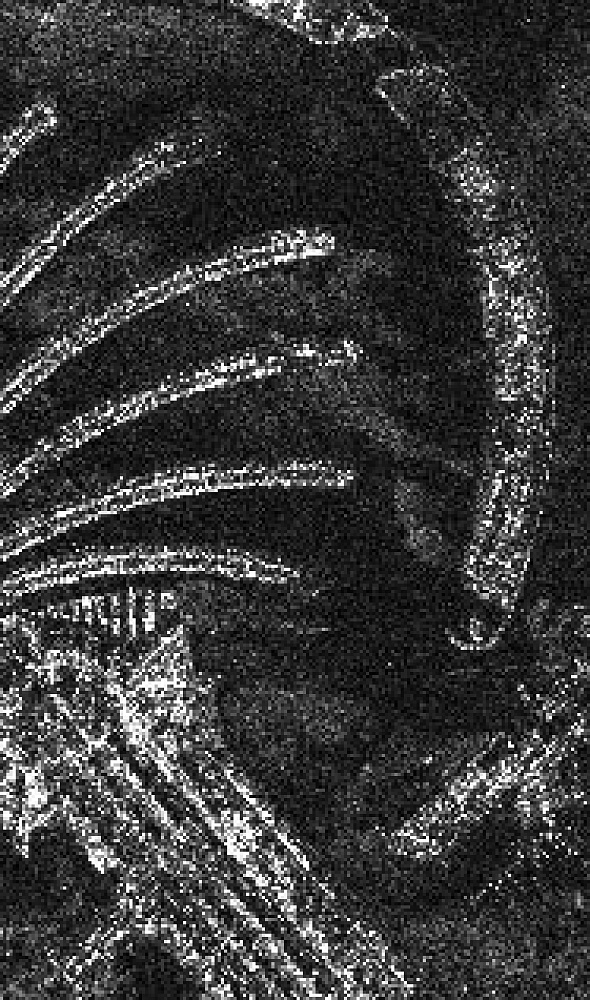
Optical and radar images are used to monitor oil spills; SAR sensors are used more widely because they operate in any weather. Interpretation accuracy depends on biogenic elements that produce false-positive spill signatures.
RS data make it possible to minimise marine field work, promptly localise the scale of impact, assess the effect on ecosystems and shorten timelines thanks to coverage. SAR technology is recognised as the most effective for detecting and mapping spills thanks to high spatial resolution and all-weather sensors.
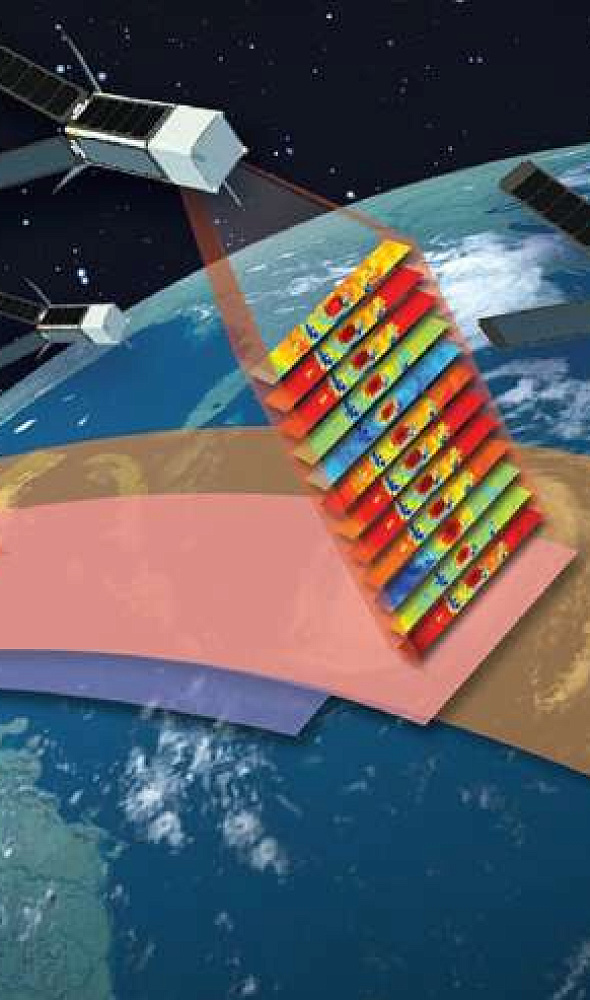
Automation of RS material processing relies on AI and neural-network algorithms over a large water area. Identification of oil pollution follows methods adopted by the European Space Agency; additionally the IR and visible ranges from MODIS radiometers (Terra and Aqua satellites) and near-surface hydrometeorological information are analysed.
An oil-slick drift forecast requires radar satellite images. Microwave emission of spaceborne radar (3.1 cm, X-band — 23.5 cm, L-band) has high penetrating ability: the survey does not depend on cloud, fog or smoke and is also used to detect underground utilities.
Radar imaging uses an autonomous radiation source and yields images at night. Combined with all-weather capability this increases the volume of information and provides regular monitoring of the water area.
Besides oil pollution, a radar image yields ship and ice conditions and fields of near-surface wind speed and direction at the time of acquisition.
Satellite radar monitoring technologies for oil pollution are part of operational response systems. The first approach is operational monitoring of coastal waters and territorial waters (Norway, the USA, Canada and others).
In Norway the system combines satellite and airborne monitoring: reception, processing and analysis of radar information, comparison with AIS data, interpretation with a confidence degree (high, medium, low) and transfer to the Norwegian Pollution Control Authority (SFT). The coast service dispatches a patrol aircraft. In Canada and the USA a similar system operates within ISTOP (Integrated Satellite Tracking of Oil Pollution).
Drawbacks of the approach: relatively high system cost, the probability of false alarms or missed real spills in automated processing; as a rule, modelling of pollution-spread dynamics is not provided.
The second approach is integrated GIS monitoring systems: collection of archival and new radar images with additional sources in a single geoinformation system (CleanSeaNet, PRIMI and other programmes in EU countries).
Methodology stages: preliminary image processing (radiometric correction, orthorectification); detection and outlining of spills with attributes (including in ERDAS IMAGINE); extraction of the near-surface wind field, ship and ice conditions; connection of hydro and meteo data, AIS and infrastructure; integrated GIS analysis and rejection of “false pollution” (slick-forming phenomena); optionally — transfer of results to response bodies via a web portal.
A monitoring system with a lag of about 4 hours (as of 2022.12) makes it possible to control the situation on site and analyse the presence of spills n years earlier. In 2014 INNOTER, under contract No. 003/C-I-14 of 23.01.2014, selected, ordered, pre-processed and delivered radar images of the Caspian Sea for the National Academy of Aviation of Azerbaijan and provided training in ERDAS Imagine, including monitoring of the Oil Rocks platform.
A quote requires exact geographic coordinates of the object. Software: GIS — QGIS, ArcGIS and others; processing — ERDAS, ENVI SARscape, SNAP and others.
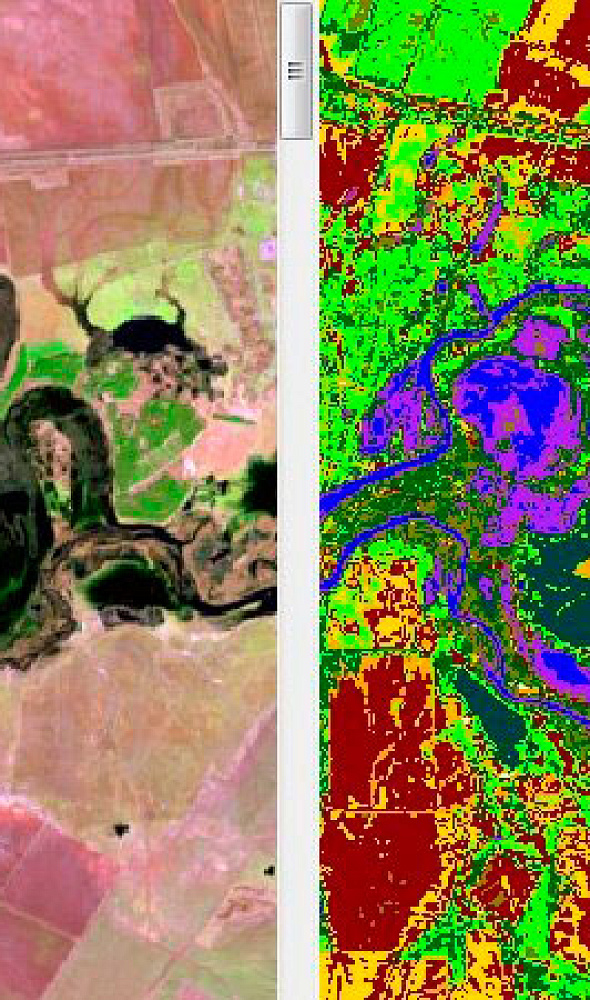
At the execution stage a very-high-resolution multispectral satellite survey and SAR are performed; primary processing of the radar image; photogrammetric processing — fused images, orthorectification and orthomosaics with georeferencing accuracy corresponding to scale 1:5 000 and overview products down to 1:200 000 or more if required. Additionally, sea-surface temperature, chlorophyll-a and suspended-matter maps from the MODIS colour scanner are processed.
The field stage, if agreed: sampling, chemical-analytical control; lakes of at least 1 ha are surveyed, including intra-bog lakes and oxbows. Acquisition and processing of satellite images, DEM, orthorectification and mapping — by GEO INNOTER LLC; field work and chemical-analytical studies — through local partners.