Completed works
Taking pictures
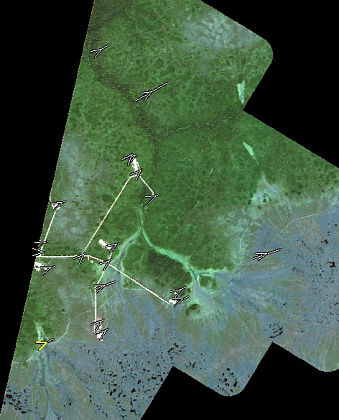
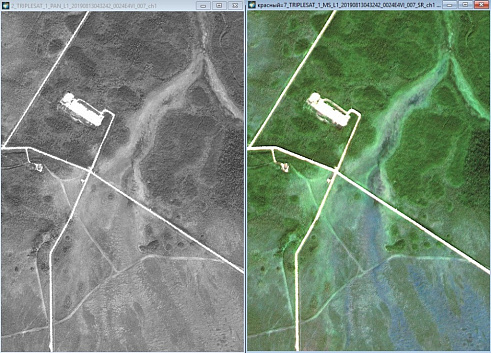
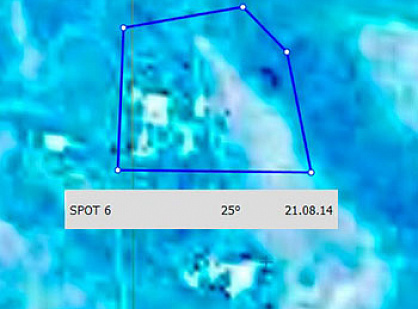
To decipher the oil pollution of the license areas (LA), space images TripleSat and SPOT were used, which have a resolution of 1.5 m in the panchromatic channel and 6 m in the multispectral one. Remote sensing data were supplied in several batches as they were captured during August-September 2019.
Image processing
Further, the obtained TripleSat and SPOT images are sent for processing, which consists of the following stages:
- Initial processing of the images
The process of primary processing
- Radiometric correction;
- Geometric correction;
- Atmospheric correction-to eliminate the negative influence of the atmosphere on the results of decryption;
- Pansharpening – to increase the readability of the image
Orthorectification – to improve the spatial accuracy of the picture;
The process of orthorectification
- Overlay of space survey materials on the DEM to eliminate the influence of terrain;
- Color correction of images during the infectious period
- Cross-linking images with a single canvas and cutting them according to the customer's requirements.
Spatial resolution improvement process
The process of processing one image, depending on its size, takes from half an hour to 3 hours. A total of 42 TripleSat satellite images and 26 images from the SPOT satellite were used in the project.
Method selection
Test decryptions were carried out to select a more optimal and accurate method. Various methods of classification with training (Spectral Angle Mapper, Maximal Likelihood, etc.), spectral indices (NDVI, etc.), color synthesis options, etc. were tested.
The most accurate method, in our opinion, is visual expert interpretation by specialists in the field of Earth remote sensing (ERS). Since the use of classifications reveals a large number of false objects that are not of practical interest. For the decoding process, various combinations of spectral channels in combination with the NDVI index were used. This index allows you to identify potential areas of oil spills and oil pollution of soils and water bodies. The following software was used to carry out the project: Scanex IMAGE Processor, ENVI, QGIS and ArcGis.