Sat-Sun: Non-working days
Customer
Private French environmental organizationProject's objective
Identification, assessment of the volume and nature of the displacement of oil pollution near the seaport of Marseille.Work description
Initial Data:
Currently, remote sensing methods are the primary means for detecting film pollution in water bodies, and radar satellites with synthetic aperture are the main instruments for detecting oil films at any time of day and regardless of weather conditions. The main challenge in such monitoring is the lack of data with a short time interval between captures. This is important for assessing the speed and direction of oil spill movement, accurately identifying the cause of the occurrence, and responding promptly. Satellite data from Sentinel satellites allow for the assessment of the water body's state with the necessary time interval, as the time difference between the passes of two radar satellites is approximately 12 hours.
The object of the study was the waters of the Gulf of Lion, a part of the Mediterranean Sea off the southern coast of France. The depth of the gulf mainly ranges from 50-100 meters. Currents in the gulf depend on wind patterns, freshwater runoff, and seasonal warming. The main circulation of water is driven by the Northern Current. The city of Marseille is located on the northeastern coast of the Gulf of Lion. It is the largest port in the Mediterranean and the second-largest city in France. The main cargo traffic consists of oil and petroleum products, with an annual turnover exceeding 110 million tons. Such activity contributes to the formation of film pollution in the water bodies.
The basis for the study was three images obtained from Sentinel satellites: two from radar satellites Sentinel-1B, 1A, and one from the optical satellite Sentinel-2A. The advantage of these data was that they were taken almost exactly 6 hours apart. All three scenes had an equal spatial resolution of 10 meters. Another important source of information for the study was the portal meteoblue.com, which provided data on wind speed and direction.
Work Performed:
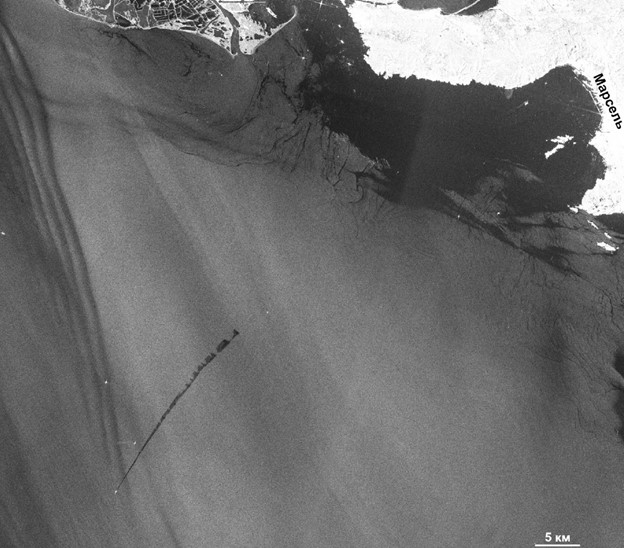
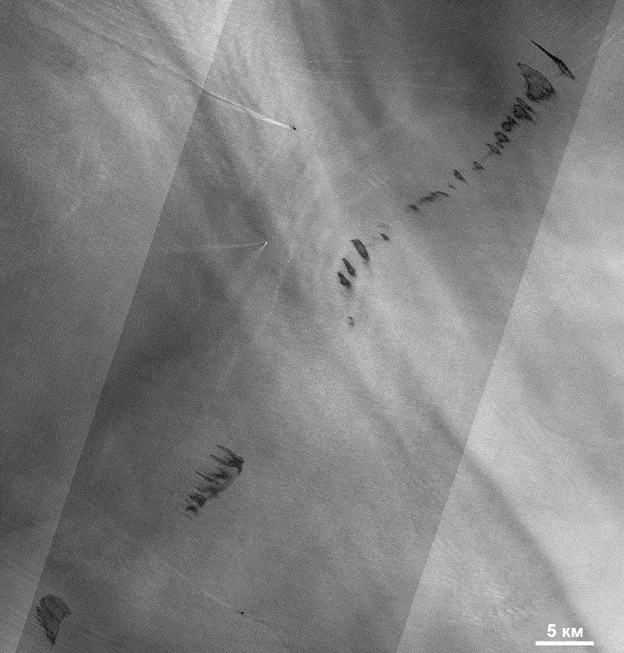
In the first image from the Sentinel-1B satellite, obtained at 05:43, a discharge of waste containing petroleum products was detected. In the radar image, the vessel from which the discharge was made and the contaminating trail along its path are clearly visible. Considering the average speed of the vessel, it can be concluded that the discharge lasted for almost an hour. Also, having this information, it was possible to calculate that the first spot at the start of the discharge reached a width of 682 meters, indicating a speed of 19 cm/s. Approximately 6 hours later, an image in the optical range was obtained from the Sentinel-2 satellite. This image clearly shows that the discharge was carried out in four stages, three of which were not captured in the first radar image. The total length of the waste discharge was almost 35 km.


Fig. 2 Example of a fragment from the Sentinel-2A satellite image. Manifestation of oil spots 6 hours after the start of discharge.
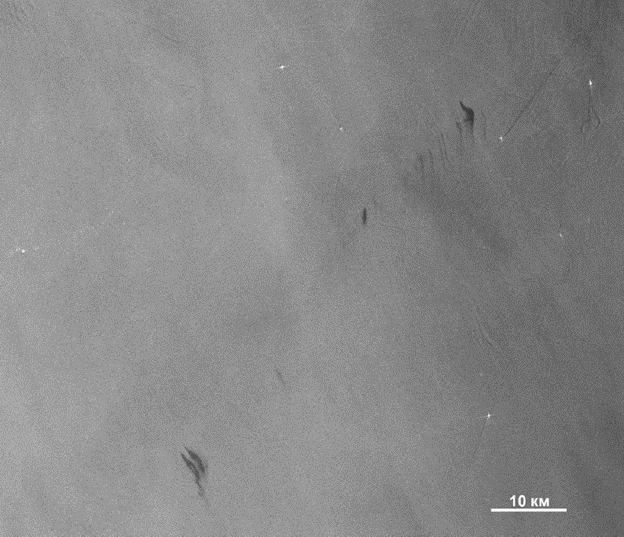
Twelve hours after the first one, the second radar image was obtained from the Sentinel-1A satellite. The discharge detected in the first image was still present in the water body area.

Fig. 3 Example of a fragment from the Sentinel-1A satellite image. Manifestation of oil spots 12 hours after the start of discharge.
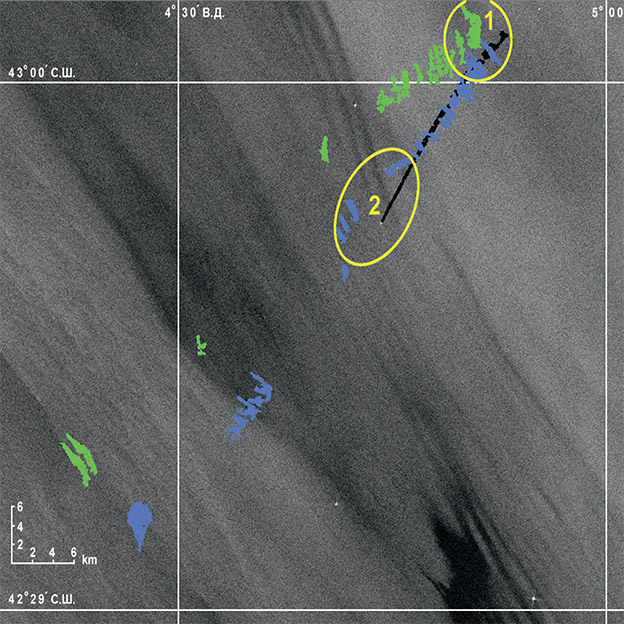
For the study, it was important not only to identify the pollution but also to assess the spread speed and drift of the pollution over the sea surface. For this purpose, surface pollution areas were automatically highlighted in each image. Black color marked pollution areas in the first image (05:43), blue in the second (10:30), and green in the third (17:43). Comparing the 1st and 2nd images, attention should first be paid to the initial part of the pollution (area marked with number 1). Over six hours, these areas remained in place, indicating almost no drift; the spots only spread. In the second area, however, there is a sharp drift of 2.5 km. The sharp deviation could have been caused by strong winds combined with currents. Calculations showed that the drift speed was 14 cm/s.
Comparing the third image with the second, we see that the largest spot in the first area moved only 3 km over 13 hours, while its area increased from 0.61 to 2.24 square kilometers, with an average drift speed of 7 cm/s. The drift speed of the rest of the pollution parts ranged from 15 to 19 cm/s.

Fig. 4 Example of the consolidated picture of pollution spread in the Gulf of Lion.
Results
Based on Earth remote sensing materials, vector and raster maps of oil pollution in the Gulf of Lion were compiled. Statistical data on the progress of pollution changes was also transmitted. In addition, using data from the automatic vessel identification system, GEO INNOTER was able to identify the vessel responsible for the pollution based on information about its movement. Based on available data, a forensic examination was compiled*.*Under the terms of the contract, this information (all work results and the customer) is confidential.
Need for consultation?
Fill the form and we will contact you
