Examination of crop availability in the field and harvest period
Examination of crop availability in the field and harvest period
01
About the project
Industry
Agriculture
Customer
A co-owner of a Company owning agricultural land sued the Company's management for damages to the Company, specifically alleging theft of a winter wheat crop.
End date
11/11/2022
02
Project goal
A co-owner of a company that owns agricultural land has filed a lawsuit against the company's management, accusing them of causing damage to the company by stealing the winter wheat harvest. The opposing side in court claimed that the fields were not sown with wheat during the relevant period; instead, they were occupied by fallow crops with a short growing season, resulting in hay mowing and collection, not a harvest. Therefore, there were no grounds for compensation, and no damage was caused to the company by the management. The absence of a winter wheat harvest was also confirmed by witness testimony.
In search of the truth, the plaintiff's lawyers sought legal protection from GEO Innoter to help prove the presence of a winter wheat crop on the farm's land during the relevant period using satellite images. The value of the disputed subject, whether there was a harvest or not, was approximately 30+ million rubles.
Task
Identification of the condition of the winter wheat crop using the Normalized Difference Vegetation Index (NDVI) based on satellite images.
GEO Innoter specialists selected 12 (twelve) archival satellite images from Sentinel-2 (from autumn 2019, and spring, summer 2020) and a high-resolution satellite image from Superview (China) for summer 2020, confirming the technical feasibility of providing the service.
The following questions were prepared and agreed upon for the expert:
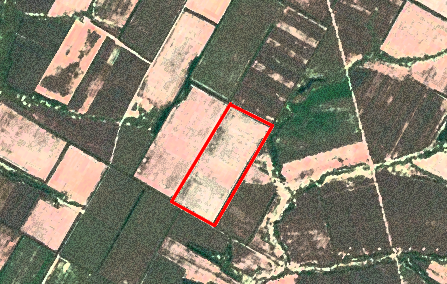
Conduct a search for the land plot;
Conduct a comparative analysis of changes in the satellite images of the considered plots on the agreed dates:
Presence of stubble or crop residues;
Presence of winter wheat crops;
Presence of winter wheat shoots;
Confirmation of the harvest.
pshen2.jpg
03
Completed works
The main tool for this expert examination is the vegetation index (NDVI). This indicator can show the presence of plants and the stage of vegetation they are in. The index is obtained based on the interaction operation with different spectral ranges of remote sensing data. Plants absorb the red zone of the spectrum with their green mass and reflect the near-infrared. The resolution of the satellite images was 10 meters per pixel, and the wheat field had an area of 620 hectares. The scale of the images allowed us to observe the main stages of plant development.
Using higher resolution imagery on the site can help determine the presence of weeds or diseases, assess germination and plant growth, and even predict the productivity of crop rotation fields.
The main goal was to track the growth and development dynamics of the crop and determine the harvesting time.
We took satellite images from March-April 2020 and June 2020. The processing of the satellite images and measurement of the vegetation index were carried out in several software packages. Preliminary operations were performed in QGIS (version 3.24.2) and ENVI (Harris).
The image preparation consisted of the following tasks:
Finding and extracting the required plot from the entire area;
Combining panchromatic and multispectral channels to obtain a high-quality color image;
Atmospheric and radiometric corrections;
Performing geocoding, or tying the image to the global coordinate system WGS 84 (resulting in each pixel on the image corresponding to the required points on the ground).
This level of processing is necessary for quantitative and qualitative analysis based on NDVI. It is important to understand that atmospheric correction helps reduce error when assessing the vegetative state of vegetation in the fields.
The NDVI measurement was performed in the ArcGIS (ESRI) program.
NDVI values in the images from August and September clearly showed that the fields had no vegetation and the level of vegetation was absent.
NDVI values in the images from October showed that there was vegetation on the fields and the vegetation level on each field was high.
During the spring period, it was established that at that time the field had wheat seedlings in the tillering phase, not crop residues or stubble (which are plant residues that improve soil fertility). At the end of May, the analysis of satellite images showed a high level of vegetative activity. This means that the wheat was in the stem elongation and heading stages.
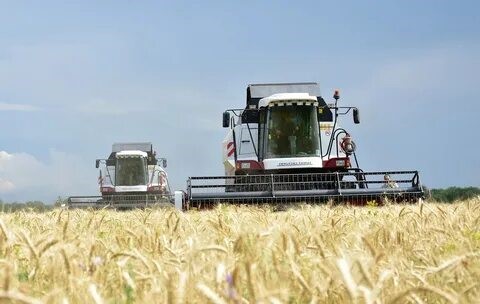
The images from early June 2020 showed us the harvesting process during this period. The use of high-resolution images allowed us to decipher the traces of agricultural machinery in the fields during the harvest period.
Thanks to the spectral method of satellite image analysis, GEO INNOTER specialists deciphered the period of winter wheat sowing, seedlings, growth, crop ripening, and harvesting.
снимок 1.png
снимок 2.png
04
Result
The client proved their case regarding the presence and harvesting of the winter wheat crop, confirming property damage of over 30 million rubles.
This type of evidence has 100% accuracy and is less financially and labor-intensive compared to other types of examinations. This method of data description allows for the analysis of events from almost any time in the past and has a short turnaround time of about two to four weeks.
Thanks to our specialists, the client received an expert examination with legal validity in court in a short time and at minimal cost.
Key Success Factor
The key factors for the success of our legal practice include a large number of highly qualified specialists with relevant higher education, the use of high-quality remote sensing data, the improvement of data processing methods, and the application of new technologies in the space sector.
Expert Opinion
The quality and effectiveness of the expert examination in resolving the legal dispute are confirmed by the fact that our expert was summoned by the investigator the day after our phototechnical examination was officially handed over by the lawyer to the investigator. Instead of refusing to initiate a criminal case, as it was heading, the investigator acknowledged the presence of the crop, which the Defendant had denied and which was confirmed by witness testimonies, and recognized the fact of crop theft. The involvement of the defense - GEO INNOTER lawyers, equipped with satellite image spectral deciphering technology, their own remote sensing image analysis laboratory, and certified specialists and experts - allowed for a turnaround in the case!
Need satellite imagery or help choosing the right data?
Describe your task, area of interest, and desired outcome. We will check data
availability, assess new acquisition options, and propose the optimal solution in terms of timelines, cost,
and quality.
Fast feedback during business hours
We will select the best data for your task
Confidentiality guaranteed
Discuss the project
clients who trust us
25+ years in the geodata market
Мы используем Яндекс.Метрика и собственные Сookies для обеспечения наилучшего
опыта работы на нашем сайте, персонализации сайта для наших пользователей и аналитики.
Продолжая использовать сайт вы соглашаетесь с условиями
Пользовательского соглашения.
Request a call
Leave your contact details — we will get back to you during business hours, clarify the task and suggest suitable data or services.
Write to e-mail
Send a message, technical specification or task description. We will review your request and reply to the specified e-mail.
Fill in the order form
Describe the area, object and imagery requirements. We will check archive availability, the possibility of a new acquisition and offer a suitable option.
Order software
Order TK
Your application is accepted
We will contact you during working hours.
Выбрать город
Россия
Другие страны
Белоруссия
Contact via WeChat
Feliks Fokin
Open WeChat and scan the QR code to add the contact. On a phone, save the code and select it in the WeChat scanner.