01
About the project
Identification of gold-prospective zones in Kazakhstan
| Industry | Geology and mining |
|---|---|
| Customer | Trade secret |
| End date | 03/31/2020 |
Identification of gold-prospective zones in Kazakhstan
| Industry | Geology and mining |
|---|---|
| Customer | Trade secret |
| End date | 03/31/2020 |
Area localization promising for the discovery of gold mineralization in Kazakhstan
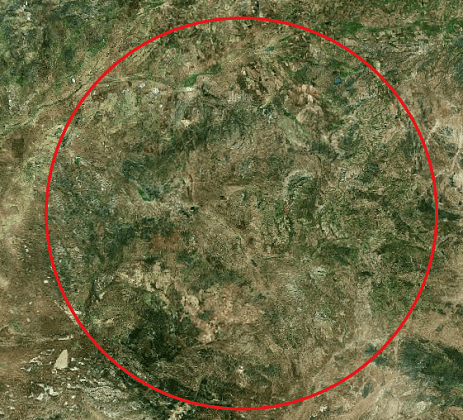
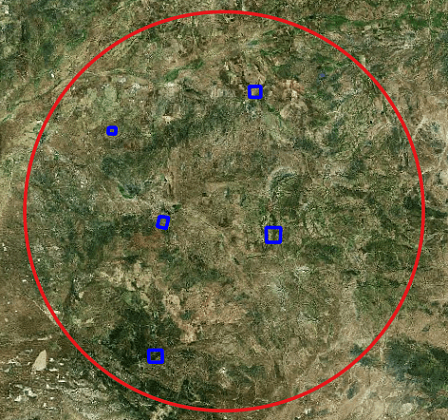
The work was carried out within a radius of 100 km from the objects of interest of the customer, so the total area of the study was 31.4 thousand square meters. km (Fig. 1).
At the first stage, the study area was analyzed using publicly available satellite images of low spatial resolution ASTER to localize the area of prospecting for gold mineralization. The most promising plots with an area of hundreds of sq. km, on which a more detailed study was carried out using more accurate data from satellite imagery of ultra-high spatial resolution WorldView-3 . At this stage, all kinds of geological materials about the work area were aggregated and analyzed. Structural interpretation was carried out on a scale of 1: 200,000 - 1: 500,000, including lineament analysis (selection of linear, circular and arc zones). Spectral interpretation by groups of reference minerals was carried out. The most common and reliable mineralogical indices have been constructed.
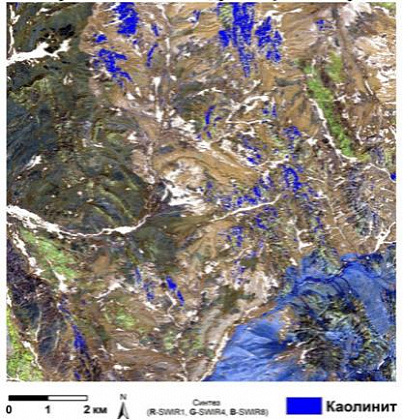
At the second stage, a highly qualified team of Innoter LLC specialists with consulting assistance from DigitalGlobe specialists performed a more in-depth analysis of the promising territory on a large scale, selected at the first stage (Fig. 2). Even smaller ones, with an area of less than 1 sq. km of sites for which recommendations were given for the organization of ground geological prospecting works.
The analysis was carried out by spectral decoding of WorldView-3 images. From the spectral methods used the classification by the method of spectral angle, the construction of mineralogical indices. An automated search for reference minerals was carried out.
We have localized areas that are promising for gold, thereby reducing the search area by more than 99%. Areas for setting up drilling and geochemical sampling with an area of less than 1 sq. km are offered for field verification in the next field season.







Feliks Fokin

Open WeChat and scan the QR code to add the contact. On a phone, save the code and select it in the WeChat scanner.