Sat-Sun: Non-working days
Customer
Trade secretProject's objective
Monitoring and Evaluation of Green Plantations to Improve the Environmental Situation in Moscow.Monitoring and assessing the state of green plantations is an indicator of urban environmental well-being.
The presence of accessible and healthy green plantations is an integral part of the quality of life in cities. Vegetation reduces air pollution, provides shade, contributes to temperature reduction, serves as a habitat for birds and animals, shields from the wind, and performs recreational and aesthetic functions.
Due to the increasing pace of urbanization, the number of vehicles, and the presence of industrial facilities, the quantity of green plantations is decreasing, while the accumulation of solar energy is increasing, leading to rising temperatures, increased carbon dioxide, nitrogen dioxide, and other pollutants in the atmosphere.
Open and green spaces not only improve living conditions but also play a crucial role in helping people adapt to the adverse effects of extreme weather events, combat urban heat islands, mitigate flood consequences, preserve biodiversity, and reduce average daily temperatures.
Green areas also contribute to carbon sequestration, minimizing air pollution's impact, and aiding in groundwater replenishment.
Although urban green plantations offer social, environmental, and even economic benefits, they rarely receive priority in urban master plans. Particularly as cities grow, it is essential for green plantations to grow in parallel because rapid urbanization and increasing demand for developed areas lead to the reclamation of open territories or their use for construction. This, in turn, leads to environmental degradation.
Project Objectives:
- Obtaining quantitative information about the areas occupied by green plantations;
- Screening assessment of vegetation status based on the NDVI index throughout the territory of Moscow;
- Identification of areas where vegetation is drying out and invasive plant species are proliferating;
- Evaluation, based on spectral indices, of the state of green plantations, protected natural areas, and green spaces in the city of Moscow;
- Analysis of changes compared to the previous year (analysis of the temporal dynamics of indicators).
Work description
Source Materials for the Project – Satellite Imagery Obtained During the Vegetation Period:
Sentinel-2 data with spatial resolutions of 10 and 20 meters were used in addition to very-high-resolution satellite images captured by the Jilin-KF01B spacecraft with a spatial resolution of 0.5 meters.
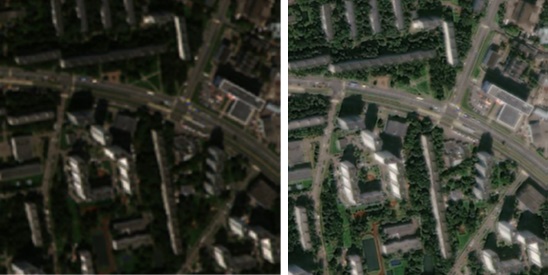
Fig. 1. WorldView-3 Image Fragment Before (Left) and After (Right) Pansharpening Procedure
For reducing distortions caused by terrain and imaging conditions, an orthotransformation procedure was performed using a digital elevation model (DEM) and rational polynomial coefficients (RPCs). Subsequently, to precisely delineate classes of woody-shrub and herbaceous vegetation, pansharpening was conducted – enhancing the spatial resolution of spectral channels by merging panchromatic and multi-spectral images.
Special indices obtained from arithmetic operations on the raster data set's channels were used as analysis tools, including:
NDVI - Normalized Difference Vegetation Index
NDVI is an index that assesses the amount of green vegetation. The index normalizes the scattering of green leaves in the near-infrared range with the absorption of chlorophyll in the red wavelengths.
The range of NDVI values is from -1 to 1. Negative NDVI values (values approaching -1) correspond to water. Values close to zero (from -0.1 to 0.1) typically correspond to barren areas of rocks, sand, or snow. Low positive values represent shrubs and pastures (from 0.2 to 0.4), while high values indicate moist forests in temperate and tropical zones (values approaching 1).
NDMI - Normalized Difference Moisture Index
The methodology for conducting the work is as follows:Stage 1: Obtaining the Required Data and Data Processing
The work was conducted within the administrative boundaries of the city, covering an area of 1770 square kilometers.
At the first stage, medium spatial resolution Sentinel-2 satellite images (10 and 20 meters) were selected, and new images were captured from the Jilin-KF01B satellite with a spatial resolution of 0.5 meters (very-high spatial resolution).
After the satellite imaging and retrieval of archival materials, the remote sensing data (RS data) were processed, including orthotransformation, atmospheric correction, and pansharpening.
Stage 2: Creating Digital Thematic Cartographic Layers
Vector layers depicting the distribution of woody-shrub (WS) and herbaceous vegetation (HV) were created based on the Jilin-KF01B images. Classification with supervised learning was employed to generate these layers.
Supervised machine learning methods involve training a model to work with a set of features and predict labels using a dataset that contains some known label values.
Classification is a form of supervised machine learning where the model is trained to use features (x) to predict a label (y), which calculates the probability that an observed case belongs to one of several possible classes and predicts the value of the corresponding label.
The primary method of interacting with satellite imagery involves extracting classes of information from multi-channel raster images. Thematic maps were created using the resulting raster.
In the classification of raster images with supervised learning, an algorithm needs to be constructed that can classify and separate an object from the overall set. The entire classified set of objects is the training sample.
Subsequently, the qualitative state of vegetation was assessed based on the NDVI index. The NDVI index, derived from satellite images, was classified into 4 classes of vegetation quality (good, satisfactory weakened, satisfactory severely weakened, unsatisfactory).
NDVI, in combination with a false-color index, allowed for the identification of areas of woody-shrub vegetation drying out. Additionally, false-color images and image classification were used to identify areas of the spread of the Sosnowsky's hogweed.
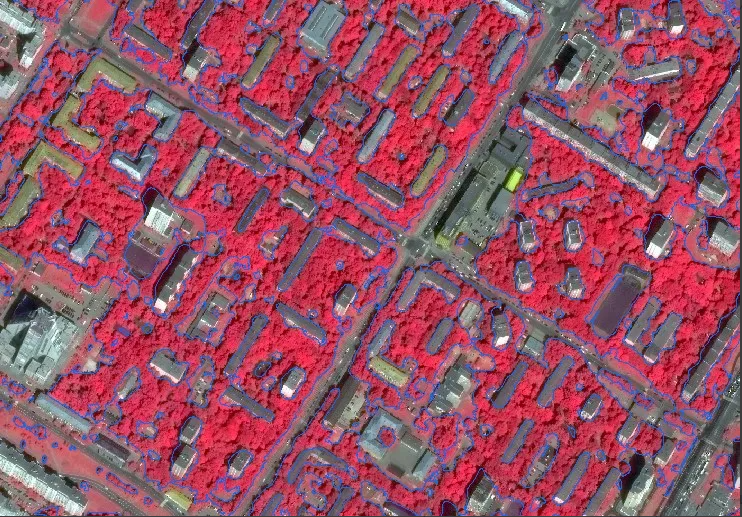
Fig. 2 Example of Woody-Shrub Vegetation Layer Fragment
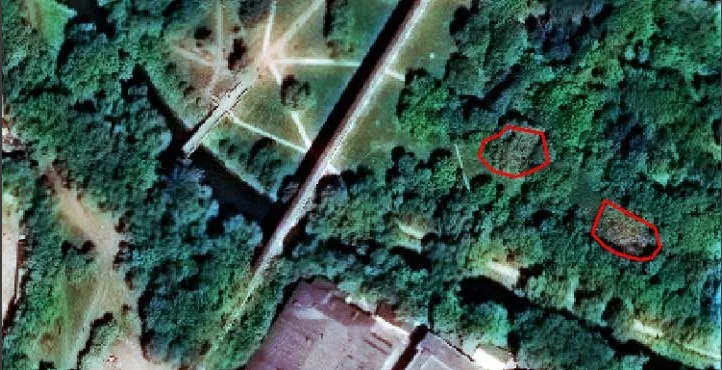
Fig. 3 Examples of Woody-Shrub Vegetation Drying Out Areas

Fig. 4 Examples of Woody-Shrub Vegetation Drying Out Areas on KOMPSat-3 Image
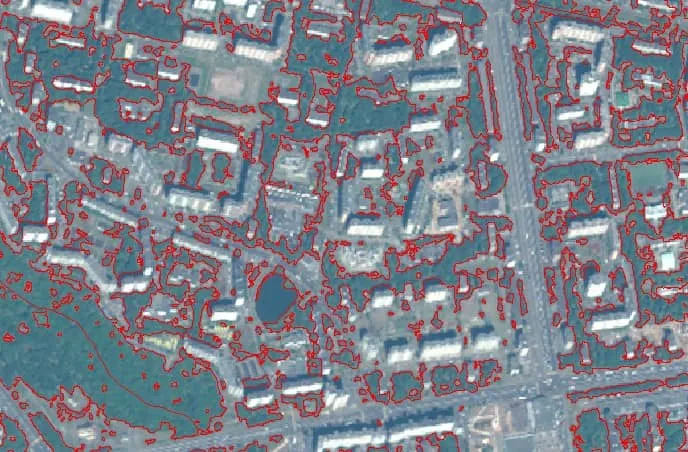 Fig. 5 Fragment of Obtained Woody Vegetation Layer
The created digital cartographic layers were georeferenced to the Unified State Cartographic Base of Moscow (EGKO) at a scale of 1:10,000.
Stage 3: Ground Verification
Ground verification was conducted to confirm and verify the results obtained from the analysis of remote sensing data (RS data).
NDVI, NDMI, and ARI indices were computed from Sentinel-2 images for June and May using ArcGIS (ESRI) software. The obtained indices and the dynamics for May and June were analyzed in detail.
Ten points were selected for field inspection of vegetation to verify its condition on-site, as determined by the NDVI index. Different qualitative states of woody-shrub vegetation were delineated based on the indices. An analysis of vegetation distribution in various qualitative states across administrative-territorial divisions was conducted. Areas where green vegetation experienced the greatest stress were identified. Cartographic materials were created based on the obtained data.
Results
Assessment of vegetation quality based on the NDVI index has been conducted:
- Creation of a digital cartographic layer, raster image, and vegetation status cartograms taking into account the type of green areas, divided by districts;
- The calculated NOVI index is distributed into 4 classes of quality (good, satisfactory weakened, satisfactory heavily weakened, unsatisfactory) in accordance with the requirements of regulatory acts of Moscow;
- Threshold values for classes have been determined through field verification;
- Areas with clear-cutting have been identified, and a retrospective analysis has been conducted.
Areas of drying of woody and shrub vegetation have been identified:
- Digital cartographic layers and maps of areas of vegetation drying have been created, taking into account the type of green areas;
- Areas of drying have been identified through visual expert decoding of a pseudo-color synthesis image in combination with the calculated NDVI index;
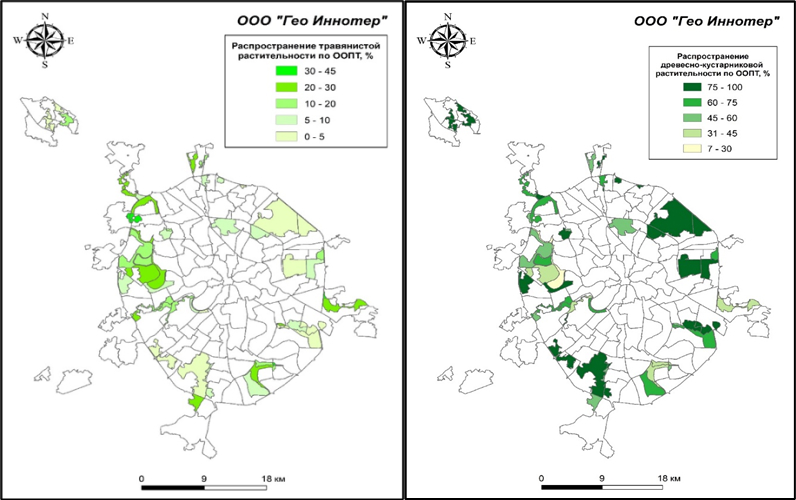 Fig.6 Example fragments of woody and shrub vegetation drying areas
Areas of invasive plant species spread have been identified:
- Digital cartographic layers of areas of invasive plant species spread (using the example of Sosnovsky's hogweed) have been created, taking into account the type of green areas.
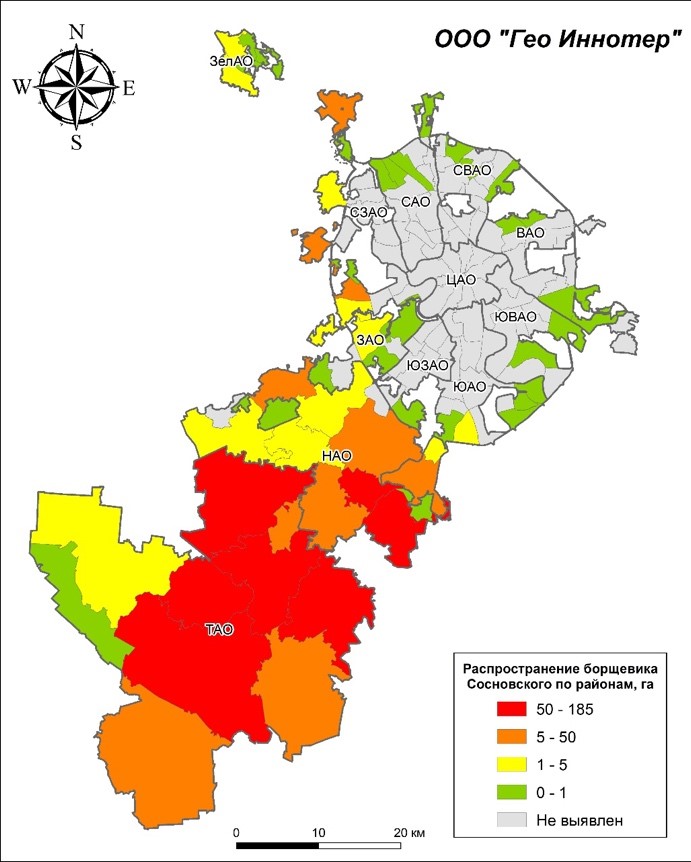
Fig.7 Spread of Sosnovsky's hogweed by districts
The aforementioned work allows for monitoring the condition of green areas at both the state and municipal levels, tracking clear-cutting, drying areas, and plant disappearances. It also enables the prompt elimination of causes for deteriorating the city's environmental condition and the correct reorganization and adjustment of urban planning policies.
The work conducted has allowed for assessing the dynamics of green areas development, and the results have been used in planning and locating new green areas and identifying problematic areas.
The combination of classifying remote sensing materials, assessing landscape indicators, and vegetation indexes provides a tool for evaluating the quality of life and trends in urban areas.
Need for consultation?
Fill the form and we will contact you
