of geospatial solutions
Sat-Sun: Non-working days
Project's objective
Approbation of multispectral remote sensing to improve the efficiency of prospecting in open areas at the forecast stage.Work description
Complex expert-computer analysis of space imagery results and geological and geophysical information was performed and the following types of work were performed:- Collection, systematization, analysis of remote sensing data (from Terra, Landsat-7, Landsat-8, SPOT-6, SRTM, WorldView-2, 3 and other satellites) accepted by the Customer for creation of mineralogical maps.
- Creation of distance bases (based on remote sensing materials) with resolution of 10-15 m/pix, scale 1:100 000 and their interpretation.
- Creation of a three-dimensional model of a given territory.
- Performing structural interpretation of space images of the given territory on the scale of 1:100,000.
- Spectral interpretation of space images of the given territory on the scale of 1:100 000.
- Selection of a reference library of spectra of minerals and rocks of near-ore alteration zones for a known deposit/ore occurrence, selection of the most informative indicator minerals.
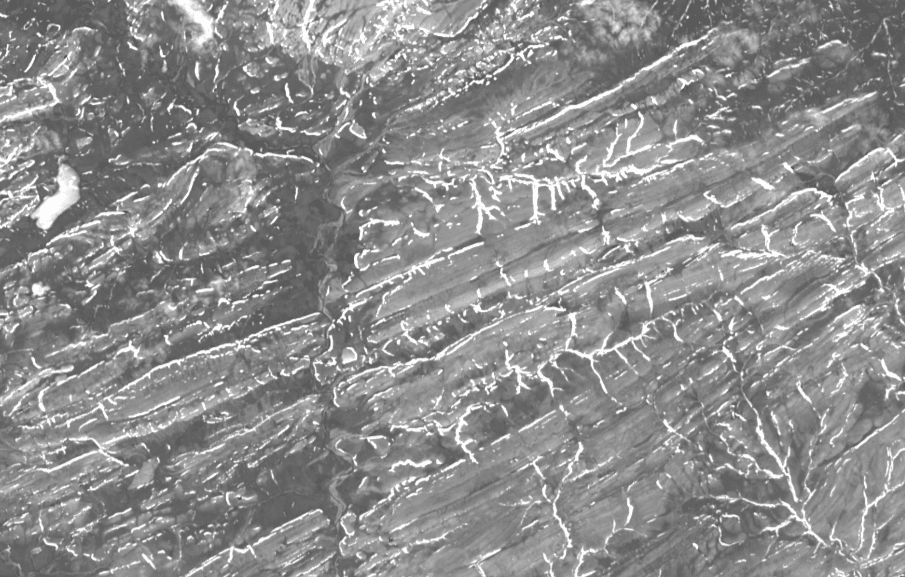
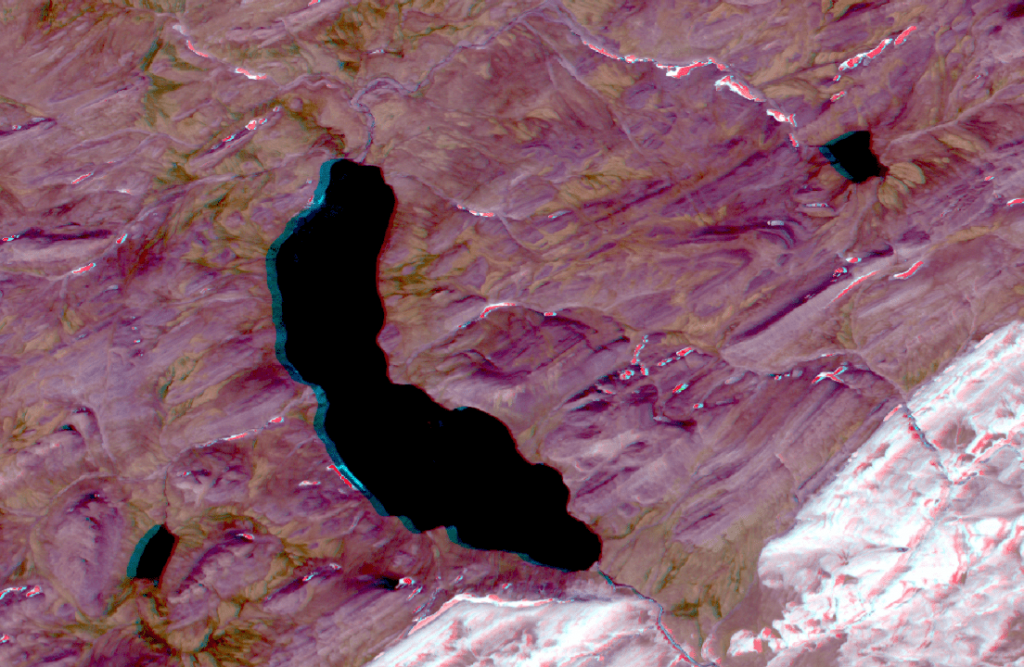
- Creation and interpretation of hyperspectral remote sensing of a detailed area with a resolution of 0.5-2 m/pix, area of 120 km2 at a scale of 1:25,000. Construction of anomaly schemes (including complex anomalies) created on the principle of analogies with the reference object.
- Development of a recommendation on the applicability of the research method for the folded area
Results
- 1. A comprehensive 1:100,000 scale remote sensing framework was created for the entire study area, with delineation of areas prospective for identification of PI deposits for further verification;
- 2. Collection, systematization, analysis of remote sensing data from Terra ASTER, Landsat-8, SRTM, WorldView-3, Sentinel-1 and others) to create mineralogical maps;
- 3. Creation of remote baselines (based on RS data) with resolution of 10 15 m/pix, scale 1: 100 000 and their interpretation;
- 4. Reference libraries of spectra of minerals and rocks of near-ore alteration zones were selected for a known deposit/ore occurrence, the most informative indicator minerals were selected;
- 5. Hypothesis about the proposed type of mineralization (gold-mercury-antimony formation, analogous to the Carlin type) was put forward;
- 6. Literature review of the experience of studying and forecasting of Karlin-type deposits was performed;
- 7. Conclusions were made about the probability of localization of this type of mineralization on the territory of the Customer.
1. Collection, systematization, and analysis of remote sensing data (Terra ASTER, Landsat-8, SRTM, WorldView-3, Sentinel-1, and others) for the creation of mineralogical maps.
A list of remote sensing materials optimal for solving the forecast tasks in the territory was compiled. After agreement with the Customer, it was decided to use Landsat-8 and (or) Sentinel-1 data as the cartographic basis for creating geological-structural schemes, in addition to ASTER and Sentinel-1. The result of creating remote bases at a scale of 1:100000 and their interpretation was the localization of a ore-prospective area favorable for the discovery of mineral resources (MR), as well as the selection and ordering of high-resolution WorldView-3 imaging (120 km2).
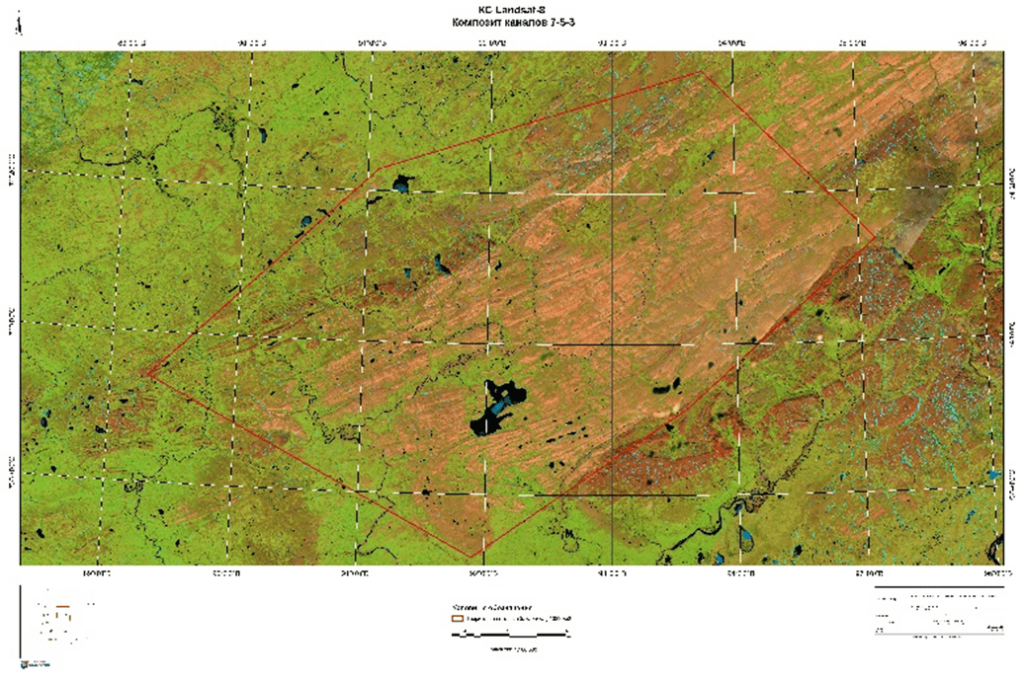
2. Creation of remote bases (based on remote sensing materials) with a resolution of 10‑15 m/pixel, scale 1:100 000, and their interpretation.
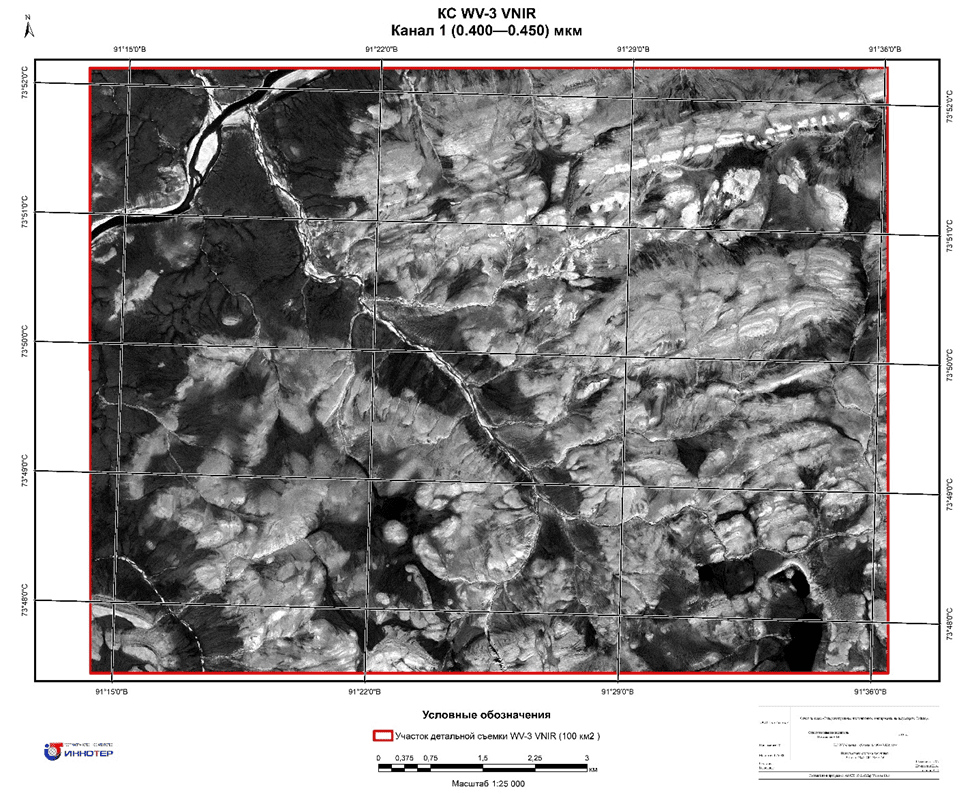
For the interpretation of the physical-geographical and geological structure, channel-based remote bases of ASTER and Landsat-8 satellite images were created at a scale of 1:100000. Channel-based remote base materials (CRBM) are satellite images consisting of a single channel. The necessity of creating channel-based materials lies in the fact that different surface features are visible in various spectral ranges. Channel-based materials based on ASTER and Landsat-8 data were prepared in ArcMap 10.6 software. Figure 3 shows a fragment of Landsat-8 CRBM channel 1.
In addition to channel-based remote bases, color-synthesized composites were created in both natural (RGB) and false colors. To create synthesized composites, three channel-based images are used, combined, and displayed in red, green, and blue colors.
3. Creation of a three-dimensional model of the specified territory.
To solve the task, an anaglyph image was created based on a prepared mosaic of Landsat-8 images in the WGS 84 / UTM zone 46N coordinate system. Figure 4 shows a fragment of the resulting anaglyph three-dimensional model.
Figure 5 presents a 3D model of the territory in the WGS84 coordinate system, created by synthesizing the geological base (maps tied to characteristic objects and coordinate grids in software for matching the map's coordinate system with the project's coordinate system) and the publicly available AW3D30 digital terrain model in the WGS84 coordinate system, with a grid cell size of 30x30m and a relative height accuracy LE90 greater than 10 m.
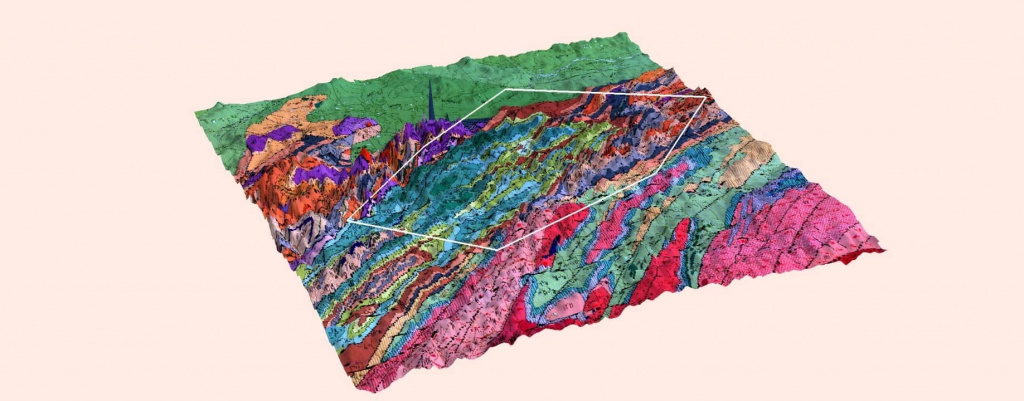
This illustration is informational in nature and allows for a visual assessment of the landscape of the territory.
4. Structural interpretation of satellite images of the specified territory at a scale of 1:100 000
To study the structural features of the area, formal and specialized lineament analysis of Sentinel-1 radar images and the digital terrain model (DTM) was carried out. Lineament analysis involved identifying lineaments by standard criteria and revealed a dense network of fault disruptions. As a result of the analysis, a scheme for interpreting linear elements was obtained, which variably manifest the traces of activation processes of interest.
Interpretation of numerous "composites" (synthesis, binarization, clustering, various filters) allowed for the visualization of individual discrete and areal landscape elements, as well as the establishment of generalized images of deep structures.
The structural-tectonic pattern, expressed in linear zones of surface heterogeneity predominantly trending northeast, aligns with the general trend recorded by geological data. The space structural scheme of the prospective area at a scale of 1:100,000 covers 11323 km2 of the Customer's territory. For illustrative purposes, a fragment is presented in Figure 6.
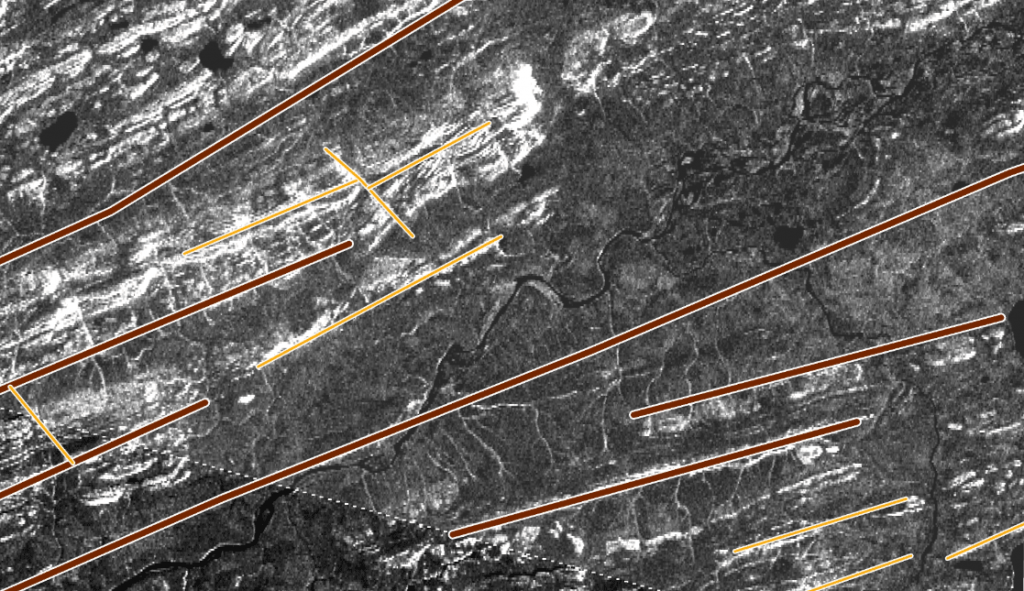
Faults trending northeast are clearly expressed in the relief, highlighted by the consistency of river valley directions, making them unambiguously interpretable from space imagery materials.
5. Spectral interpretation of satellite images of the specified territory at a scale of 1:100 000
By applying the spectral angle method (SAM) to ASTER images for the Customer's territory, areas of pyrite distribution were identified. Figure 7 shows a fragment of the final scheme of pyrite distribution zones using the spectral angle method, with a Sentinel-2 image as the base.
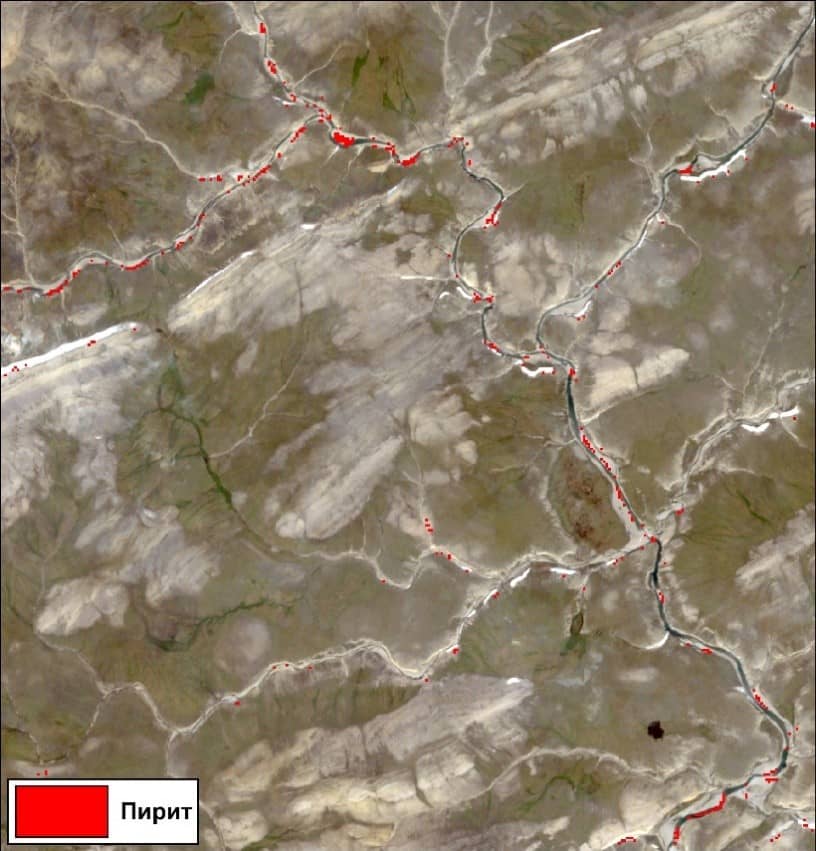
Figure 7 shows that pyrite distribution areas identified by the ASTER spectral library are associated with riverbeds. Most likely, these are zones of FeS2 and other minerals of the pyrite-marcasite family and the sulfide group.
Other minerals such as stibnite, cinnabar, realgar, etc., could not be detected using the spectral angle method with ASTER data. One reason for the low informativeness of the spectral interpretation results is the insufficient resolution (spectral and spatial) of the source images.
Figure 8 shows a fragment of the scheme of probable kaolinite distribution based on ASTER data in the Customer's territory.
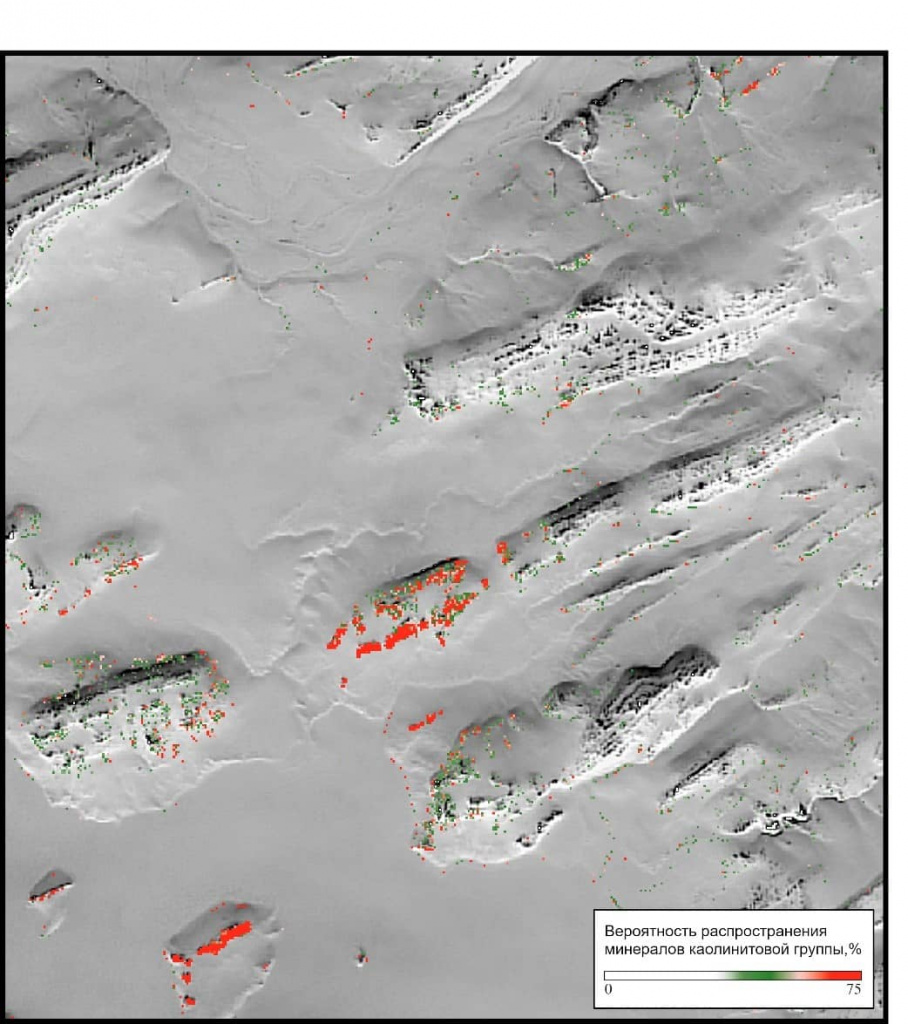
Minerals of the kaolinite group or clay minerals are highly diverse and widely distributed in the earth's crust. They are part of various clay rocks – pelitic, aleuritic, and partly marl. Kaolinite is often a product of the weathering of alumina-containing minerals (feldspar, nepheline, etc.) in igneous and metamorphic rocks, as well as in various ore and non-ore veins.
Minerals close to kaolinite in their spectral properties include dickite (a hydrothermal mineral often represented in ore formations as the nacrite modification).
Figure 8 demonstrates the validity and reliability of the method used, proving its applicability for identifying zones with the presence of the kaolinite mineral group.
Thus, high-altitude remote sensing data, processed by the methods mentioned above, confirm the effectiveness of the developed algorithms for determining the localization of prospective areas, particularly for identifying and localizing specific lithological types and minerals.
Need for consultation?
Fill the form and we will contact you
Sat-Sun: Non-working days