Sat-Sun: Non-working days
Project's objective
Approbation of remote sensing methods for searching for carbonate group minerals in the territory of the Eastern Province.
Work description
Insufficient research and exploration of the mineral resource base are the main obstacles to the social and economic development of countries.
For example, Zambia produces mainly minerals such as copper and cobalt. The Zambian copper deposits are being depleted and liquidated every year. The poor condition of the mines and the danger of collapse forces the closure of large deposits, which entails huge losses for the country's economy. The Kabwe lead and zinc mines and the Luanshya copper mines ended operations in 1990-2000, respectively, due to high recapitalization requirements. To support Zambia's socio-economic growth, new mineral deposits need to be explored and developed. One of the main factors hindering socio-economic development is the focus on one mineral raw material as the main source of income and the lesser importance of other potential resources.
Since 1920, an important impetus in the development of the mining industry in Zambia has been the extraction of minerals in the Copper Belt, which is in central Africa, in the north of Zambia, and in the southern part of the Democratic Republic of the Congo.
Zambia is one of the leading developing countries in terms of copper reserves. The main deposits are included in the Copper Belt of Central Africa. Most of the mining takes place for industrial and metallic minerals, and to a lesser extent for energy resources. Deposits of ores of gold and polymetals, muscovite, beryllium and graphite have been identified within the Honey Belt.
The extraction of industrial minerals in Zambia is just beginning to reach its potential. Throughout the entire period, the metallurgical industry, especially the extraction of copper and cobalt, was in the first place.
The privatization of the copper-cobalt industry encourages construction and infrastructure development, and as a result, the demand for industrial minerals has increased.
Minerals of the carbonate group are found throughout the country. Near the province of Lusaka, the southern part of the Central Province, as well as in the Eastern Province, there are large deposits of dolomite limestone. The Eastern Province was selected for analysis.
STUDY AREA:
Lundaz, Eastern Province of Zambia. The area of the district is 3068 sq. km.
At the preparatory stage, all possible geological maps for the territory of Zambia were analyzed. Later, a geological map was digitized, at a scale of 1:2,000,000. (Fig. 1).
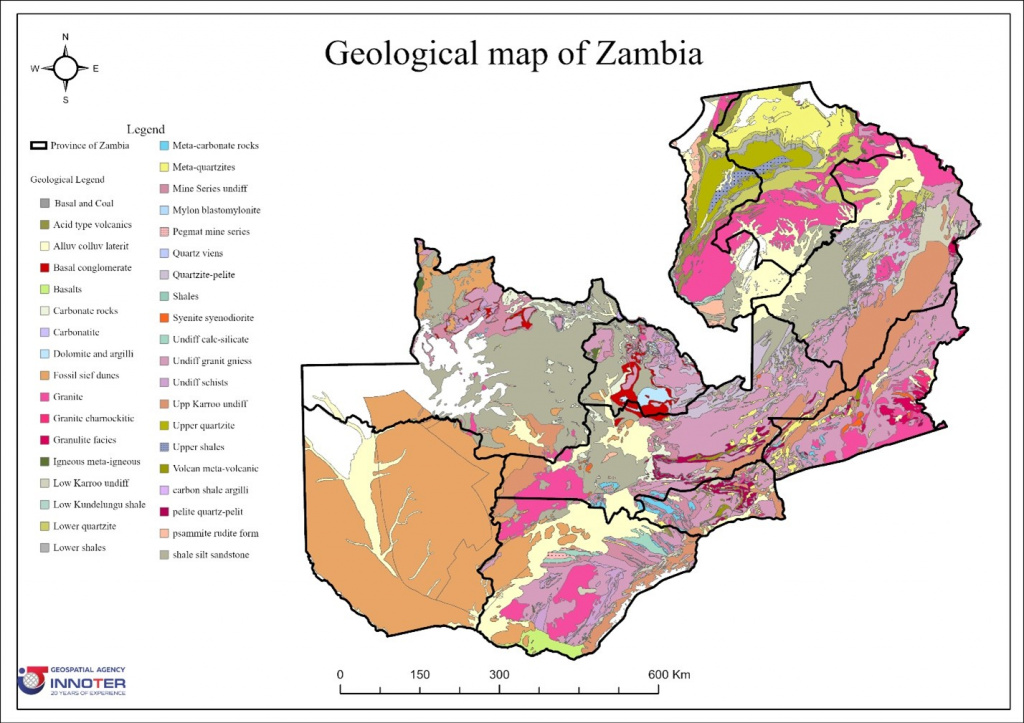
Figure 1. Geological map of Zambia
Publicly available ASTER satellite images were used for the initial analysis. The generated order for the entire Eastern Province of Zambia is loaded in batch mode. (fig. 2)
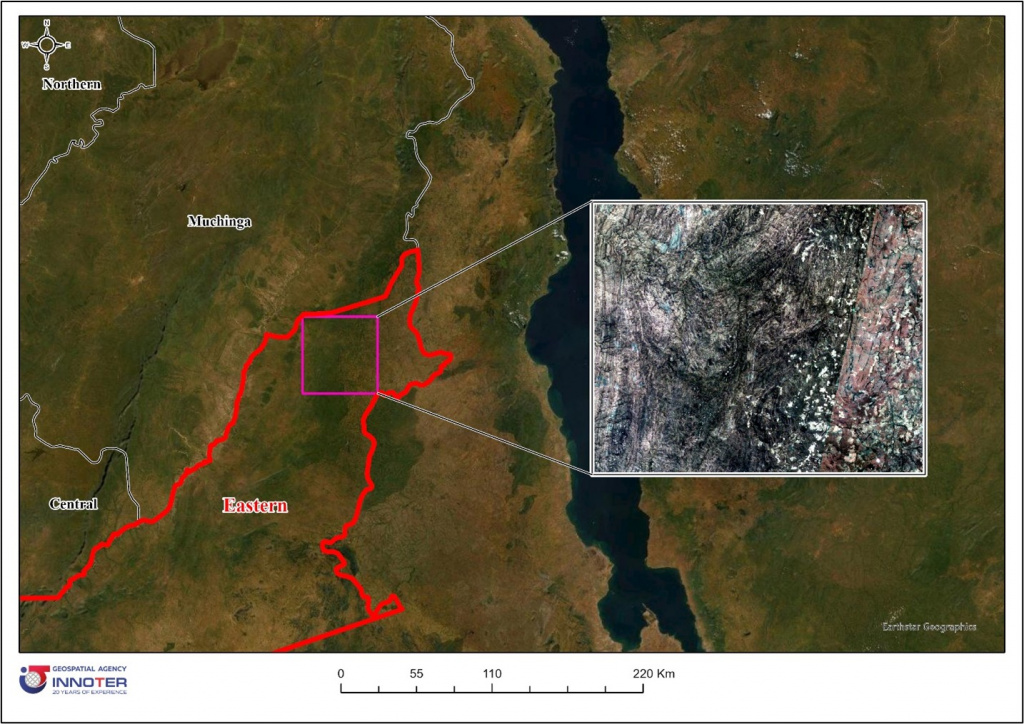
Figure 2. Study area
Each image has passed the mandatory assessment and initial processing, which includes:
1. Radiometric correction
2. Geometric correction
3. Atmospheric correction
Further, the areas on each satellite image were masked from shadows, snow, water, plant objects, etc., using various indexes and deep machine learning algorithms.
The initial processing significantly reduced the error at each subsequent stage of the analysis. The developed unique algorithm for primary processing allowed to automatically analyze the entire supply of satellite images.
In this paper, we used spectral analysis algorithms with varying degrees of confidence to localize large deposits of carbonate, calcite, and kaolinite groups of minerals.
One of the methods of spectral analysis is the calculation of mineralogical (geological) indices. Indexes allow you to determine the possible distribution of key mineral groups. To develop a geological index, it is necessary to consider the absorption zones of the studied group of minerals.
The following indexes were built for the territory of interest: Index of calcite group minerals (Fig. 3)
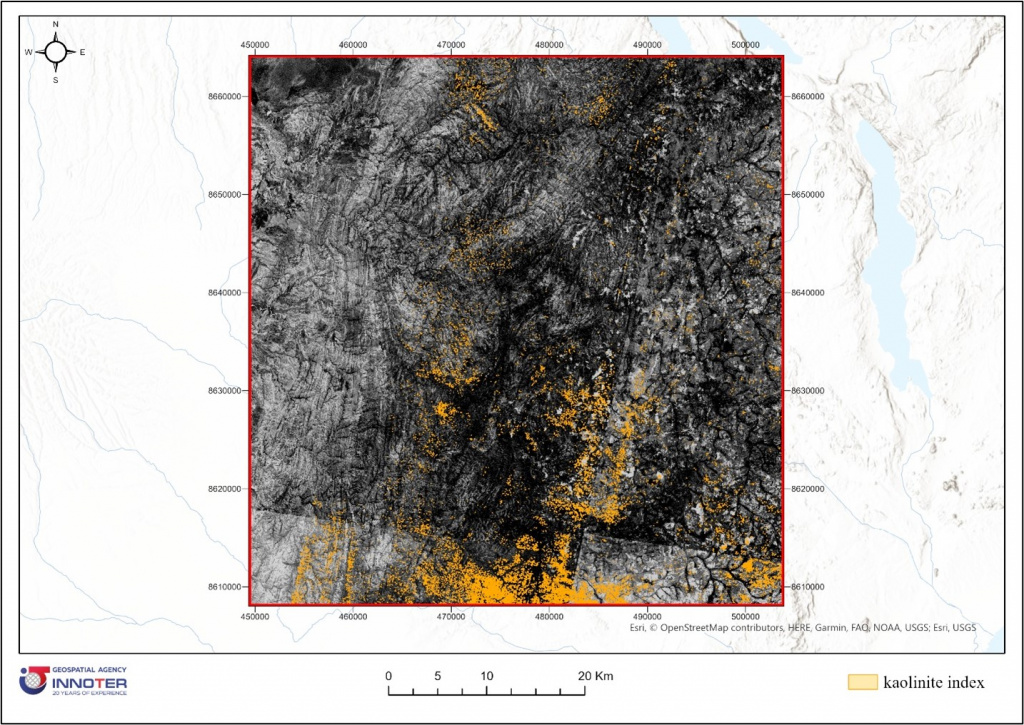
Figure 3. Calculation of the index of minerals of the kaolinite group (yellow shows the zone of probable distribution of kaolinite).
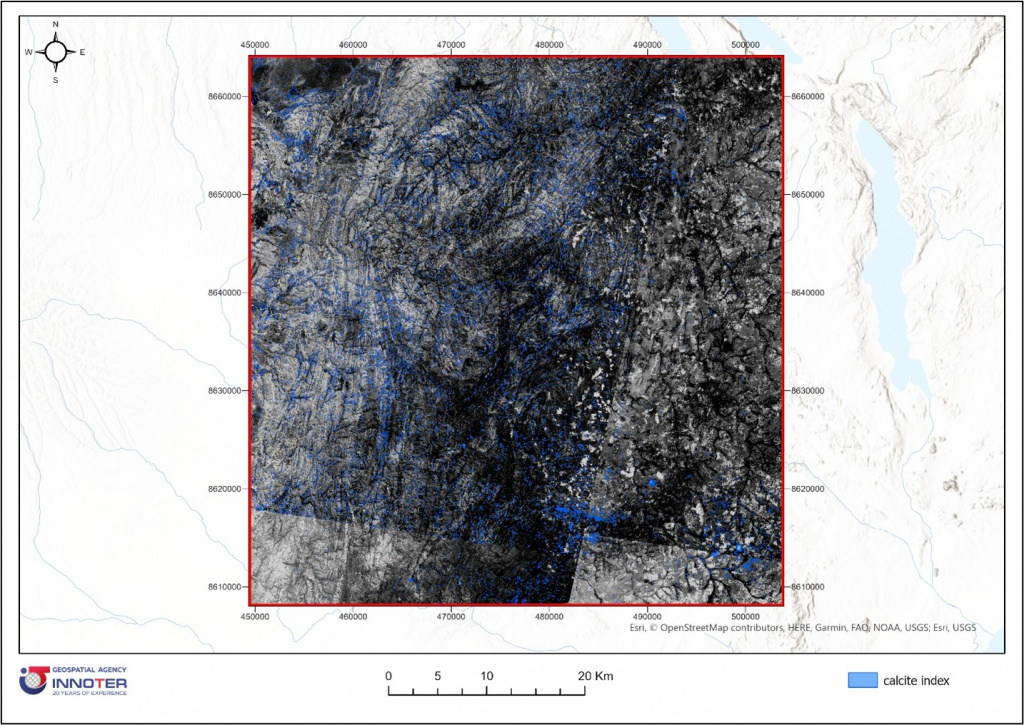
Figure 4. Calcite index calculation (blue color shows the zone of probable calcite distribution)
At the next stage of the analysis, the Spectral Angle Mapper method was used, which is an automated algorithm for comparing spectra. The source of data on spectral characteristics was the spectral library or spectra of minerals obtained during field research. The advantage of this method is that it does not consider the degree of illumination of the object by the Sun and compares the angle of deviation between the two spectral curves. Minerals were analyzed:
1. Dolomite
2. Alunite
3. Muscovite
4. Calcite
5. Siderite
6. Magnesite
7. Kaolinite
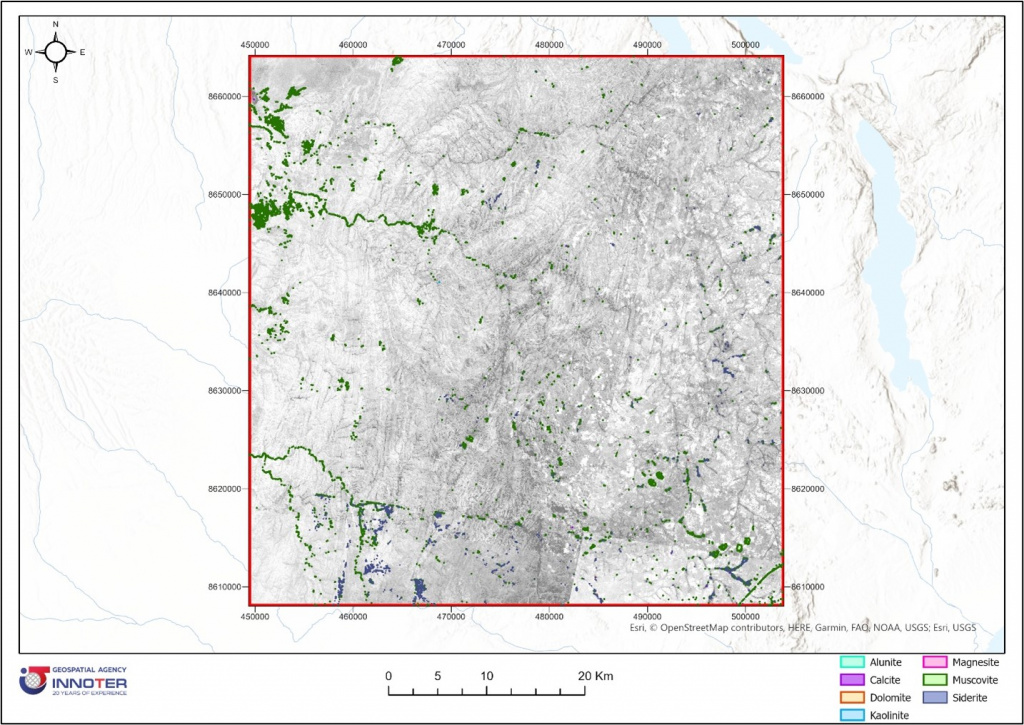 Figure 5. Complex map of the distribution of the main minerals-indicator of gold mineralization
Completed works:
- Selection of archival materials on the USGS portal https://search.earthdata.nasa.gov/search
- Primary processing of satellite images using the developed automated method.
- Use and development of mineralogical indices for the territory of interest.
- Localization of minerals by the spectral angle method (Spectral Angel Mapper).
The used methods of spectral analysis-Geological indexes (Geology index), the spectral Angle method (Spectral Angel Mapper), for the purpose of forecasting minerals, have shown their effectiveness, allowed to discover new ore-promising zones (Fig. 6).
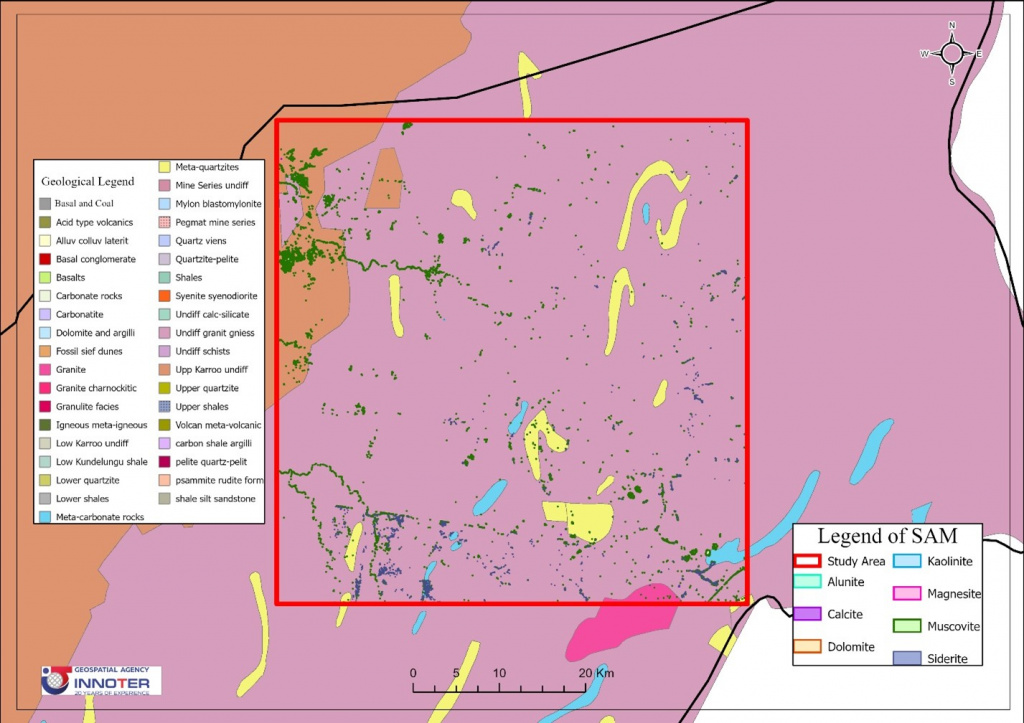
Figure 6. Complex map of the distribution of basic minerals-indicator of gold mineralization
Results
As a result of the execution of the work:
-
Maps of mineral distribution have been compiled-an indicator of gold mineralization (Fig. 5);
-
The gold mineralization search area was reduced by 90% (from the original territory) (Fig. 6);
-
High-precision remote bases (channel-by-channel and synthesized), as well as orthophotoplans, have been compiled.
The results achieved will help to increase the mineral resource base of Zambia, which will have a positive impact both on the economic situation in the country and increase the investment attractiveness of the region.
Need for consultation?
Fill the form and we will contact you
