Contact

Study of the structure of kimberlite fields at a scale of 1:25,000 based on processing and interpretation of space imagery materials

01

About the project

Industry Geology and mining
Customer

Diamond mining company

End date 05/24/2024
02

Project goal

  1. Creation of a predictive-search model of "cluster" rank for kimberlite bodies. This involves the search for known forms of kimberlite occurrences in remote sensing data, as well as new forms of controlling kimberlite "clusters." It includes identifying structures that can determine ore-controlling and ore-hosting (ore-forming) processes for the "cluster" rank of kimberlite bodies, establishing their connection with faults of a certain rank and strike, and with nodes of intersection and conjunction.
  2. Testing remote sensing methods for searching for epithermal copper-gold deposits to identify kimberlite bodies.
  3. Exploring the possibilities of using very high-resolution satellite images, as well as the SWIR channels of the WorldView-3 satellite, to detect kimberlite bodies in combination with automated analysis tools.

Implementation Mechanism

Method No. 1: Multispectral image analysis.
Method No. 2: Lineament analysis.

Limitations

  1. Lack of archival space imagery data for the areas under consideration.
  2. Presence of a thick sedimentary cover.
03

Completed works

Method No. 1:

Experimentally reproduced the identification of spectral anomalies using Ishmukhametova's method. Testing the method in the areas of reference sites.

An empirically derived algorithm that identifies spectral anomalies presumably associated with diamond-bearing kimberlite bodies was identified. High-detail multispectral satellite data from the WorldView-3 satellite was used for the first time in the reference site areas.

To address the tasks set in the terms of reference, the following methods of spectral composite analysis were used:

  1. Visual interpretation.
  2. Construction of index images, including private ones.
  3. Statistical methods, including classification.

Processing was performed in the ERDAS Imagine and ENVI software environments – specialized software supporting the processing of various sensor types and including a set of tools for the complete processing cycle.

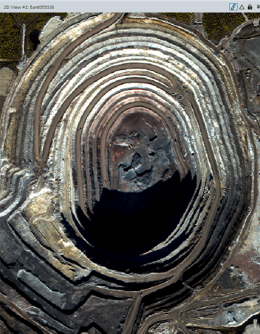
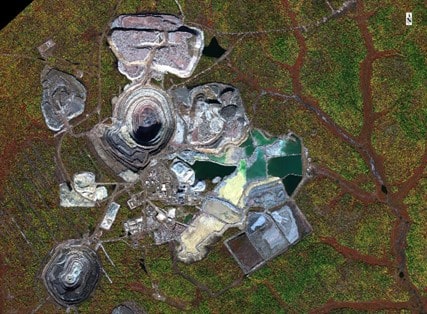
Fig. 1. Research Object

Preliminary (Primary) Data Processing

Primary processing of satellite images is an important step that converts the raw image (set of pixel brightness, DN) into calibrated material for qualitative and quantitative measurements.

To prepare the multispectral satellite imagery materials for further work, the following types of preliminary processing were performed:

  1. Combining individual channels and groups of channels into a single composite
  2. Radiometric calibration;
  3. Atmospheric correction;
Fig. 2. Fragment of WorldView-3 multispectral images (Channel merging)
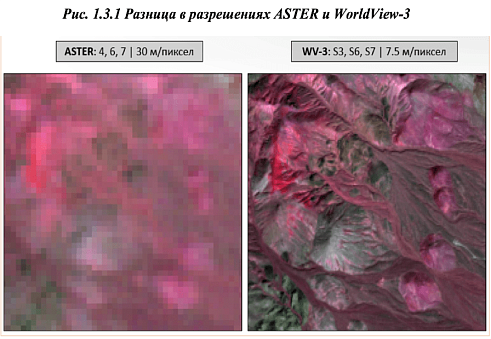
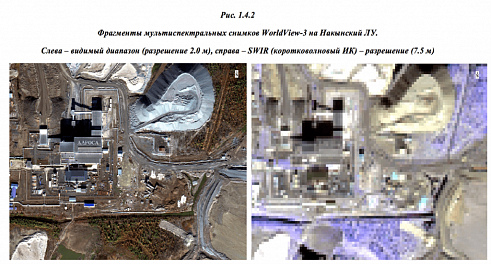
Fig. 3. Difference in resolution between Aster and WorldView-3 in SWIR

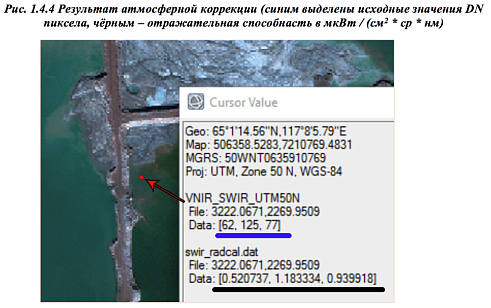
The task of radiometric calibration is to convert pixel brightness values (DN) into physical units. The conversion of brightness DN values to reflectance values μW / (cm² * sr * nm) was performed taking into account calibration coefficients (Gain, Offset) specific to each sensor.

Fig. 4. Radiometric calibration of the image

Building Mineral Indices from High-Resolution WorldView-3 Imagery

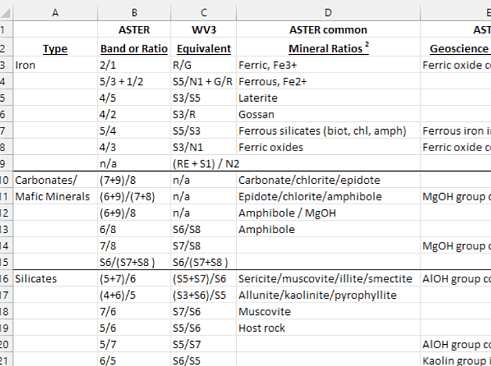
According to geological studies, kimberlite bodies are characterized by increased contents of Fe, Cr, and Mg, both in primary and secondary halos. Considering this, we assume that processing multispectral imagery will allow highlighting areas with increased content of these elements (particularly the presence of Mg-OH, Fe-OH), which, in combination with other methods, will significantly narrow the search area.

Fig. 5. Example of using mineral indices

Nyurbinskaya pipe - MgOH presence index: daiko-like positive anomaly

Used channels:

  1. SWIR 4 (1.710 - 1.75 μm)
  2. SWIR 6 (2.185 - 2.225 μm)
  3. SWIR 8 (2.295 - 2.365 μm)
Fig. 6. Example of using indices for various tasks

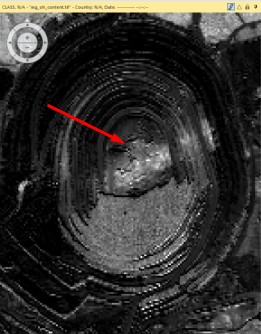
Based on WorldView-3 satellite images, a daiko-like positive anomaly was identified using mineral indices. Fig. 7.

Fig. 7. Mineral Index
Fig. 8. Composite in natural colors

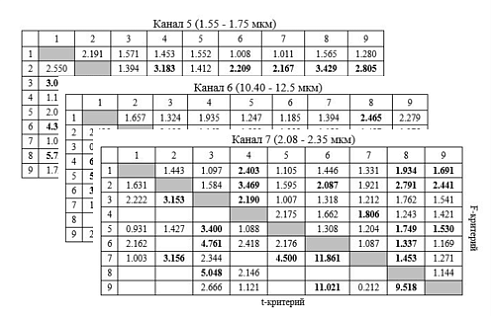
Statistical Analysis/Composite Construction from Landsat-7

Further studies were conducted to examine the characteristics of multispectral satellite imagery to identify kimberlite bodies against the background of their host rocks.

Fig. 9. Determining dependency across wavebands

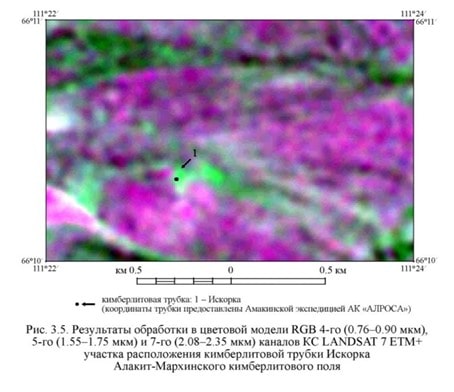
Creating a composite based on the conducted analyses for further identification of kimberlite pipes.

Fig. 10. Analysis of composite processing results

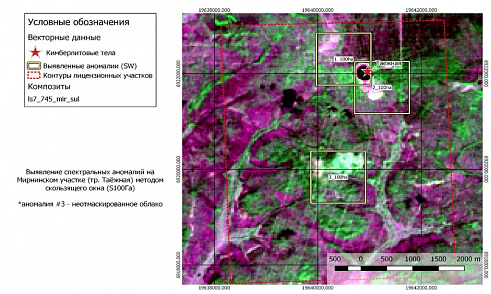
Identification of spectral anomalies for locating kimberlite bodies within licensed areas.

Fig. 11. Identifying kimberlite bodies in licensed areas

Method No. 1 Limitations

The limitation of this method is the presence of overlying deposits over 10 meters thick, which hinders the detection of anomalies in brightness characteristics corresponding to kimberlite pipes.

Another limitation is the small area of the kimberlite pipes themselves (less than 0.3 hectares when working with different spatial resolutions). In the latter case, the area of the anomaly is difficult to diagnose by brightness due to the technical characteristics of the LANDSAT 7 ETM+ satellite.

Method No. 2

Advantages:

  1. Availability of a mathematical algorithm for constructing and decomposing matrices for the comprehensive interpretation of geological, geophysical data, and remote sensing data.
  2. Lower costs compared to traditional geological research methods.
  3. Geological understanding of the information obtained by remote methods.
  4. Strict support of obtained results with geological and geophysical materials.

Used Spatial Data:

  1. Hydro network maps and reliefs
  2. SRTM90
  3. ASTER Global DEM

Lineament analysis is one of the most effective methods for studying the deep structure of a territory.

Example of Systematic Lineament Interpretation

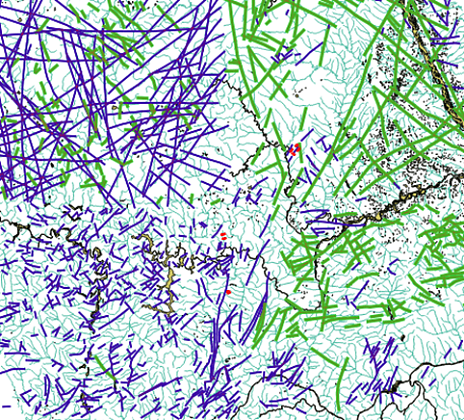
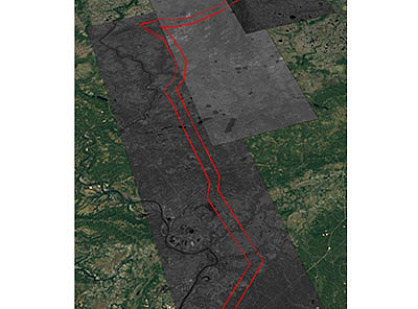
Lineaments were identified in Western Yakutia based on geological survey materials at a scale of 1:1,000,000 (red dotted lines indicate the boundaries of reference kimberlite fields)

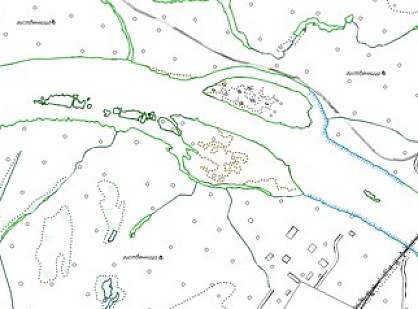
Fig. 12. Example of unsystematic lineament interpretation

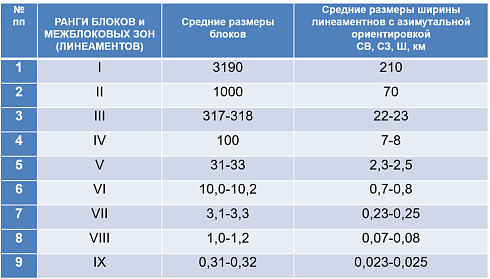
Hierarchy of lineament-block structures:

Systematic interpretation of lineaments and ring structures based on open data was also carried out to identify faults, fractures, and other structural-tectonic changes.
Research Object
Fragment of WorldView-3 multispectral images (Channel merging)
Difference in resolution between Aster and WorldView-3 in SWIR
Radiometric calibration of the image
Example of using mineral indices
Example of using indices for various tasks
Mineral Index
Composite in natural colors
Determining dependency across wavebands
Analysis of composite processing results
Identifying kimberlite bodies in licensed areas
Example of unsystematic lineament interpretation
Hierarchy of lineament-block structures
04

Result

Results of Method #1

Based on the method of Multispectral Image Analysis, the following tasks were completed according to the Technical Assignment:

  • Created maps for identifying kimberlite bodies based on satellite imagery and derived products
  • Developed recommendations for types of satellite imagery (spectral and spatial resolution)
  • Standardized interpretation criteria, including spectral signatures, indicator minerals, and determination of relationships between them (ERDAS Imagine .sig)

Results of Method #2

Based on the method of Lineament Analysis, the following tasks were completed according to the Technical Assignment:
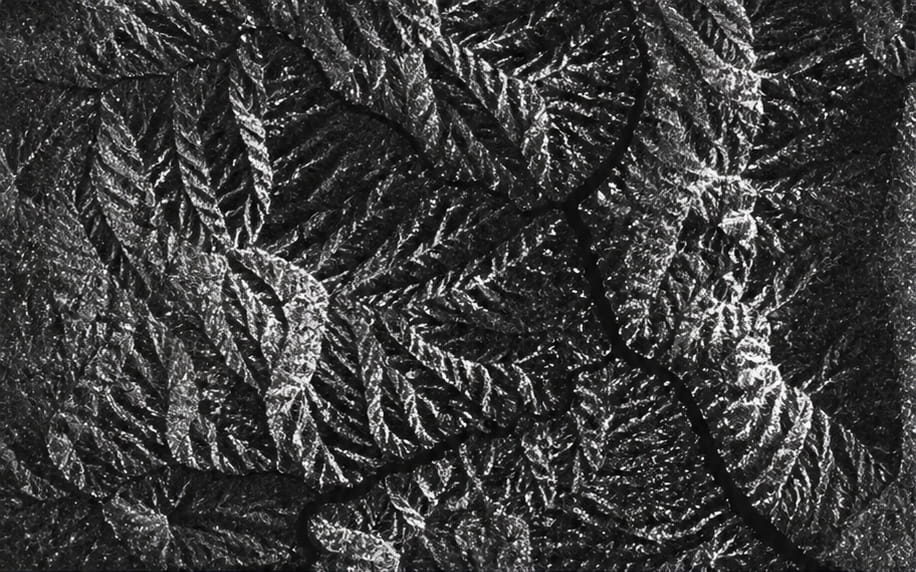

  1. Cosmostructural maps of fault tectonics within the approved spatial boundaries of the work with forecast elements, scale 1:25,000.
  2. Isotropies of fracturing (lineaments), rose diagrams of fracturing and lineaments, cosmo-geological interpretation of structural-tectonic schemes (GIS projects in ArcMap system).

Need satellite imagery or help choosing the right data?

Describe your task, area of interest, and desired outcome. We will check data availability, assess new acquisition options, and propose the optimal solution in terms of timelines, cost, and quality.
clients who trust us
25+ years in the geodata market
Request a call back
Back to page top
Мы используем Яндекс.Метрика и собственные Сookies для обеспечения наилучшего опыта работы на нашем сайте, персонализации сайта для наших пользователей и аналитики. Продолжая использовать сайт вы соглашаетесь с условиями Пользовательского соглашения.