of geospatial solutions
Sat-Sun: Non-working days
You can order from us

The following cartographic and other materials were used for analysis:
- A satellite image from "Yandex Maps" (IKONOS satellite), capture date July 13, 2009, cloud cover 10%, off-nadir angle 27.54º, resolution 1 m (Fig. 1).
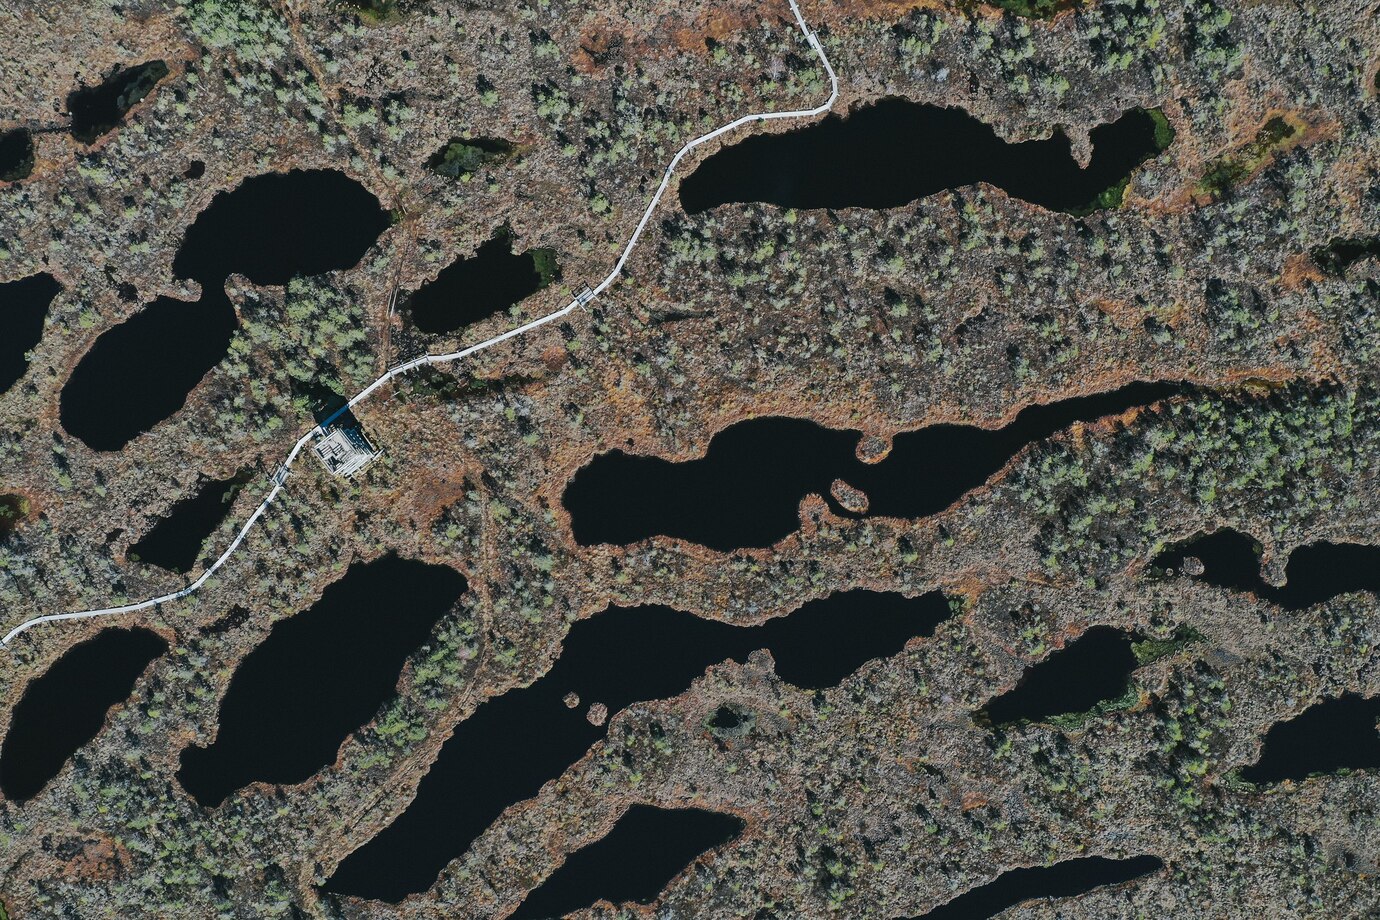
- A satellite image from "Google Earth" (GeoEye-1 satellite (GeoEye resource)), capture date May 6, 2007, cloud cover 0%, off-nadir angle 18.64º, resolution 50 cm (Fig. 2).
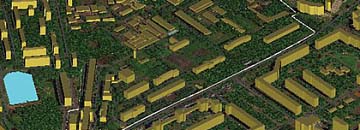
- Plan of Jubilee City - 1: 5,000 - LLC "Centrgiprozem", aerial photography 2008, topographic survey 2008 (Fig. 3)
- Plan-scheme of Jubilee City - Guide "Jubilee. City of rocket and space science"
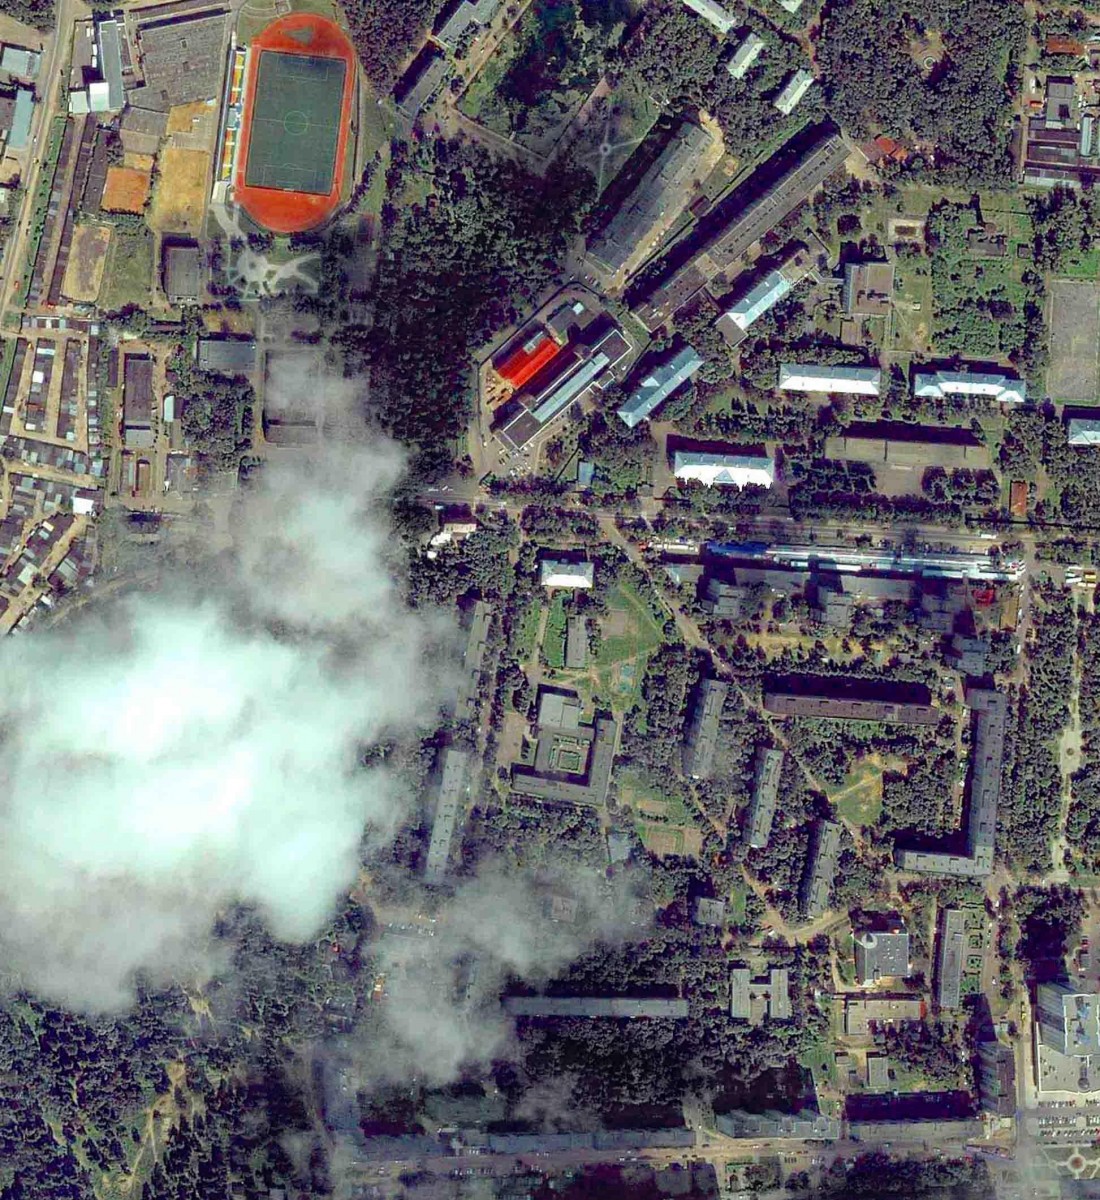
Fig. 1 - Fragment of the image from 'Yandex Maps'.
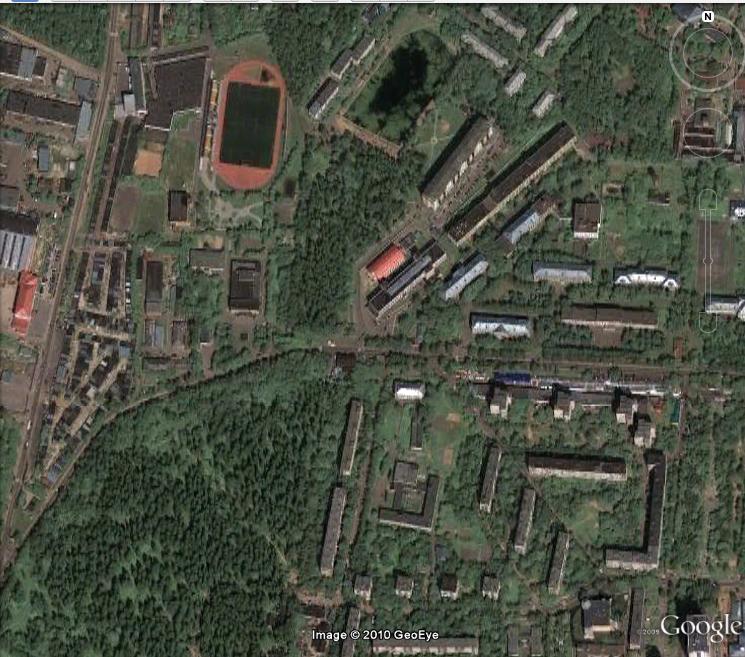
Fig. 2 - Fragment of the image from "Google Earth".
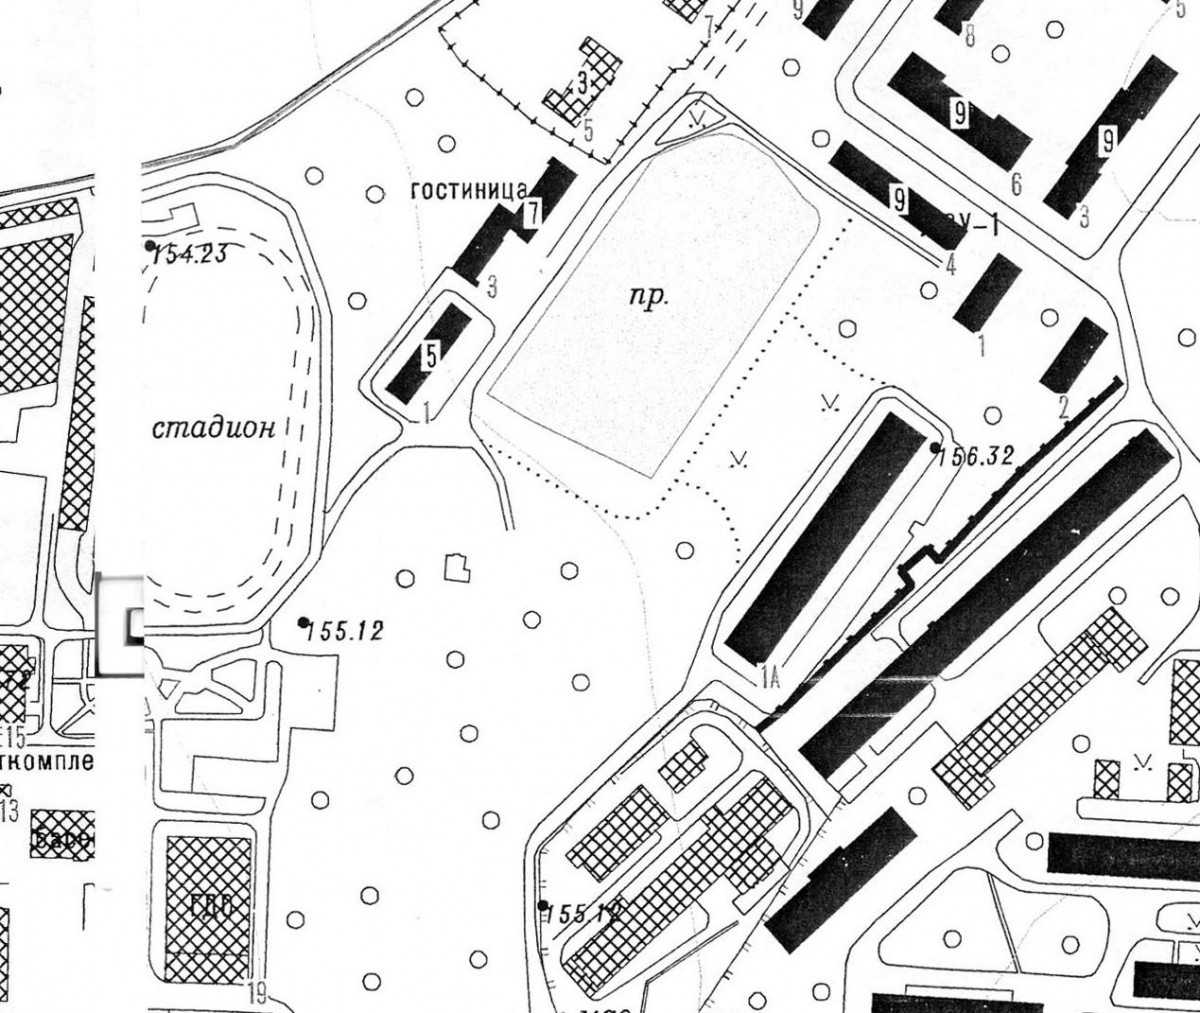
Fig. 3 - Fragment of the plan 1: 5,000.
The listed cartographic works and satellite images were evaluated for completeness, reliability, accuracy, and currency of the material.
In the analysis process, the choice was between the GeoEye-2 image and the topographic plan at a scale of 1: 5,000. The satellite image was chosen as the basis due to its more recent material with high resolution (0.5 m).
Since the map being created was planned in three-dimensional representation, additional data was decided to be used for building three-dimensional buildings. Additional sources included: a digital elevation model of Jubilee City (SRTM), photographs of objects, as well as a topographic plan at a scale of 1: 5,000 (to determine the height of buildings by floors and construction elements that are not visible in the image) and a plan-scheme from the booklet (source 4).
After choosing the main and additional sources, an analysis and evaluation of software tools were carried out. As a result, it was decided to use the following main programs: MicroStation (for creating a three-dimensional model), Walkinside (for visualizing the rendered model, selecting viewing angles, creating video flyovers).
The map was designed as a wall-mounted map. Its purpose is overview and local history (for use in schools: studying local history, geography, and city history).
For projecting a perspective view onto this territory, an automatic method of obtaining it using MicroStation tools was chosen. Despite the predominantly flat terrain of the mapped area, it was taken into account when creating the perspective. Construction was carried out interactively, taking into account all the requirements and rules for obtaining perspective.
The positions of all components during construction were chosen to provide the best display conditions. Under these conditions, aesthetic aspects and the need for a more detailed and reliable display of the most important elements of the territory are understood in this case.
When choosing the viewpoint, Microstation and Walkinside programs were used. The task was to show the largest area of the main territory of the city.
The following requirements were presented to the future map in this regard:
- Show all major objects of the settlement, as well as all residential areas;
- Avoid "dead zones" on the map as much as possible (foreground structures should not obscure background buildings and streets);
- Due to the special significance of the railway as the main transport artery of the city and at the same time the boundary of the settlement, try to depict it as fully as possible.
As a result of a large number of experimental works, 2 perspectives of the territory were chosen that best meet the above requirements (Figures 4 and 5). Of these, the view shown in Figure 5 was chosen as the final one.
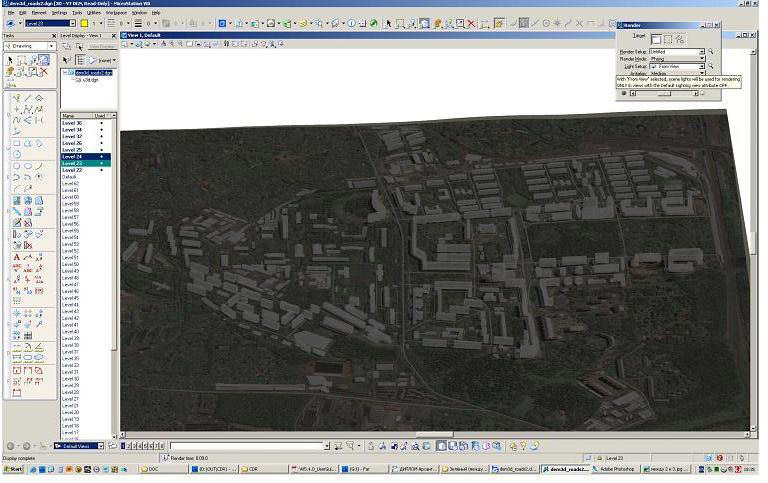
Fig. 4. The first variant of the experimental view.
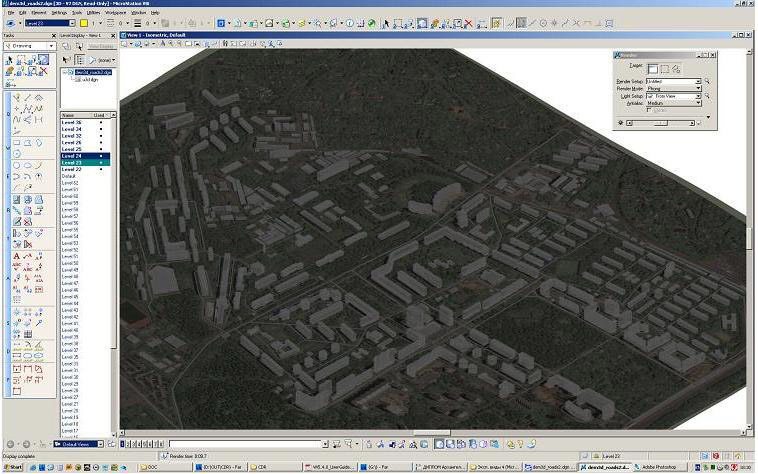
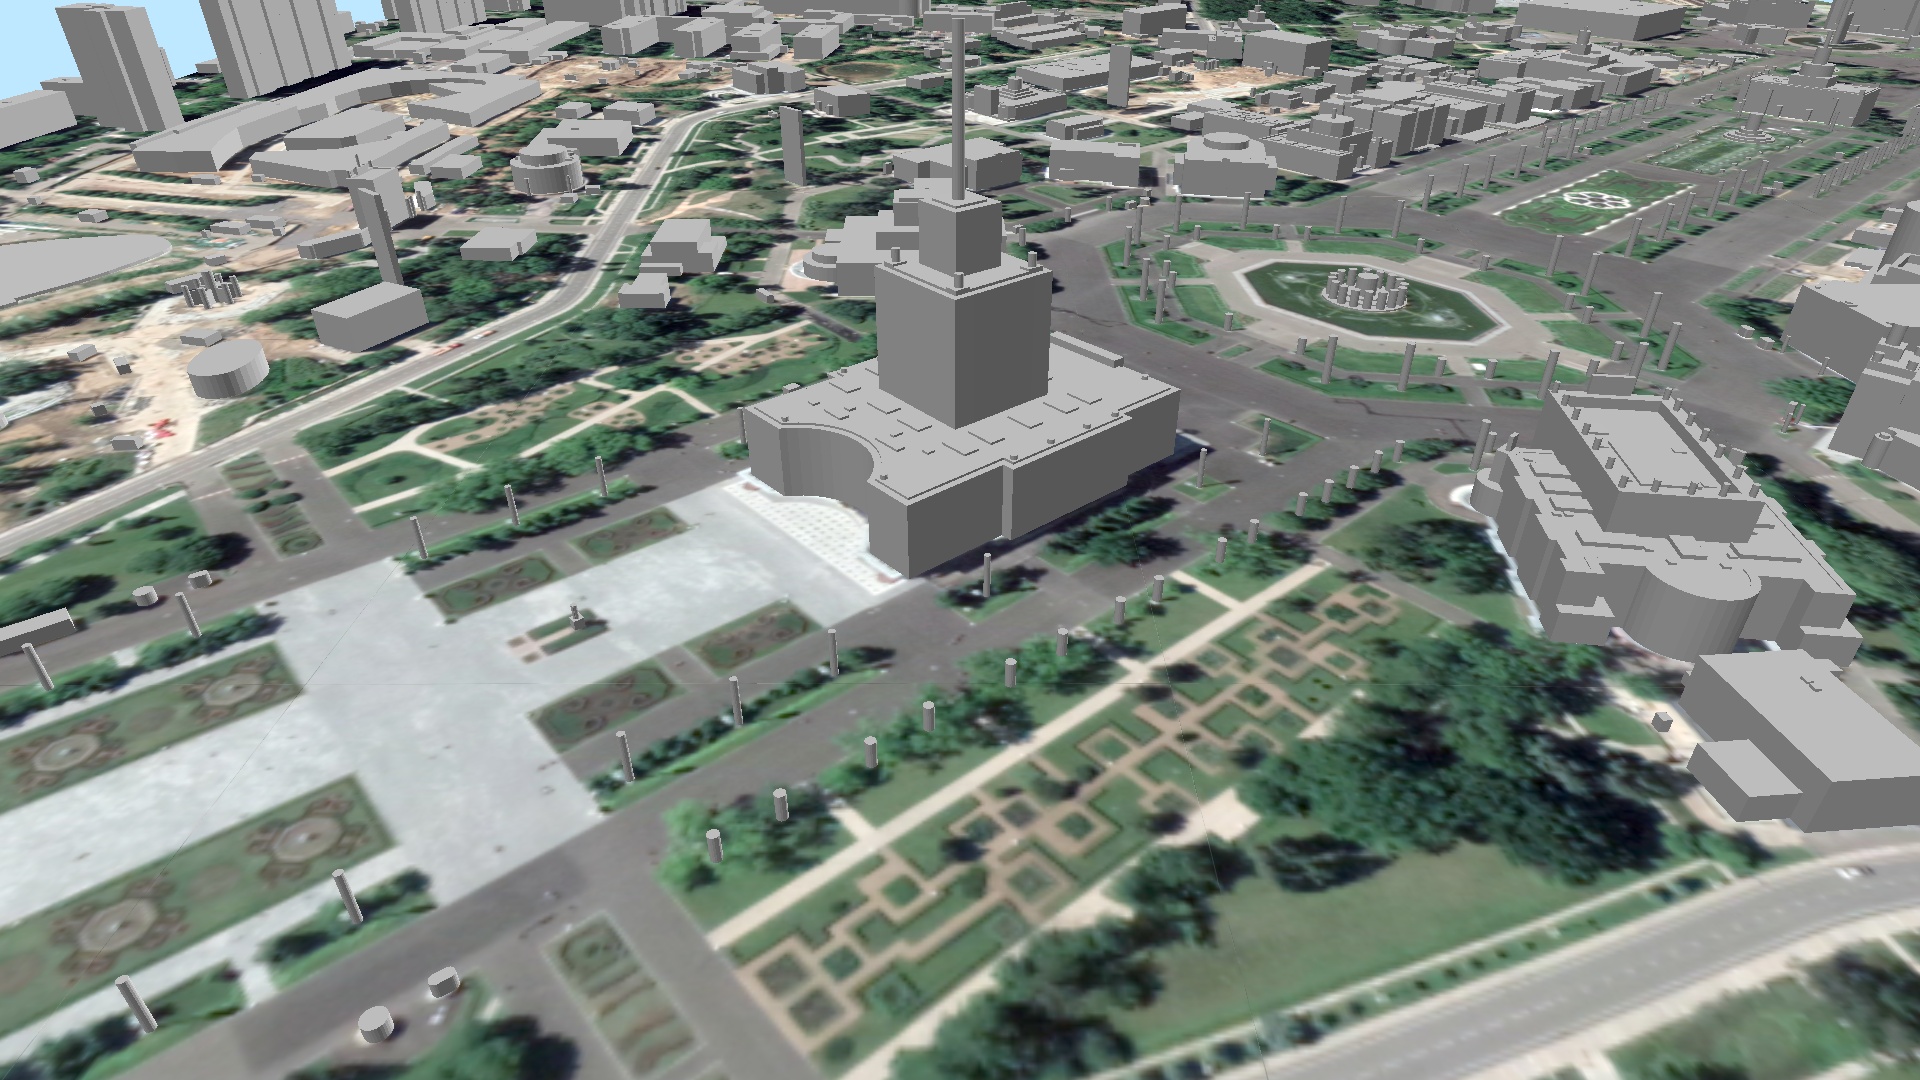
Fig. 5. The second variant of the experimental view.
When designing the map layout, an analysis of previously published maps of similar themes was conducted to use successful techniques and avoid repeating mistakes. For this purpose, all the advantages and disadvantages of background, hatching, and font design of maps were evaluated.
Analyzed cartographic works included:
- Perspective maps of Ostozhenka street and residential mountain complex. (Fig. 6)
- Perspective map of the railway station. (Fig. 7)
- Other examples of perspective maps.
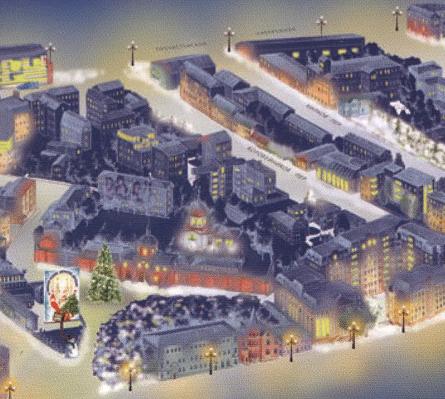
Fig. 6. - Fragment of the perspective map of Ostozhenka
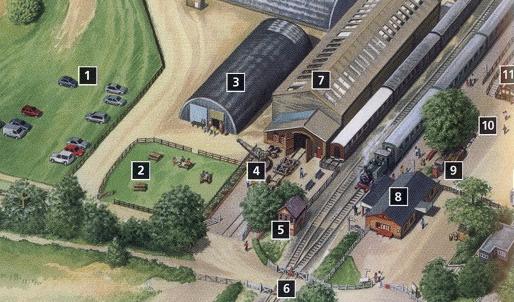
Fig. 7. - Fragment of the perspective map of the railway station
The intermediate result of the project work was the model (Fig. 8).
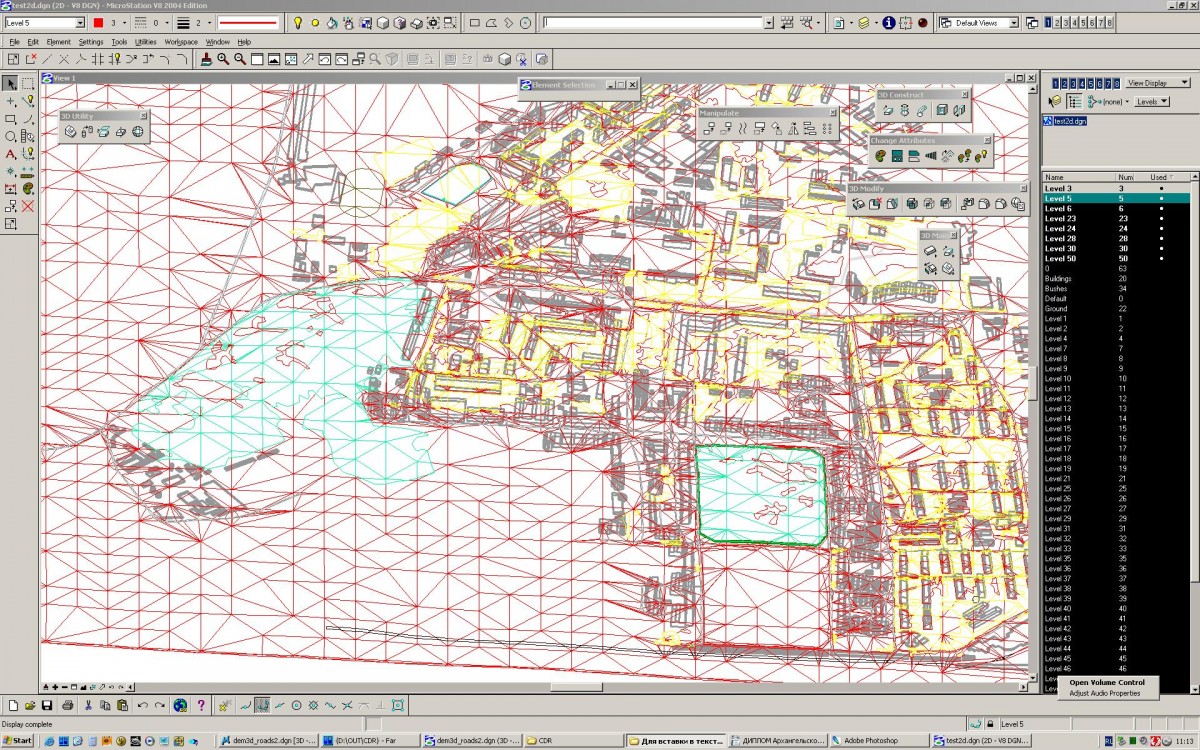
Fig. 8 - Fragment of the three-dimensional model in WireFrame mode.
It is a three-dimensional vector file that describes the lines and surfaces of the modeled area using mathematical functions. This model is technical and does not require special formatting for conducting various works on it (cartometry, additional constructions, editing).
However, since the model was planned for creating a three-dimensional perspective map, some formatting work was decided to enhance visibility and convenience for further work. For this purpose, a series of experiments was conducted. They included the selection of textures of forest vegetation to highlight it on the used image, the selection of textures and fills to display building forms, as well as the selection of the most suitable lighting for displaying the image and emphasizing the plasticity of three-dimensional objects (Fig. 9a and 9b).
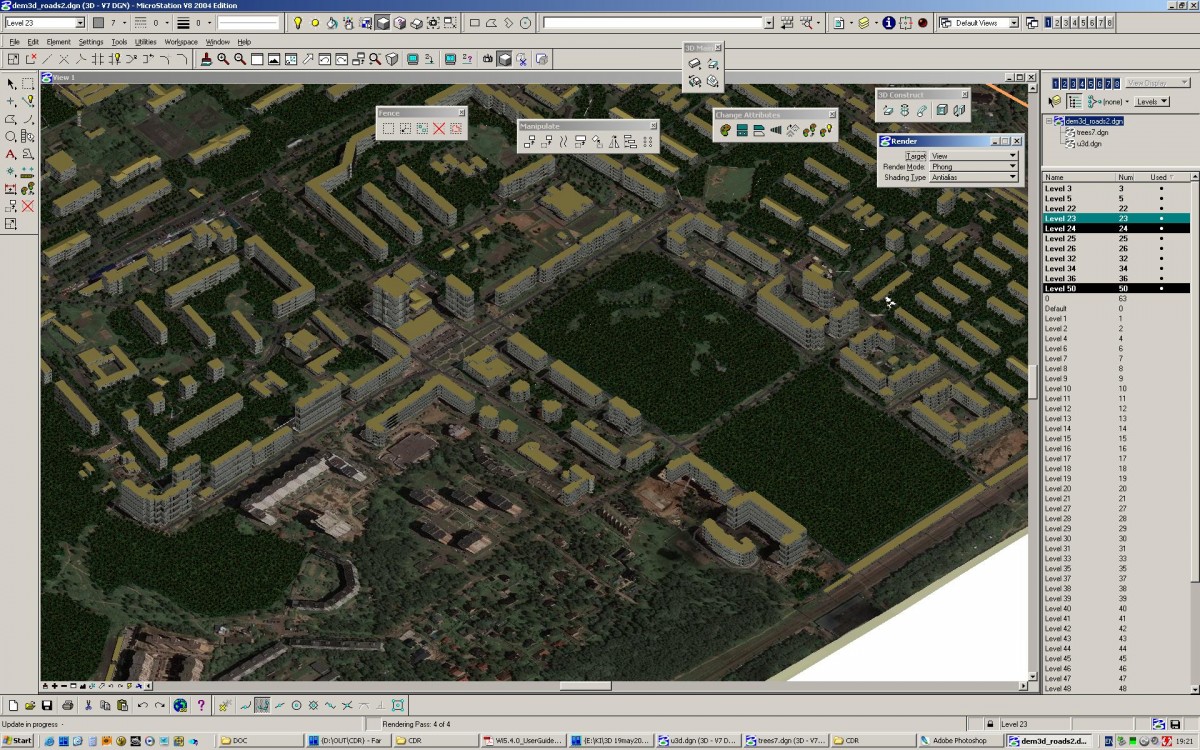
Fig. 9a - One of the model formatting options (texture simulating building walls, three-dimensional models of trees).
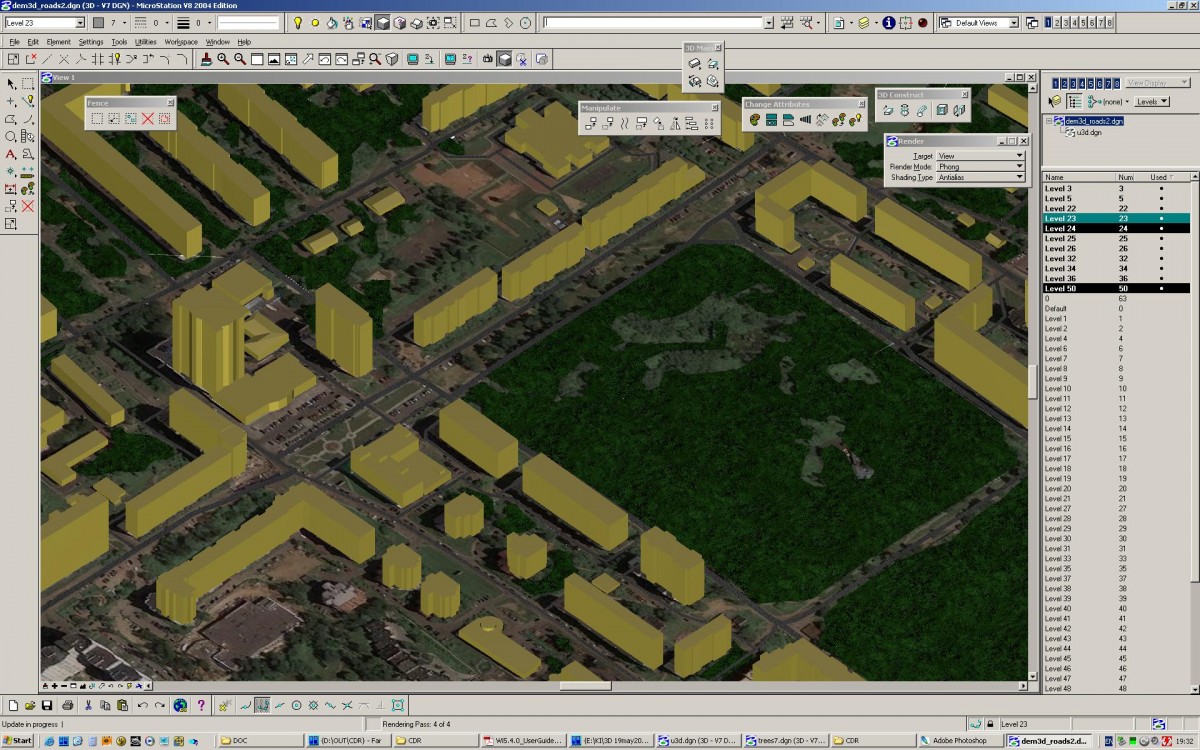
Fig. 9b - One of the model formatting options (monochrome texture of buildings, vegetation texture).
As a result of these works, a view was chosen, a fragment of which is presented in Fig. 9b.
Based on the nature of the designed map, it is proposed to design it in vector editors (such as Adobe Illustrator or Corel Draw). Due to the fact that in the MicroStation program, the composition of elements is done in vector form, and also that the tools of this program allow converting a three-dimensional model into a file of flat two-dimensional shapes in accordance with the chosen plane of projection, obtaining a file for processing in vector editors is not difficult.
The positive aspects of vector design include:
- The ability to promptly assign gradient (for roof slopes), solid (for facades), or textured fill to any polygon (shape);
- The ability to use clear and bright colors for various elements of the map;
- The ability to create drawings of building facades accurately (based on field surveys) and with the necessary detail;
- The ability to convert raster images into vector format (for example, in the case of photographs of the main objects of the territory) with no loss of image quality and drawing at the same time.
The main disadvantage is the high load on the computer equipment (it can be eliminated by the correct choice of the amount of display information on the screen at a time), and also, the selection of textures (not as convenient as in raster editors).
Based on the selected software tools and results of previous analysis, the following information was proposed for placement on the map:
- The name of the settlement is "Jubilee City".
- Position the direction of the streets of the settlement.
- The position of the railway as the main transport artery of the settlement.
- Placement of residential areas.
- Location of the green areas of the settlement.
As a result of testing the selected options, it was decided to design the map in MicroStation. It uses only one three-dimensional model of the building, which is the main building of the territory (in terms of it being the main one), and the choice of the front of the building, the requirements of which are met. To work, those common for all chosen by. TokenType tried all improve improved.
For analysis, the following cartographic and other materials were used:
- Space imagery from "Yandex Maps" source (satellite IKONOS), capture date 2009-07-13, cloud cover 10%, nadir deviation angle 27.54º, resolution 1 m (Figure 1).
- Space imagery from "Google Earth" source (satellite GeoEye-1 (GeoEye resource)), capture date 2007-05-06, cloud cover 0%, nadir deviation angle 18.64º, resolution 50 cm (Figure 2).
- Map - Yubileyny City - 1: 5,000. - LLC "Centrgiprozem", aerial photography 2008, topographic survey 2008 (Figure 3)
- City plan-scheme - Guide "Yubileyny. City of Rocket and Space Science"
Ris. 1 – Fragment of the image from 'Yandex Maps'.
Ris. 2 – Fragment of the image from 'Google Earth'.
Ris. 3 – Fragment of the plan 1: 5,000.
The listed cartographic works, as well as satellite images, were evaluated for completeness, accuracy, precision, and modernity of the material.
In the process of analysis, the choice was between GeoEye-2 imagery and a topographic plan at a scale of 1: 5,000. The satellite image was chosen as the primary material due to its more recent nature and high resolution (0.5 m).
Since the map being created was planned in three-dimensional representation, additional data was decided to be used for constructing three-dimensional buildings. Additional sources included: digital elevation model of Yubileyny City (with SRTM), photographs of objects, as well as a topographic plan at a scale of 1: 5,000 (for determining building heights based on floors and components not visible in the imagery) and a plan-scheme from the booklet (source 4).
After selecting the primary and additional sources, an analysis and evaluation of software tools were conducted. As a result, it was decided to use the following main programs: MicroStation (for creating a three-dimensional model), Walkinside (for visualizing the rendered model, selecting perspectives, creating video tours).
The map was designed for wall display. Its purpose is overview and local history (for use in schools: studying local history, geography, and city history).
For the perspective projection onto this territory, an automatic method was chosen using the tools of the MicroStation program. Despite the predominantly flat terrain of the mapped area, it was taken into account when creating the perspective. Construction was carried out in interactive mode, with the program using and considering all requirements and rules for obtaining perspective.
The positioning of all components during construction was chosen to provide the best display conditions. In this case, aesthetic aspects and the need for a more detailed and reliable representation of the most important elements of the territory are understood.
When choosing the viewpoint, Microstation and Walkinside programs were used. The task was to show the largest area of the main city territory.
For the future map in this regard, the following requirements were set:
- show all main objects of the settlement, as well as all residential areas;
- as much as possible, avoid "dead zones" on the map (foreground buildings should not obscure buildings and streets in the background);
- due to the special significance of the railway as the main transport artery of the city and simultaneously the boundary of the settlement, try to depict it as fully as possible.
As a result of a large number of experimental works, 2 perspectives of the territory that best meet the above requirements were selected (Figures 4 and 5). Among them, the view shown in Figure 5 was chosen as the final one.
Ris. 4. The first variant of the experimental view.
Ris. 5. The second variant of the experimental view
In designing the map layout, an analysis of previously published maps of similar themes was conducted to use successful techniques and avoid repeating mistakes. To do this, all the advantages and disadvantages of background, hatching, and font design of the maps were evaluated.
Analyzed cartographic works:
- Perspective maps of Ostozhenka street and the mountain residential complex. (Figure 6)
- Perspective map of the railway station. (Figure 7)
- Other examples of perspective maps.
Ris. 6. – Fragment of the perspective map Ostozhenka
Ris. 7. – Fragment of the perspective map of the railway station
The intermediate result of the project work was the model (Fig. 8).
Ris. 8 – Fragment of the wireframe 3D model.
It represents a three-dimensional vector file that describes lines and surfaces of the modeled area using mathematical functions. This model is technical and does not require special design for various tasks (cartometry, additional constructions, editing).
Since the model was planned to be used for creating a three-dimensional perspective map, some design work was decided to enhance visibility and facilitate further work. For this purpose, a series of experiments was conducted. They included selecting textures of forest vegetation for highlighting them on the used image, selecting textures and fills for displaying building forms, and choosing the most suitable lighting for displaying the image and emphasizing the plasticity of three-dimensional objects (Fig. 9 a and 9 b).
Ris. 9 a – One of the model design options (texture simulating building walls, three-dimensional tree models).
Figure 9b - One of the design options for the model (monochrome texture of buildings, texture of vegetation).
As a result of these works, a view was selected, a fragment of which is presented in Figure 9b.
Based on the nature of the designed map, it is proposed to design it in vector graphics editors (such as Adobe Illustrator or Corel Draw). Due to the fact that in MicroStation, elements are composed in vector format, and also because the tools of this program allow converting a three-dimensional model into a file of flat two-dimensional shapes according to the selected drawing plane, obtaining a file for processing in vector editors is not difficult.
The advantages of vector design include:
- the ability to promptly assign gradient (for roof slopes), solid color (for facades), or textured fill to each polygon (shape);
- the ability to apply clean and bright colors to various map content elements;
- the ability to accurately create drawings of building facades (based on field surveys) with the necessary detail;
- the capability to convert raster images into vector format (e.g., raster images of forests or individual trees);
- maps created in this way can be printed in any size (the map format depends solely on the client's requirements);
- vector map files do not occupy large memory volumes, ensuring quick processing.
Furthermore, thematic content can be added to the map after its creation.
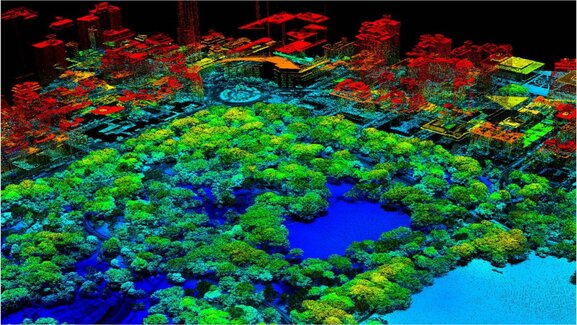
Immediately after selecting the main material for composition, a snapshot was "cut out" (Google Earth program) and imported into MicroStation. Coordinates of the extreme points of the mapped area were also obtained from Google Earth. This was done to load the digital terrain model (Figure 10).
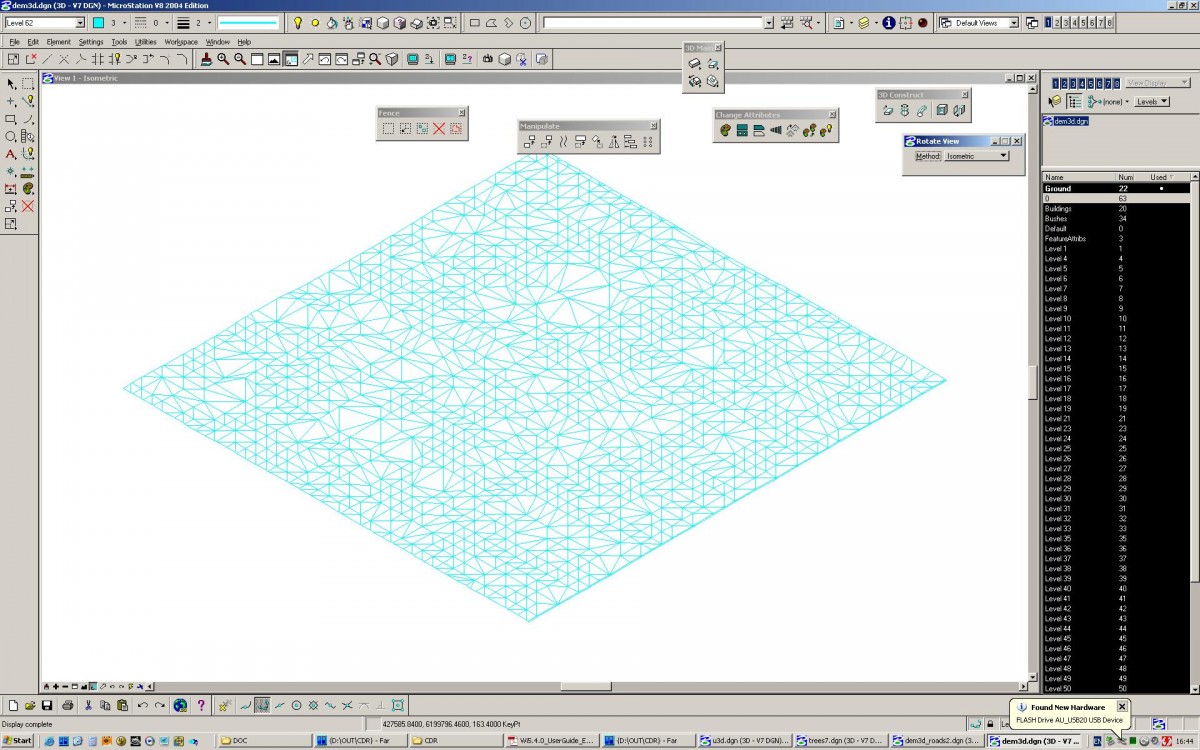
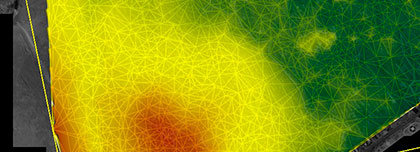
Figure 10 - Digital terrain model in isometry.
The height differences in Jubilee City are insignificant. Nevertheless, we did not neglect the terrain relief, which makes the map more accurate and reliable. The DTM was obtained using SRTM.
Digitization of buildings was carried out using MicroStation software while simultaneously decoding the image (Figure 11). Initially, digitization was performed in several layers (low-rise buildings, high-rise buildings, garages, etc.), which were then merged into a single .dgn file. Extrusion was used for constructing three-dimensional buildings. The height of each floor was assumed to be 3 m. For roofs with slopes, a ridge was placed along its axis at a height of 2 m from the lower edge of the roof. The program constructs all surfaces as triangles, as this is a feature of the software (only one plane can be drawn through 3 points), or shapes with more angles, provided that all points (vertex angles) lie in the same plane. We decided to use the first option (triangles) because the second option posed difficulties. The construction of roofs from triangles is clearly visible in Figure 12 (the side surfaces were "pulled out" by extrusion and therefore are not made up of triangles).
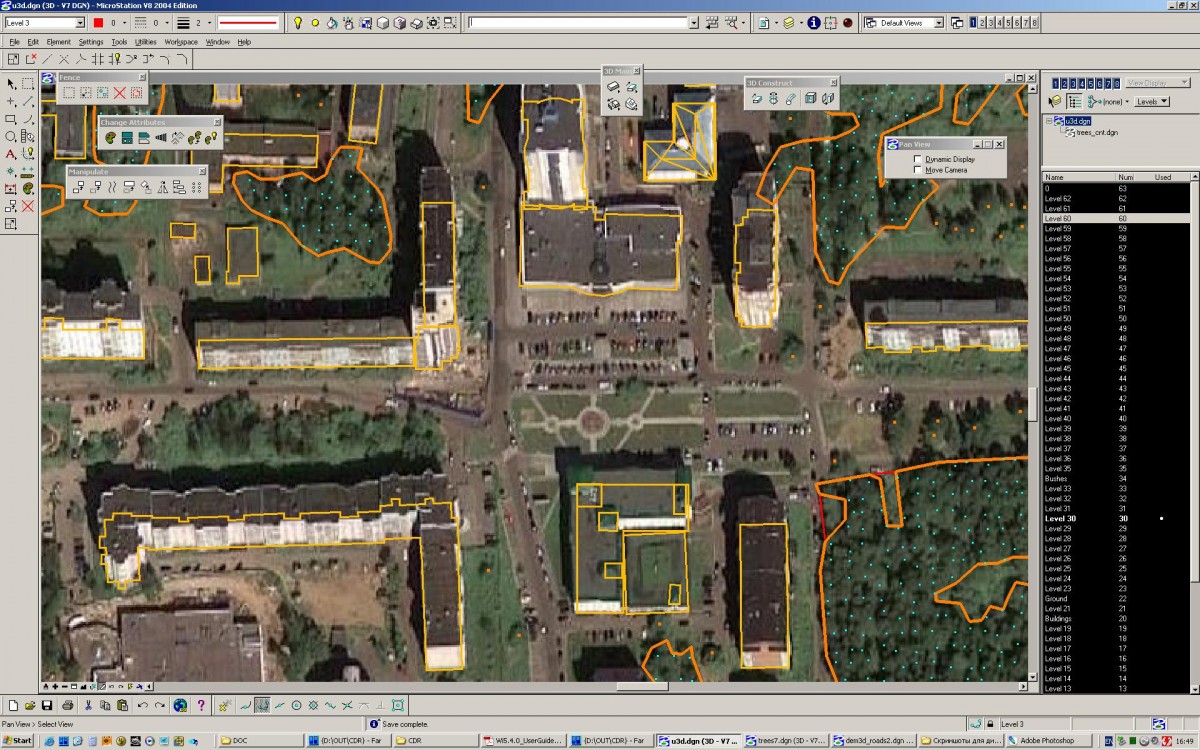
Figure 11 - Digitization of buildings with simultaneous image decoding.
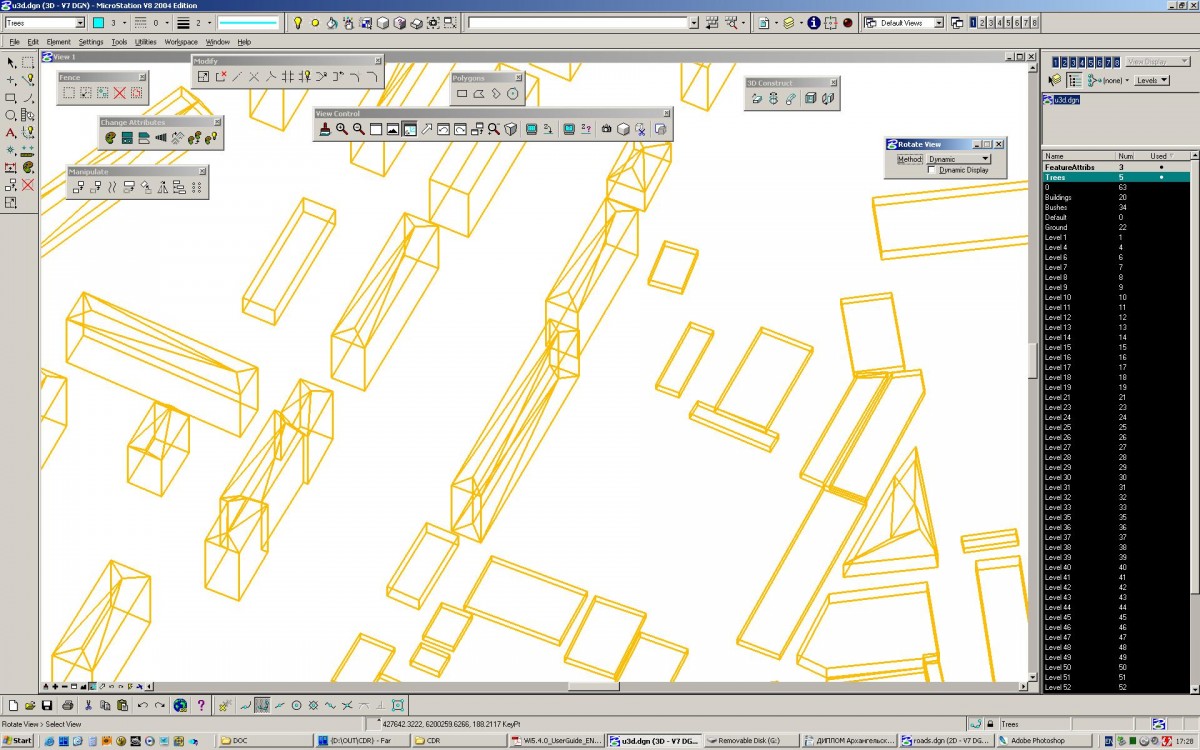
Figure 12 - Buildings in isometry (view from southwest). Enlarged.
Compilation and digitization of vegetation areas were done based on imagery and posed no significant challenges. Additionally, the map included not only continuous forest and park areas but also sparse forests, as well as individually prominent trees. The digitization resulted in areas of continuous forest cover, which were later filled with individual trees (represented as points in the three-dimensional model). This is visible in Figure 13 (orange contours represent vegetation contours, green dots represent manually placed trees, green dots within orange contours represent trees placed by software tools). Subsequently, points of all trees were projected onto the digital terrain model. Three-dimensional models of trees of different sizes were then placed at each point as the base of the trunk (different sizes and irregular distribution of base points later created an impression of a forest close to reality).
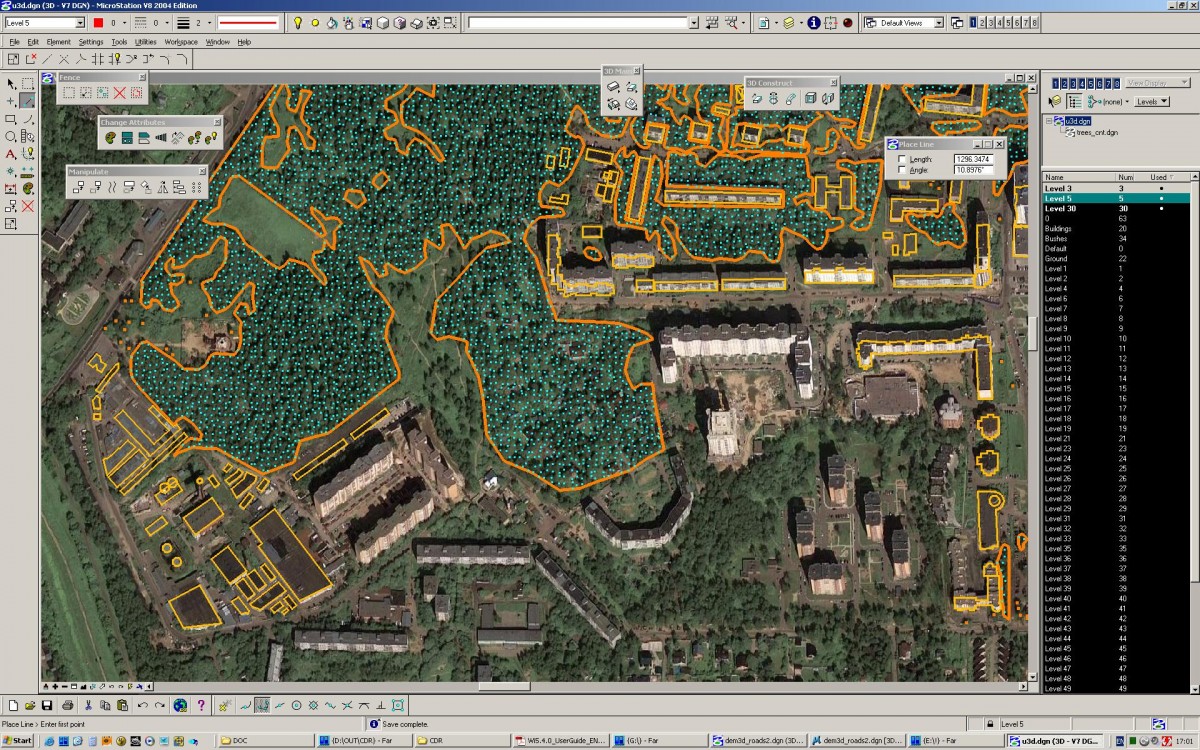
Figure 13 - Example of vegetation contours with placed tree bases.
The three-dimensional tree model consists of three facets (each of which is a flat image of the plant) intersecting along a single line (trunk line) (Figures 14 and 15). Thus, the tree model does not differ from those used in computer games that simulate three-dimensional space.
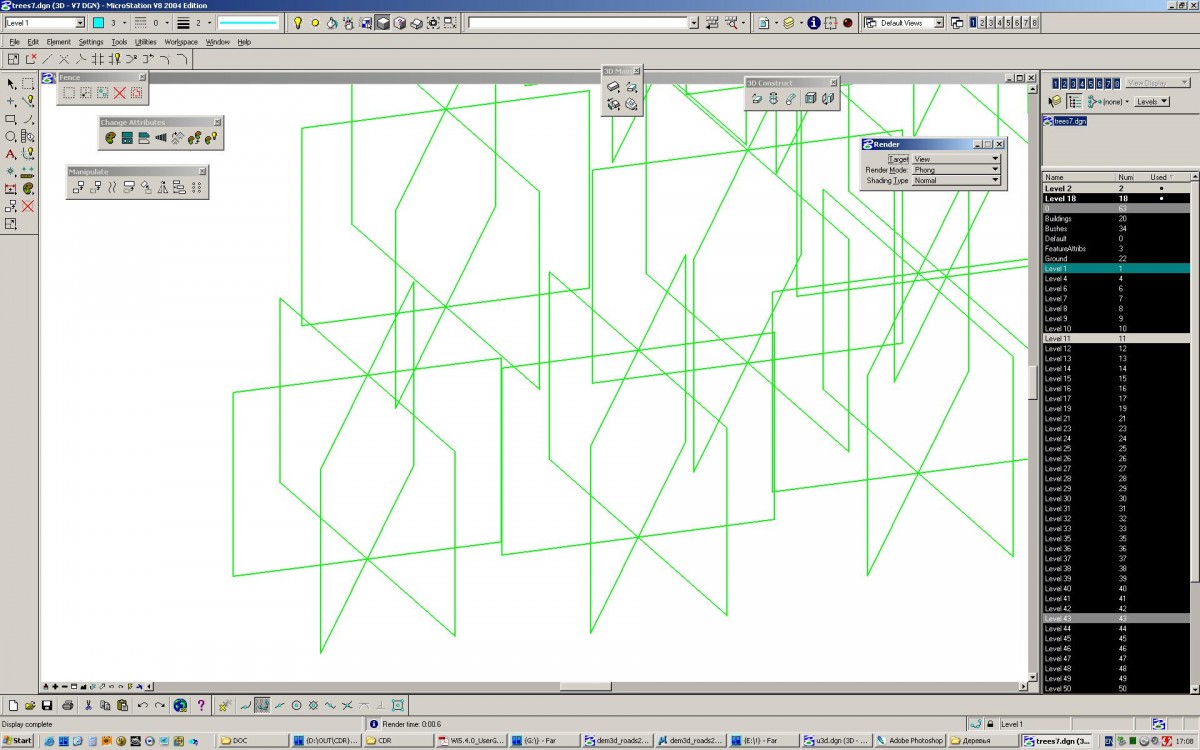
Figure 14 - Enlarged image of tree frameworks in isometry.
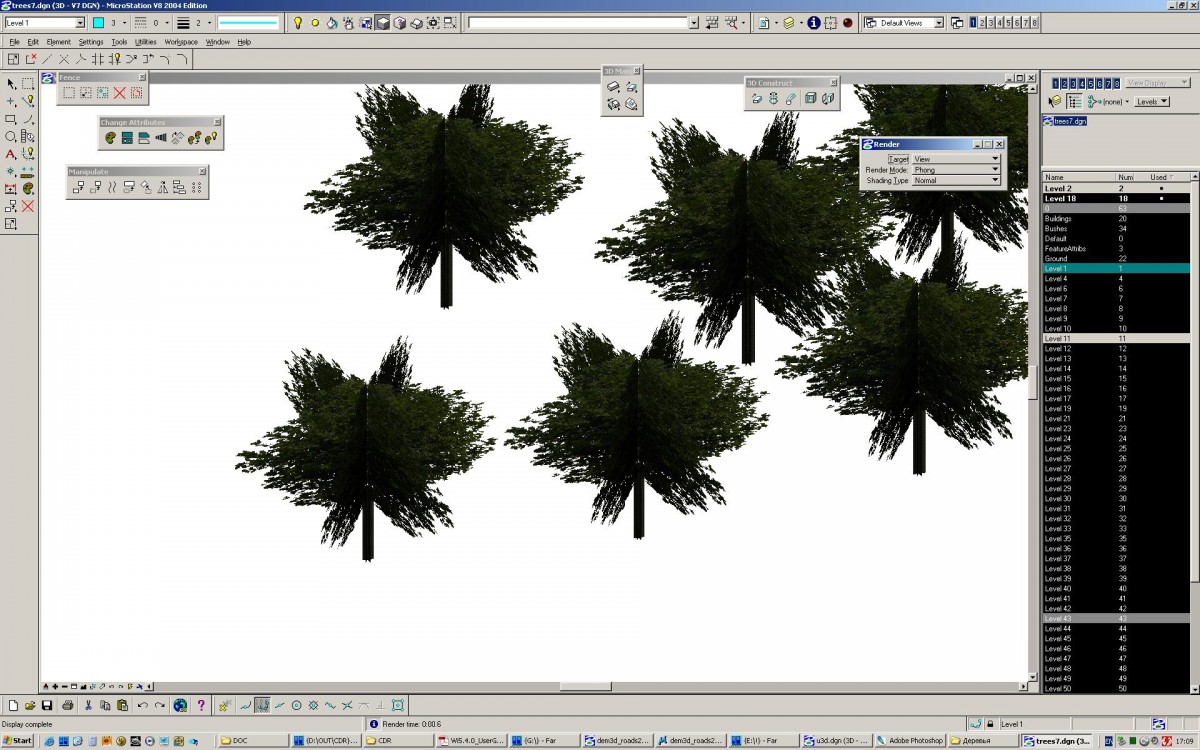
Figure 15 - Placement of three-dimensional tree models.
Subsequently, various texturing options of the digital terrain model were considered to choose the best representation of vegetation on the future map. This included placing flat forest contours on the terrain because later different textures were applied to them. Both vegetation contours and streets (see below) after being "planted" on the terrain become part of the digital terrain model, colored differently, effectively "cutting out" these areas from the model.
The problem of "embedding" buildings beneath the DTM was addressed during vector graphics processing. The issue of "building underground" was resolved in two ways: rotating the base plane (and thus the entire structure) nearly parallel to the part of the DTM where it rests, or increasing the building height (Figure 18).
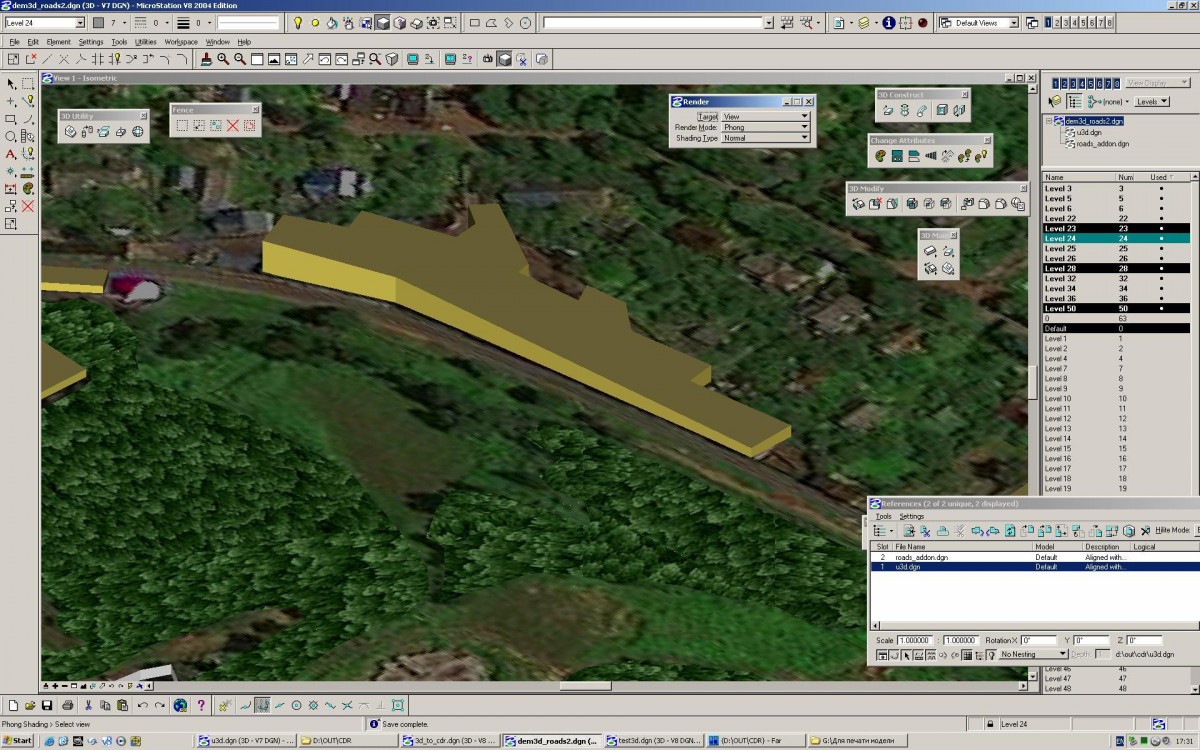
Figure 18 - Corrected version of building model alignment with digital terrain model.
Deciduous tree models were used to simulate vegetation. However, ignoring coniferous trees and shrubs reduced the realism of the model. Another issue was the introduction of textures into vegetation areas as an alternative to volumetric tree models.
Despite this issue being relatively minor and having various tree models in the library, we limited ourselves to introducing only one type of tree. This was due to difficulties encountered when using different plant models: software glitches and the recognition of various plant species in the image (down to field surveys). However, the problem was partly resolved by placing trees randomly and orienting their facets randomly, as well as varying their size (this approximated the image to reality and helped avoid moiré patterns). The difficulty in introducing textures was related to "planting" vegetation areas on the DTM.
In connection with street design, it is worth mentioning the profiling of roads and streets, that is, their planar construction. Essentially, streets are relatively flat strips cut into the terrain. There were also problems associated with street digitization from images: due to dense vegetation, not all streets could be identified and accurately digitized. In addition, there was an issue of imprecise automatic connection of individual street areas or fragments into larger areas (aiming to minimize their number) and subsequent overlaying on the terrain.
The issue of street profiling was not resolved due to its insignificance given the flatness of the terrain. Difficulties related to invisible parts of streets were resolved using a topographic plan image scale of 1:5,000 alongside the snapshot. The connection of street areas and their subsequent placement on the terrain was done manually after automatic processing. Rendering was used to identify issues with cutting streets from the digital terrain model, after which the model triangles were manually corrected to match reality completely.
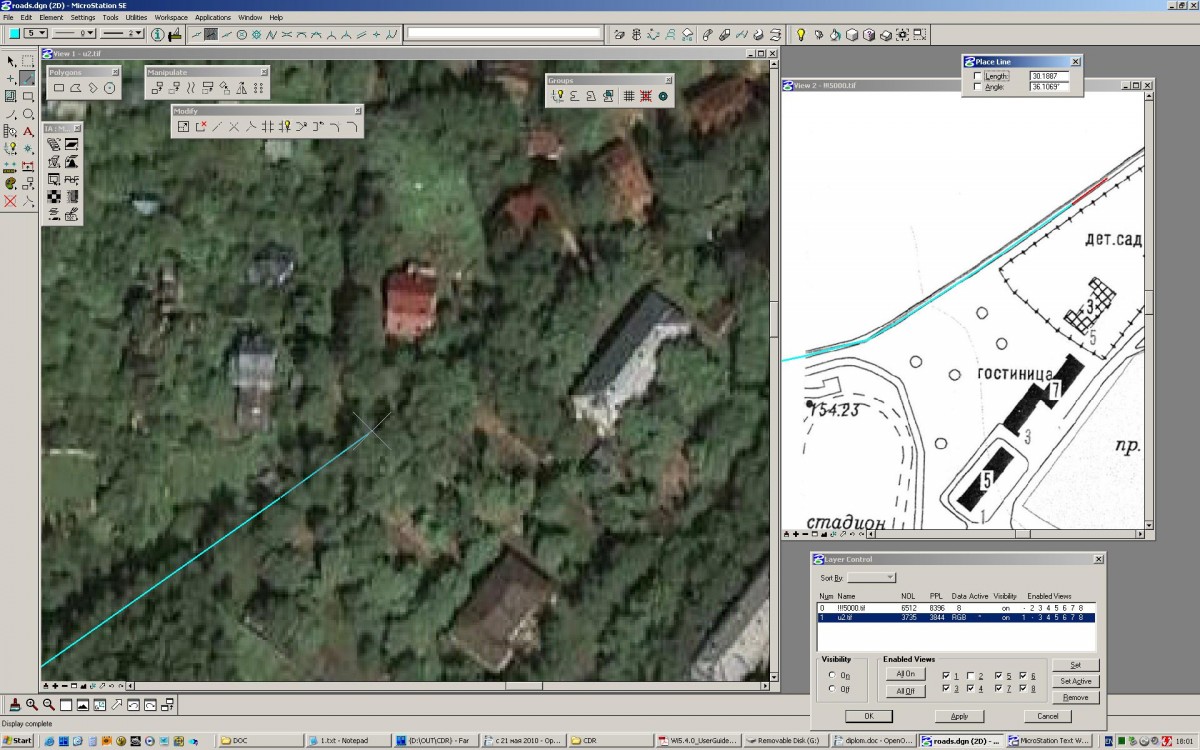
Figure 19 - Example of digitizing an invisible street from two sources.
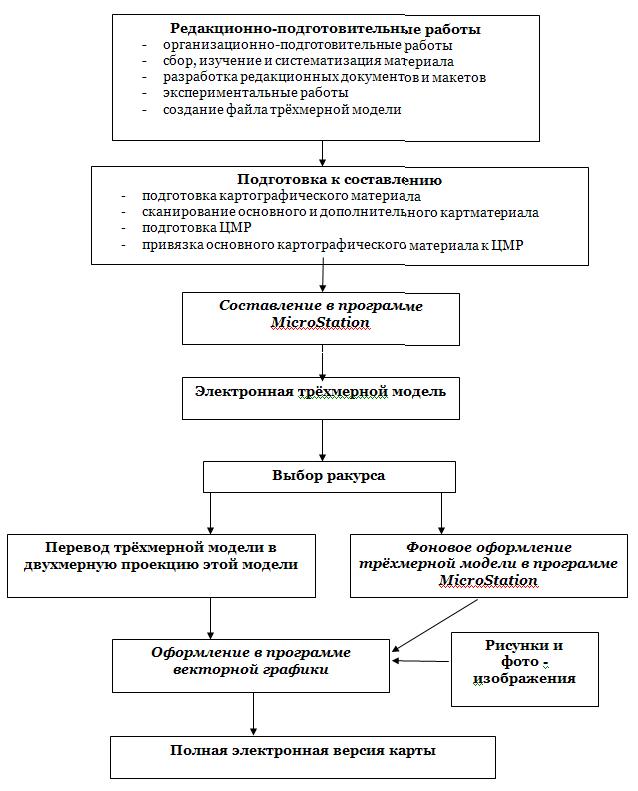
The technological scheme for creating perspective maps is shown in Figure 20:
Pakhmurin A.G., LTD"GEO Innoter"


Sat-Sun: Non-working days