of geospatial solutions
Sat-Sun: Non-working days
- Annotation
- General remote sensing approach to forestry data processing and Current directions of remote sensing for research and development of forestry support products
- Types of imagery
- Unmanned aerial vehicles (UAVs) in the service of forestry
- Ground-based forest land recorders (sensors)
- Conclusion
Annotation
After reading this article, the user will gain the most essential information and solutions through remote sensing (RS) methods for forest "health." This includes details down to individual tree metrics, monitoring as an effective tool for control, and the interdependence of Earth's ecology on this forest ecosystem. Additionally, it covers the state of the forest, damage from forest fires, and deforestation.
Many governments, state and private forestry organizations, and agencies employ geospatial technologies such as Geographic Information Systems (GIS) and satellite, aviation, and Unmanned Aerial Vehicle (UAV) imagery for various applications that support forest analysis, assessment, and management.
Forest management's areas of application in the fight for forest existence require an analysis of vegetation cover and its changes. Changing conditions due to urban expansion and increasing forest fragmentation under the influence of negative factors make the detection and analysis of anomalies exceptionally important for management, planning, and inventory. In addition, identified anomalies, placed on mapping, visually display the diversity of ecosystems and species. They allow providing an industrial assessment of forest productivity, planning its restoration, indexing forest health at specific points, combating pests and parasites, preserving the soil beneath it, ensuring the necessary moisture, and depicting the circulation of essential nutrients.
It's essential to understand that ultimately, forest management is a vital component of the global forest industry, its economy, its finances, and its production. Modern forest management is giving rise to new directions like "precision forestry" and "forest health," among others.
In 2021, the global market for "precision forestry," for instance, reached a value exceeding USD 4 billion due to the growing demand for wood in various end-use industries and the thriving "do-it-yourself" sector. It is expected that, thanks to technological advancements in forest management mechanisms, the market will continue to grow in the forecast period of 2023-2028, averaging an 8.8% annual increase and reaching a value exceeding USD 6.6 billion by 2027.
Remote Sensing (RS) plays a significant role in this development. It contributes to assessing the costs of maintaining and preserving the world's forest wealth and its forest environment from the perspective of continuing life on Earth.
Remote Sensing (RS) Approach to Forestry Data Processing
Forests are a crucial resource for sustaining life on Earth. They act as carbon sinks and are one of the most effective ways to combat climate change. They also represent a significant source of renewable energy in the form of wood fuel—currently, as much as solar, hydroelectric, and wind energy combined. Forests cover approximately 30% of all land on Earth and are home to 80% of the planet's terrestrial species (50% of animals). Therefore, they are one of the most valuable public assets on the planet, requiring protection from numerous threats, primarily stemming from human activities: agriculture, forest fires, urbanization, unregulated logging, and more.
RS methods enable addressing the following tasks for forestry development:
-
Detailed examination of suspicious forested areas identified during fieldwork for changes and distributions over large areas;
-
Monitoring anomalies over time based on image archives, maps, diagrams, reports, etc.;
-
Forest classification (deciphering species and natural growth conditions);
-
Indexing of leaf cover and individual tree stems (point analysis);
-
Recording and spreading of parasitic diseases, harmful substances, insects, etc.
-
Modeling emergencies (fires, floods, deforestation).
Large-scale and medium-scale monitoring of the forest environment can be carried out cost-effectively using remote sensing and sensor analysis from aerial or ground-based platforms. High-quality sensors (higher resolution, spectral ranges) and data collection technologies are becoming increasingly accessible, both for new Earth observation satellites, ground observation towers, and aircraft (manned and unmanned). Both individually and in combination, these various observation methods can provide valuable data for resource management or actions in response to abnormal events.
Remote sensing is primarily based on platforms: satellites, aircraft, UAVs, and remote ground imaging devices.
Sensors operating in the optical, infrared, and radar spectrums of electromagnetic waves are commonly used in practice.
The primary processing of image data from these sensors is traditionally conducted in the visible, multispectral, hyperspectral, near-infrared, and radar bands. Less frequently, but more actively in the thermal infrared, and in the USA for building 3D models of forested areas and individual trees, LIDAR is ubiquitous.

Modern Trends in Remote Sensing (RS) for Forestry Research and Product Development
As a trend, RS in forestry is moving towards detailed analysis of forest areas on a global scale, across different continents, countries, and individual plots.
The synergistic use of high-resolution optical and radar satellite data identifies historical and current forest conditions, forest size, density, and changes over time. Historical trends in deforestation, degradation, and tree phenology are derived.
For the analysis of current forest cover, solutions based on satellites, drones, or small aircraft with higher-resolution data collection methods are actively employed. Machine learning methods (artificial intelligence - AI) can be used for identifying forest cover over large areas and determining tree species.
Developed methods have been applied for over 10 years in reforestation and forest restoration projects, as well as in sustainable forest management:
Baseline Assessment
• Analysis of historical forest inventory and its dynamics.
• Analysis of current forest inventory using AI.
• CO2 (carbon dioxide) accounting.
• Development of future scenarios for sustainable management.
• Verification of CO2 certificates.
• Long-term monitoring.
Deforestation and Forest Degradation
The GEO Innoteer approach to monitoring, based on synergistic use of high-resolution optical and radar data, identifies the current state of forests, forest size, density, and changes over time. Historical trends in deforestation and forest degradation can be compared with current and future activity data.
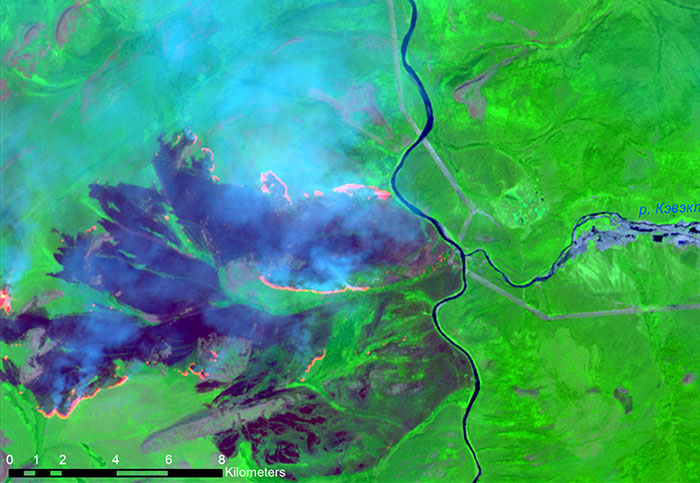
Wildfire Consequences
Forest fires annually affect millions of hectares of tropical forests, especially in Southeast Asia, Russia, and Brazil. Repeated fires cause a gradual degradation of tropical and coniferous forest ecosystems.
Remote sensing provides an assessment of the impact of fires on the forest ecosystem and biodiversity in spatial and temporal scales. Forest fires alter the composition of forest vegetation, suppressing some species and stimulating the growth of others. Often, forests become more susceptible to fires because subsequent fires burn with greater speed and intensity, resulting in higher tree mortality. Forest managers can use data on fire impact and frequency to prevent fires and improve firefighting and forest management adaptation.
Forest Species Composition
Different types of forests require different management and protection measures. Dominant tree species are often unknown variables when planning forest resource use or managing protected areas. Using multi-temporal satellite data, different tree species' phenology can be obtained. Combining this information with digital elevation models, digital surface models, and canopy structure parameters, various types of forests can be mapped with high spatial detail.
Assessment of Forest Biomass
Combined RS methods provide forest biomass estimation with up to 80-90% accuracy, allowing conclusions to be drawn about other aspects of forest composition, carbon, oxygen, and forest ecosystem survival as a whole.
In 2023-2025, the RS community in the field of forestry outlines research directions:
-
Classification, detection, and segmentation of vegetation cover.
-
Detection and monitoring of animal movements in the forest environment.
-
Measurement of moisture, temperature, and vegetation cover biomass.
-
Detection and segmentation of fire, smoke, and burnt areas during forest fires.
-
UAVs in forest environment monitoring.
-
Multi-spectral and hyperspectral image sensors and forest analysis methods.
-
Geolocation and mapping of events and landmarks in forest areas.
-
Data collection from cameras and onboard sensors of manned and unmanned aircraft, spacecraft.
-
Publicly available datasets containing aerial photos/videos of the forest environment.
-
Benchmarking of aerial photo/video analysis methods in forest conditions.
-
3D reconstruction of the forest environment using aerial photography, video, LiDAR, and Radar.
-
Real-time data analysis for early detection and prediction of forest fires.
-
Integration of large-scale satellite data with high-latency and small-scale aerial data with low latency.
Primary Sources of Remote Sensing Data - Images of Forests from Satellite, Aviation, and UAV Sensors
Imaging from Optical and IR RS Spacecraft
The assessment of forest resources using remote sensing began in the first half of the 20th century with the creation of local forest maps based on aerial photography.
The greatest contribution to the study of global forestry has been made by Earth remote sensing satellites (ERS):
Since 1972, with the launch of the first satellite sensor for Earth resource monitoring (ERTS - LANDSAT, 16 channels), significant advances have been made in remote sensing technology, allowing the assessment of forest resources over much larger areas. Technical specifications: sensors in panchromatic (15-meter resolution) and multispectral (including near and far thermal IR, with resolutions of 30 and 60 meters, respectively). There are three levels of detail:
-
Level one relates to information about the spatial extent of forest cover, which can be used to assess dynamics;
-
Level two includes information about species within forest plots;
-
Level three provides information on the biophysical properties of forests.
Evaluating such information about forests allows for comprehensive monitoring of forest resources. The combination of remote sensing technologies with analysis methods, along with advancements in ecosystem modeling, has played a critical role in mapping, monitoring, and managing forest resources. LANDSAT-8 and 9 (USA) are still considered the most accessible and preferred satellites for capturing and subsequently analyzing forest resources.

Fig. Subsets of Landsat 8 images in bands 6, 5, 4 (R, G, B) for location A, acquired on (a) June 6, (b) August 25, and (c) October 28; and subsets of forest cover maps generated with (d) RF, (e) SVM, and (f) DT classifiers.
SENTINEL-2A and 2B (European Union) satellites are equipped with an optical-electronic multispectral sensor for imaging with resolutions ranging from 10 to 60 meters in the visible, near-infrared (VNIR), and shortwave infrared (SWIR) spectra, including 13 spectral channels. For example, using multispectral imagery from these satellites, three classification methods (artificial neural network (ANN), support vector machine (SVM), and spectral angle mapper (SAM)) were researched and accepted for comprehensive mapping of secondary forest cover.

Fig. Comparison of Sentinel-2A spectral bands with Sentinel-2A RGB imagery of forest areas
Practically analogous to LANDSAT, in terms of characteristics, is the satellite ASTER (USA). Space images obtained by the ASTER equipment from the Terra satellite have 14 spectral bands: 3 in the visible and near-infrared, 6 in the mid-infrared, and 5 in the thermal infrared, with spatial resolutions of 15, 30, and 90 meters, respectively, and a frame size of 60x60 km. For example, Terra/ASTER data have a high potential for distinguishing peat bog forests in Canada based on vegetation class and forest cover density. Maps of forest cover density class and vegetation class were obtained for many forest areas. The accuracy of the results was calculated based on the Maximum Likelihood Classification (MLC) confusion matrix.

Fig. Color infrared composite image (channels 321) of ASTER images taken on April 28, 2007. The center of this subset is an area covered with forests and continuous forest areas.
More high-quality images in terms of resolution for forestry tasks, but with fewer channels in the multispectral range, can be obtained from the SPOT satellites (Azerbaijan/France). The spatial resolution is 1.75 - 6 meters. SPOT-6/7 images were used to create the largest global Urban Atlas database, including forestry, which is used to calculate multiscale forest morphological features using the Random Forest classifier.

Fig. Location of the training sample for simple random sampling and stratified random sampling on SPOT 6/7 false-color image composites in 2018-2019.
And finally, high and super high-resolution satellites (PLANET Lab and MAXAR).
PlanetScope is a constellation of nanosatellites. The uniqueness of the group is that in one day, the satellites capture more than 200 million square kilometers and cover almost the entire world with the most up-to-date images. The satellites have a spatial resolution of 3.7 meters in four spectral channels (RGB+NIR), with no panchromatic channel. Satellite imaging is continuous, allowing them to work completely autonomously: they do not need to be programmed for new imaging. Using PlanetScope, an open portal was created for forestry professionals to see which trees were recently removed due to bark beetle activity and which ones remained standing due to bark beetle invasion.

High-frequency high-resolution images provide continuous monitoring of forest management activities - from planning to logging and reporting.
WorldView-3 is the first commercial super high-resolution multispectral satellite with a large payload. With the WorldView-3 satellite, there is a 31 cm resolution in panchromatic mode, 1.24 m in multispectral mode, 3.7 m in shortwave infrared (SWIR) channels, and 30 m with the CAVIS equipment. Importantly, the satellite has an additional red band that is sensitive to vegetation. Identifying tree species is an important issue in forest management and monitoring. In recent years, the identification of tree species based on high-resolution spatial imagery at 0.3 m spatial resolution from WorldView-3 has been extensively studied. This is because some tree species have a very high market value for wood. In addition, tropical forests store a large carbon stock, contributing to a vast amount of aboveground and underground biomass. The most important bands in classification were the blue bands, followed by bands related to the red bands.

Evaluation of tree stocks from WorldView-3 images.
So far, among optical and multispectral range satellites, there is a unique hyperspectral satellite, Earth Observation EO-1, which has already ceased to exist in orbit but is actively used in the archive. The three main instruments on board EO-1 are ALI (analogous to LANDSAT), Hyperion, and Linear Etalon Imaging Spectrometer Array (LEISA) Atmospheric Corrector (LAC). Hyperion is a grating spectrometer with a 30-meter ground resolution, covering a 7.7 km strip. It captures in the spectral range of 400-2500 nm with a 10 nm interval for each of the 220 channels. LAC is a spectrometer that covers the spectral range from 900-1600 nm and was used for one year to monitor atmospheric water absorption lines for atmospheric correction in multispectral images. Hyperion hyperspectral images with Random Forest (RF), Support Vector Machine (SVM), and Multivariate Adaptive Regression Splines (MARS) classifiers were obtained for various forest cover groups, namely broadleaf and coniferous forests. Statistical data obtained from the classification confusion matrix were widely used to assess the accuracy of thematic maps obtained.

Image obtained from Hyperion (left) in false colors (R: band 29, G: band 14, B: band 7; Hyperion subset (center) covering the study area; (right) SVM-classified image covering an enlarged part of the scene using orthophotos.
You can order from us


Radiosatellite, Images, and Forest Management Data
Forest mapping and monitoring often rely on expensive and labor-intensive fieldwork. Satellite remote sensing data can facilitate these procedures for large forested areas. Radar images with synthetic aperture radar (SAR), obtained from high-resolution satellites such as TerraSAR-X, Cosmo SAR-X, ALOS PALSAR, RADARSAT-2, and GF-3, are widely used for large-scale forest mapping and monitoring.
High-resolution spotlight (HS) images have been repeatedly obtained for deciduous and coniferous forests in different regions of continents and for different types of forest trees.
Proper interpretation of SAR images requires adequate preprocessing of the data. The quality of the digital elevation model (DEM) used as a reference is of paramount importance for this purpose. Analyzing the impact of DEM quality on the accuracy of forest type mapping based on SAR data is crucial. The use of high-resolution DEMs (5 meters), obtained, for example, through airborne laser scanning (ALS), for orthorectifying SAR images has been essential in reducing pixel misalignment errors and improving forest type classification accuracy. There was no significant difference between using the ALS digital surface model (DSM) or digital terrain model (DTM) for orthorectification. Backscatter analysis showed that areas dominated by coniferous trees typically have lower backscatter values (s0) than areas dominated by deciduous trees. Forest type classification results from images under leaf-off and leaf-on conditions were similar. However, the combination of leaf-off and leaf-on images, preprocessed using ALS DTM, resulted in the highest overall accuracy with Kappa coefficients of 0.41 and 0.49, respectively. Forest type classification using SAR images preprocessed with SRTM DEM showed low accuracy with a Kappa coefficient of less than 0.10.

Fig. Composite image TerraSAR-X amplitude components from the covariance matrix (left); land use/land cover classification obtained from the elements of the covariance matrix + entropy (right).
Radar sensors are particularly important in Earth observation as they can capture images independently of cloud cover and at any time of day or night. From space, they can capture extensive areas spanning over 100 kilometers.
Environmental conservationists have shown that radar satellites can be used to monitor systematic deforestation or illegal logging in forests. The global economy, especially the forest industry, is primarily concerned with forest management. This is especially true for tropical forests (e.g., the Amazon in Brazil) due to their vast size and prevailing weather conditions, which can only be adequately observed using radar sensors. Forested areas are a key area of scientific interest because their vast biomass reserves directly affect greenhouse gas effects. Significant amounts of carbon dioxide are released from forests during vegetation removal or decomposition. Large-scale slash-and-burn practices are particularly critical because carbon stored in forests is released directly into the atmosphere, resulting in high concentrations of greenhouse gas carbon dioxide. In contrast, planned forest logging, for example, as a source of timber, releases carbon reservoirs contained in forests over a longer period and with a significant delay.
High-resolution radar images obtained from Sentinel-1, in addition to the super high-resolution TerraSAR-X, enable continuous forest monitoring 365 days a year. The Radar Satellite Data and Analysis Database (RADD) in collaboration with Global Forest Watch, an international organization for forest monitoring, and Google (which stores a vast amount of radar satellite data analyzed by the alert system) pinpoint deforestation in tropical forests.

Fig. TerraSAR-X Satellite Image - Tropical Forests in Bolivia
The RADD technology allows zooming in on a 10x10 meter area, meaning you can see gaps in the forest canopy after tree removal.
Simultaneously, the European Space Agency has commissioned a new radar satellite. The European Space Agency's Biomass Earth Explorer, equipped with a 12-meter radar antenna, is set to launch in 2023 and will penetrate the forest canopy to conduct a global study of Earth's forests over its five-year Biomass mission.
Trees are an integral and beloved part of our environment, and they also hold clues to our collective future. Knowing the amount of carbon stored in forest biomass will help us better understand climate change and its potential consequences for the global carbon cycle.
To achieve this, biomass will be measured using SAR, creating maps of tree height and volume. To see through the tree canopy to the trees themselves, Biomass will use a long-wavelength P-band radar, which has never before flown in space.

Fig. Penetration depth through the forest canopy in different radar wavelength ranges
Currently, there are a significant number of satellites in Earth orbit in optical, IR, hyperspectral, and radar ranges, but they have not yet reached the commercial level of the aforementioned satellites, especially in the relatively specific field of forest management analysis.
Forest Aerial Photography

Aerial photographs have been and continue to be the most frequently used source of remote sensing data in forestry, especially for assessment, inventory, and monitoring of natural resources. It was expected that their use in operational forest management would decrease as the technical capabilities of new UAVs (Unmanned Aerial Vehicles) and satellite sensors improved. The incentives were clear. However, in practice, space, aerial photography, and UAVs complement rather than exclude each other today.

Fig. Aerial photographs of the crowns of 11 tree species for blind identification.
In addition, aerial photography materials allow for the mapping of key forest management variables, such as tree height and density, "wall to wall" on the map, which is necessary for planning and forest management purposes.

Fig. (a) Broadleaf tree; (b) Coniferous tree; (c) ∆h - the difference in crown geometry height corresponding to the GSD RCM/CHM (GSDd) size. It depends on the value of α. Broadleaf trees show values within reasonable limits from 5° to 45°, while for coniferous species, this indicator exceeds 45°.
Modern aviation sensors, including digital photos and videos, radar, and LIDAR, are typically installed on small aircraft to ensure that the flight speed during imaging does not exceed 150-200 km/h.
Aviation radar can be used to monitor various forest species.

Fig. Complex mixed mountain forest (combination of multispectral + radar).
Assessments of forest cover, forest carbon stocks, and carbon emissions resulting from deforestation and degradation are becoming increasingly important components of sustainable resource management, biodiversity loss mitigation, and climate change mitigation policies. Satellite remote sensing is the only means of regularly mapping the global forest cover. However, forest classification using optical data is limited due to its insensitivity to the three-dimensional structure of the canopy and cloud cover, which obscures many forest areas, especially in the equatorial and mountainous regions. Radar sensors with synthetic aperture (SAR) on aviation platforms are increasingly used to address these issues, primarily in the L, C, and X bands of the electromagnetic spectrum. The advantages of polarimetric SAR in the S-band for forest characterization have been evident and proven. The Michigan Microwave Scattering Radiation (MIMICS-I) radiative transfer model is used to understand scattering mechanisms in forest canopies in the S-band. The MIMICS-I model shows strong backscattering sensitivity of S-band radar to forest canopy compared to soil characteristics at all polarizations and incidence angles. SAR images from an aircraft over the mixed forest of the temperate zone Savernake Forest in southern England are analyzed for their informativeness. Based on the results of modeling, backscattering of HH- and VV-polarization radars in the S-band and forest degradation index (RFDI) are used in forest/non-forest classification using maximum likelihood estimation at spatial resolutions of 6 m (overall accuracy 70%, κ = 0.41) and 20 m (overall accuracy 63%, κ = 0.27). The conclusion is that aviation SAR, such as the NovaSAR-S satellite, is likely suitable for monitoring forest cover and its changes.

Fig. Carbon emissions detected by aviation radar in a forest area.
Forest Aerial Photography
Aerial photographs have been and continue to be the most frequently used source of remote sensing data in forestry, especially for assessment, inventory, and monitoring of natural resources. It was expected that their use in operational forest management would decrease as the technical capabilities of new UAVs (Unmanned Aerial Vehicles) and satellite sensors improved. The incentives were clear. However, in practice, space, aerial photography, and UAVs complement rather than exclude each other today.
Fig. Aerial photographs of the crowns of 11 tree species for blind identification.
In addition, aerial photography materials allow for the mapping of key forest management variables, such as tree height and density, "wall to wall" on the map, which is necessary for planning and forest management purposes.
Fig. (a) Broadleaf tree; (b) Coniferous tree; (c) ∆h - the difference in crown geometry height corresponding to the GSD RCM/CHM (GSDd) size. It depends on the value of α. Broadleaf trees show values within reasonable limits from 5° to 45°, while for coniferous species, this indicator exceeds 45°.
Modern aviation sensors, including digital photos and videos, radar, and LIDAR, are typically installed on small aircraft to ensure that the flight speed during imaging does not exceed 150-200 km/h.
Aviation radar can be used to monitor various forest species.
Fig. Complex mixed mountain forest (combination of multispectral + radar).
Assessments of forest cover, forest carbon stocks, and carbon emissions resulting from deforestation and degradation are becoming increasingly important components of sustainable resource management, biodiversity loss mitigation, and climate change mitigation policies. Satellite remote sensing is the only means of regularly mapping the global forest cover. However, forest classification using optical data is limited due to its insensitivity to the three-dimensional structure of the canopy and cloud cover, which obscures many forest areas, especially in the equatorial and mountainous regions. Radar sensors with synthetic aperture (SAR) on aviation platforms are increasingly used to address these issues, primarily in the L, C, and X bands of the electromagnetic spectrum. The advantages of polarimetric SAR in the S-band for forest characterization have been evident and proven. The Michigan Microwave Scattering Radiation (MIMICS-I) radiative transfer model is used to understand scattering mechanisms in forest canopies in the S-band. The MIMICS-I model shows strong backscattering sensitivity of S-band radar to forest canopy compared to soil characteristics at all polarizations and incidence angles. SAR images from an aircraft over the mixed forest of the temperate zone Savernake Forest in southern England are analyzed for their informativeness. Based on the results of modeling, backscattering of HH- and VV-polarization radars in the S-band and forest degradation index (RFDI) are used in forest/non-forest classification using maximum likelihood estimation at spatial resolutions of 6 m (overall accuracy 70%, κ = 0.41) and 20 m (overall accuracy 63%, κ = 0.27). The conclusion is that aviation SAR, such as the NovaSAR-S satellite, is likely suitable for monitoring forest cover and its changes.
Fig. Carbon emissions detected by aviation radar in a forest area.
Ground Sensors for Forest Monitoring
Digital technologies have become prevalent in forest management, including IoT (Internet of Things).
IoT and wireless systems create significant opportunities for forest management. IoT makes it possible to make monitoring economically efficient in forests that are currently not being monitored and to complement specialized tree instruments (SFM1, PSY1, DBV60) for spatial monitoring in addition to more localized intensive monitoring of a smaller number of representative trees. The HUB was developed as a gateway for use in remote areas, such as forests. It has both LoRa and RF capabilities for data collection and 3G, satellite, etc., for data transmission. It is designed to have low power consumption (solar-powered), be environmentally robust, and store data long-term in CSV files.

Fig. Monitoring points for the "health of each tree" using ground instruments
There are four common reasons for implementing a ground monitoring system in the forest:
-
Production systems - quantitative assessment of tree growth rates, productivity, etc.
-
Watershed management - quantitative assessment of inputs (precipitation) and outputs (water use by plants, drainage, runoff).
-
Biodiversity management - quantitative assessment of tree health and stress to ensure that the forest system continues to grow for generations.
-
Science - research and understanding of climate change and its management.
In all cases, the same or similar sensors are used, but with different spatial densities and measurement frequencies over time.


Ground sensors in the IoT network monitor the condition of each individual tree
Companies exist that manufacture and process complex ground sensors such as LIDAR for each tree. In collaboration with the European Space Agency, responsible for satellite data collection and aerial photography from drones, the ground "laser radar" by Treemetrics 3-D scans the forest to determine the straightness and thickness of each tree. With this data, forest owners will have a more accurate understanding of each tree's potential and, consequently, whether the tree should be felled. This will reduce, if not eliminate, losses suffered by the logging industry, saving money for forest owners in the process.
According to a report, Treemetrics' solution is used by state forest agencies in 26 countries and private forest owners.

Fig. LIDAR image of tree trunks (each tree trunk's condition is color-coded) obtained from the Treemetrics sensor
Atmospheric conditions above forest areas are recorded using various ground instruments.

Conclusion
Remote sensing is becoming a crucial method for studying the details of forest management. Its technologies enable the investigation of the impact of various anomalous factors, changes, and disruptions in forest management on the quantity, function, and dynamics of forests on large spatial scales.
Over the past decade, the range and diversity of sensing systems, as well as the diversity of applications of remote sensing in forestry, have undergone significant changes. To meet various information needs in forest management, various data sources are used, such as field studies, aerial photography (UAVs), and satellite images, depending on the required level of detail and the extent of the study area. Research that has used remote sensing has improved the understanding of the areas studied, down to individual trees.
The practice of remote sensing in forestry confirms the effectiveness of using mapping to delineate the distribution of forest ecosystems, conduct thorough inventory, monitor global fluctuations in plant productivity by season, and assess the three-dimensional (3D) structure of forests.
At the strategic level of forest planning or in general resource distribution planning over extensive territories, remote sensing plays not just an important role in assessing and monitoring forest cover, but is essentially an indispensable method for addressing the challenges of forest conservation and rational use.
Sat-Sun: Non-working days