of geospatial solutions
Sat-Sun: Non-working days
The activities of the modern oil and gas complex require extensive use of geospatial information and geographic information systems (GIS), which enable solving various tasks ranging from project work and environmental monitoring to property and territory management of enterprises. Specialists argue that up to 80% of information related to production activities has spatial distribution, underscoring the importance of geospatial information, primarily sourced from satellite imagery.
In the oil and gas industry, GIS and satellite imagery can be applied to address numerous tasks, such as:
- Selecting optimal corridors for pipeline construction;
- Displaying the status of construction projects and prioritizing them;
- Analyzing strategies for maintenance work and budget allocation;
- Collaborative mapping and analysis;
- Monitoring and collecting statistical data on the operation of oil and gas facilities;
- Assessing the condition of oil and gas facilities;
- Locating accidents and affected areas;
- Identifying hazardous areas;
- Selecting optimal routes for maintenance crews and many more;
- Geology and geophysics, mineral exploration;
- Pipeline design and laying;
- Solving network communication tasks;
- Asset and territory management, equipment and pipeline condition monitoring;
- Environmental aspects (oil spill monitoring, damage assessment, modeling, etc.);
- Management tasks, planning.
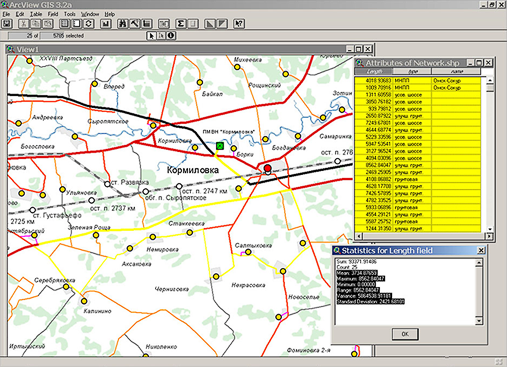
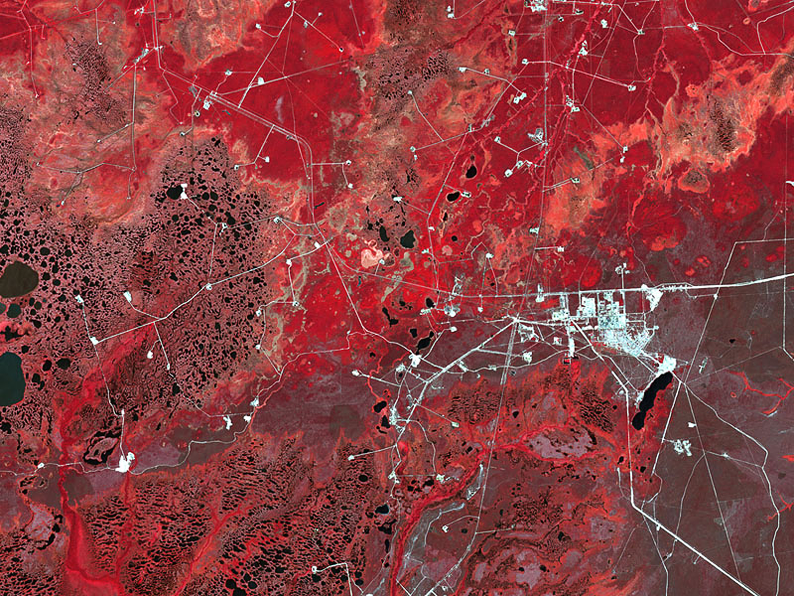
Figure 1. Example of GIS for calculating oil product delivery routes
Space images are used already at the stage of studying geological structure and prospects of oil and gas bearing capacity of sedimentary basins; they are used for complex analysis of all available remote sensing, landscape and geological-geophysical data. To study geological objects on space images, they are transformed and mounted, color compositions are created, filtering, automatic classification, lineament analysis (lineament extraction in visual and automatic mode, construction of rose-diagrams and lineament density schemes).
Once the prediction is made, a survey program is developed, the basis of which is an accurate base map. Space imagery and GIS enable the creation of digital base maps using vectorization of paper maps, field geodesy and satellite positioning systems (GPS). The user can build base maps with the latest well data, seismic data, at any scale, for any area, with any level of detail.
It is envisaged to process information in the form of digital electronic maps and space images of the area along the pipeline routes, to integrate geographic information with existing data in the unified automated management system.
Developed GIS-technologies should include a mechanism of constant updating of spatial and semantic data on the basis of the latest satellite technologies of object location and high-resolution aerospace imagery. On the basis of satellite navigation and GIS-technologies a monitoring system should be formed, the information from which can be accumulated, processed, stored and delivered to end users when solving the tasks of capital construction, repair and modernization of heat power facilities, assessing their condition, management and safety.


Spacecrafts — sources of satellite imagery as of January 1, 2011
The urgent need for satellite imagery has led to the emergence over the past decade of a whole constellation of spacecraft providing imagery with unprecedented resolution. The GeoEye-1 spacecraft has already been launched, providing a resolution of 0.41 meters and the highest accuracy of image geolocation of 3 meters without ground control. Such capabilities are perfectly suited for the oil and gas industry in solving many tasks.
Risunok 2. GeoEye-1 Image, Khanty-Mansiysk
If the first commercial high-resolution spacecraft (1 meter and better) were developed by American companies, since 2006 other countries have also joined in launching high-resolution spacecraft: Israel (Eros-B), Russia (Resurs-DK), Korea (Kompsat-2), and India (Cartosat-2). However, maintaining technological superiority, US companies launched the GeoEye-1, WorldView-1, WorldView-2, WorldView-3, and WorldView-4 spacecraft with resolutions of 0.3-0.5 meters.
The main parameters of existing high and medium resolution optical-electronic spacecraft are given in Table 1, where spacecraft are listed in order of increasing resolution.
Table 1. Parameters of high-resolution optoelectronic satellites
|
Launch parameters spacecraft |
Parameters of the optoelectronic camera |
Output parameters space images |
||||||||
|
Name |
Country |
Start Date |
H, kn |
Type |
f, m |
d, cm |
p, mkm |
Resolution, m |
Capture, kn |
|
|
PAN |
MS |
|||||||||
|
GeoEye-1 |
USA |
08.10.08 |
684 |
GIS |
13,3 |
110 |
8 |
0,41 |
1,64 |
15,2 |
|
WorldView-2 |
USA |
08.10.09 |
770 |
WV110 |
13,3 |
110 |
8 |
0,46 |
1,8 |
16,4 |
|
WorldView-1 |
USA |
18.09.07 |
496 |
WV60 |
8,8 |
60 |
8 |
0,5 |
- |
16,4 |
|
QuickBird-2 |
USA |
18.10.01 |
450 |
BHRS60 |
8,8 |
60 |
12 |
0,6 |
2,4 |
16,5 |
|
EROS-B |
Israel |
01.03.06 |
500 |
PIC-2 |
5,0 |
50 |
7 |
0,7 |
- |
7 |
|
Cartosat-2 |
India |
10.01.07 |
637 |
PAN |
5,6 |
70 |
7 |
0.8 |
- |
9,6 |
|
Cartosat-2A |
India |
28.04.08 |
635 |
PAN |
5,6 |
70 |
7 |
0.8 |
- |
9,6 |
|
IKONOS-2 |
USA |
24.09.99 |
681 |
OSA |
10,0 |
70 |
12 |
1,0 |
4.0 |
11 |
|
OrbView-3 |
USA |
26.06.03 |
470 |
OHRIS |
3,0 |
45 |
6 |
1,0 |
4,0 |
8 |
|
Ресурс-ДК1 |
Russia |
15.06.06 |
361-604 |
Геокон-1 |
4,0 |
50 |
9 |
1,0 |
3,0 |
28,3 |
|
KOMPSAT-2 |
Korea |
28.07.06 |
685 |
MSC |
х |
х |
х |
1,0 |
4,0 |
15 |
|
EROS-А |
Israel |
05.12.00 |
480 |
PIC |
3,45 |
30 |
7 |
1,8 |
- |
14 |
|
Formosat-2 |
Taiwan |
21.05.04 |
891 |
RSI |
2,9 |
60 |
8 |
2,0 |
8,0 |
24 |
|
Cartosat-1 |
Italy |
05.05.05 |
618 |
PAN-A,F |
2,0 |
45 |
7 |
2,5 |
- |
30 |
|
SPOT-5 |
France |
04.05.02 |
822 |
HRG HRS |
1,08 0,58 |
х х |
6,5 6,5 |
2,5; 5 10 |
10; 20 - |
60 60 |
|
ALOS |
Japan |
24.01.06 |
692 |
PRISM ANVIR-2 |
2,0 0,8 |
30 24 |
7 7 |
2,5 - |
- 10 |
35 70 |
|
IRS-1С IRS-1D |
India
India |
28.12.95 29.09.97 |
817 |
PAN LISS-3 |
|
|
|
5,8 - |
- 23,5 |
70 140 |
|
ResourceSat-1 |
India |
17.10.03 |
817 |
LISS-4 LISS-3 |
|
|
|
5,8 - |
23,5 23,5 |
70 140 |
|
RapidEye |
Germany |
29.08.08 |
634 |
REIS |
0,6 |
14 |
12 |
- |
6,5 |
78 |
|
SPOT-2 |
France |
22.01.90 |
822 |
HRV |
|
|
|
10 |
20 |
60 |
|
SPOT-4 |
France |
24.03.98 |
822 |
HRVIR |
|
|
|
10 |
20 |
60 |
Medium-resolution space systems are used to address environmental monitoring tasks, including monitoring pollution in areas of hydrocarbon extraction and transportation. This type of product is also used in hydrocarbon exploration for compiling geological, geomorphological, structural, and structural-geomorphological maps, providing material to reveal the deep structure of the territory.
Risunok 3. Terra ASTER Image, Vyngapurovskoye Field
An important feature of the years 2007-2010 is the increase in the number of launches of spacecraft with high-resolution radars. Radar images with resolutions up to 1 meter are comparable in quality to high-resolution optical images, but unlike optical equipment, synthetic aperture radars (SAR) conduct imaging regardless of weather conditions and illumination in the target area. Sometimes, customers have to wait from a week to a month for the results of optical imaging of objects in the central part of Russia. Radar systems allow fulfilling imaging requests within several days after ordering.
Radar images complement images obtained in the visible and infrared ranges, increasing the amount of information and its reliability. With radar satellite systems achieving the same spatial resolution as visible range systems, the capabilities of remote sensing from space are significantly enhanced.
Table 2. Characteristics of radar satellites
|
Name |
County |
Launch date |
Resolution, m |
Range |
Capture, km |
|
TerraSAR-X |
Germany |
15.06.07 |
1.0 |
X |
10×5 |
|
COSMO-Skymed-1 |
Italy |
08.06.07 |
1.0 |
X |
10 |
|
COSMO-Skymed-2 |
Italy |
09.12.07 |
1.0 |
X |
10 |
|
COSMO-Skymed-3 |
Italy |
24.10.08 |
1.0 |
X |
10 |
|
COSMO-Skymed-4 |
Italy |
06.11.10 |
1.0 |
X |
10 |
|
Tandem-X |
Germany |
21.06.10 |
1.0 |
X |
10×5 |
|
Radarsat-2 |
Canada |
14.09.07 |
3.0 |
X |
25 |
|
RISAT |
India |
20.04.09 |
3.0 |
С |
10 |
|
ALOS/PALSAR |
Japan |
24.01.06 |
7.0 |
L |
40 |
|
Radarsat-1 |
Canada |
04.11.95 |
8.0 |
C |
25 |
|
ERS-2 |
EKA |
21.04.95 |
26 |
C |
100 |
|
ENVISAT |
EKA |
01.03.02 |
29 |
C |
56 |
On June 15, 2007 a civilian satellite TerraSAR-X was launched, which provides radar imaging with a resolution of 1 m, and in 2007-2010 a number of other foreign radar systems with such resolution were launched. In 2010, the Tandem-X satellite was launched for a group flight together with the TerraSAR-X satellite for operational interferometric imaging with high accuracy and creation of a global DEM with a point-to-point spacing of 10 meters and height accuracy of 5 meters.
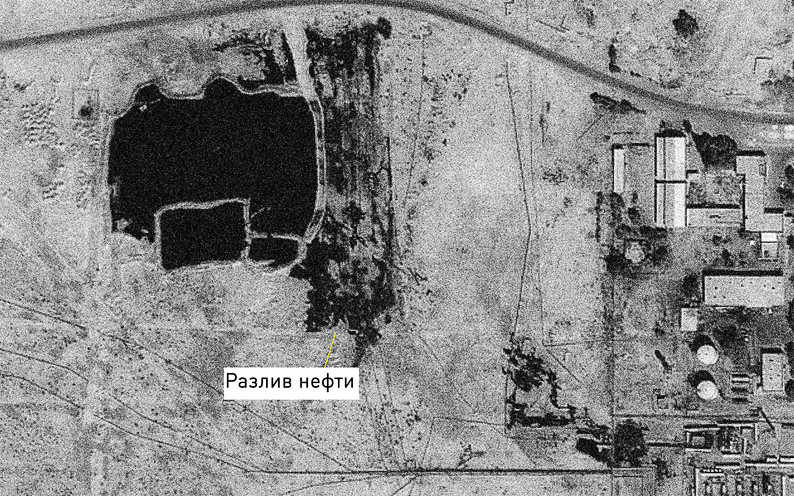
Figure 4: Example image from TerraSAR-X, SpotLight mode, Iraq
Radar images are an extremely convenient and efficient source of detailed, accurate and comprehensive terrain information - much more powerful, rapid, reliable and cost-effective than, for example, the use of space stereo pairs or aerial photographs.
Specialized interferometric imaging technologies can detect minor ground movements, which can be used to monitor pipeline conditions, detect illegal taps into oil and gas pipelines, and assess seismic hazards.
Examples of projects implemented by Innother Company based on the use of space images for oil and gas industry as of January 01, 2011
Provision of space images for the Bovanenkovo gas field facilities
Bovanenkovo oil and gas condensate field - The largest field on the Yamal Peninsula in Russia. Bovanenkovo is located on the Yamal Peninsula, 40 kilometers off the coast of the Kara Sea, the lower reaches of the Se-Yakha, Mordy-Yakha and Nadu-Yakha rivers. The field's reserves are estimated at 4.9 trillion cubic meters of gas; its design capacity is 115 billion cubic meters of gas per year.
To transport gas from the Bovanenkovskoye field, a multi-line gas transportation system is planned to be constructed linking the Yamal Peninsula and the central regions of Russia. The gas pipeline route will be over 2,400 km long, including the new Bovanenkovo - Ukhta gas transportation corridor with a length of about 1,100 km and the Ukhta - Torzhok gas pipeline with a length of 1,300 km.
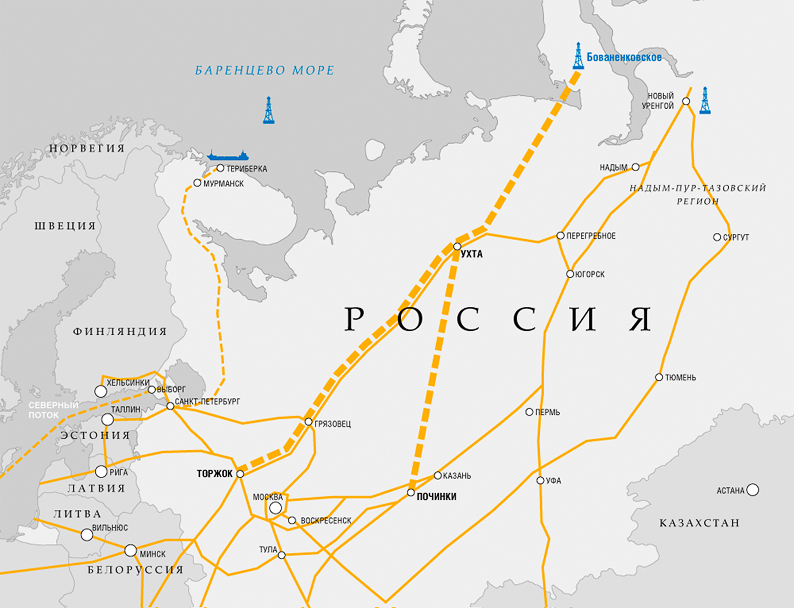
Figure 5: Bovanenkovo - Ukhta and Ukhta - Torzhok gas pipelines
Innoter provided space imagery of three objects of the Bovanenkovo field in 2010:
-
A section of the Obskaya-Bovanenkovo railroad line;
-
the Bovanenkovo-Ukhta gas trunkline;
-
ice landfast ice in the area of the gas pipeline string outlet on the eastern and western shores of the Baidaratskaya Bay.
Information provision with remote sensing data from QuickBird, IKONOS, EROS-B and ALOS PRISM satellites for the section of the Obskaya-Bovanenkovo railroad line.
Space images for the area were searched according to digital files (shp-files) provided by the Customer. The shp-file represented the axis of the railway line, on the basis of which a 3 km wide corridor was plotted. Geometric resolution of space photography data is not worse than 2.5 meters in panchromatic range.
Criteria for selection of digital information:
presence of cloud cover - not more than 20%;
relevance of the imagery - the date of the imagery is not later than 2004;
The search was performed among the following space images: GeoEye-1,WorldView-1, QuickBird, Ikonos, OrbView-3, Kompsat-2, EROS-A, EROS-B, ALOS PRISM.
QuickBird, Ikonos, EROS-B and ALOS PRISM archive images were selected for the area of the railroad line route in accordance with the selection criteria. All works were performed within the terms specified in the contract. The Customer was provided with remote sensing data of the Earth surface taking into account the requirements to the supplied data via FTP protocol, as well as copies on physical media.
Ordering of a new GeoEye-1 satellite imagery of the Bovanenkovo-Ukhta gas trunkline;
Survey parameters:
-
new imagery from GeoEye-1 satellite, 0.5 meters, color version;
-
order urgency level - standard, Geo processing level;
-
maximum cloudiness: 15%;
-
format - geotiff, digitization - 11 bits
-
UTM projection, zone 39-42, ellipsoid WGS84;
-
total survey area: 6765 square kilometers, object length - 1353 square kilometers;
-
data collection period from June 15 to August 15, 2010.
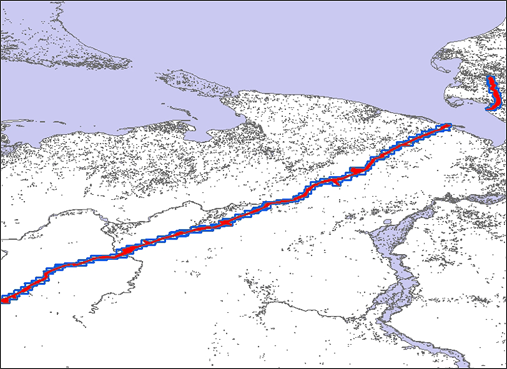
Figure 6. Scheme of the new survey coverage of the Bovanenkovo - Ukhta gas pipeline
Complex meteorological, climatic and geographical conditions of the region (short daylight period, high cloudiness, small snowless period) forced to extend the actual survey period from May 25 to the end of September. Constant monitoring of weather conditions made it possible to obtain less cloudy, snowless images and deliver them to the customer.
It was organized step-by-step both via ftp and copies on disk, ensuring a constant workload of the customer's production forces.
Provision of stereo pair data from IKONOS satellite on the landfast ice in the area of the gas pipeline string outlet on the eastern and western shores of the Baidaratskaya BayThe purpose of the work was to order, process and provide stereo pair of data from Ikonos satellite necessary for determining morphological characteristics of the landfast ice in the area of the gas pipeline string outlet on the eastern and western shores of Baidaratskaya Bay.
Requirements to the composition of the provided data:
- high spatial resolution imagery from GeoEye-1 / Ikonos satellites;
- product type - GeoStereo;
- channel - Panchromatic;
- RGB-image reduced to panchromatic channel is additionally provided;
- digital elevation model, georeferenced to terrain reference points;
- GeoTIFF data format.
The TOR requirements to the quality of provided data were as follows: georeferencing accuracy should not be worse than 2 image elements (pixels), cloudiness not more than 20%, unified coordinate system, UMT zone 39 projection on WGS84 ellipsoid.
The survey was to be carried out before June 10, i.e. before ice melting. It was necessary to have time to obtain, process and provide information meeting the above requirements.
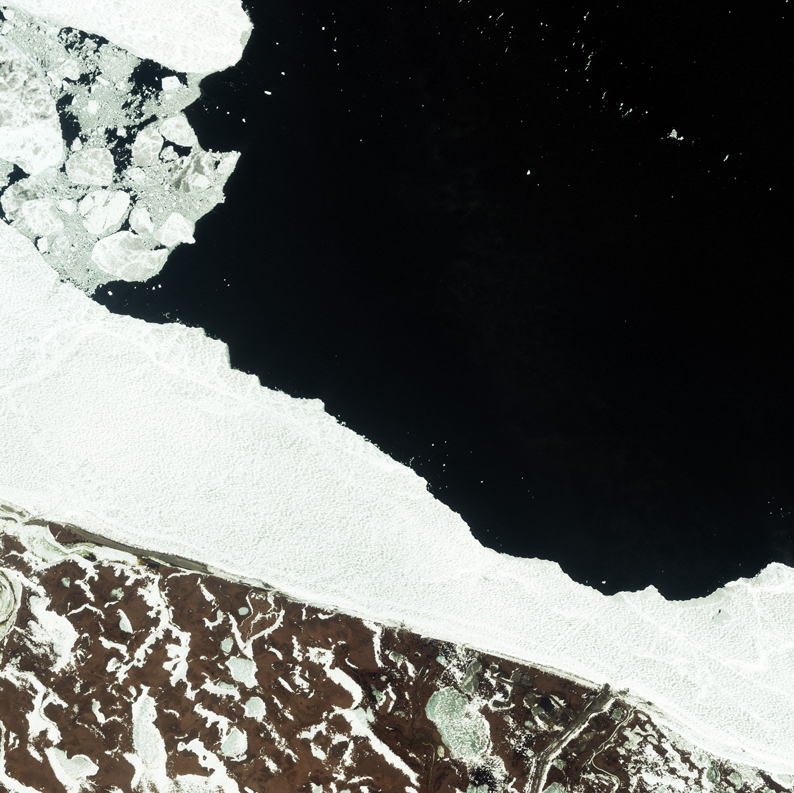
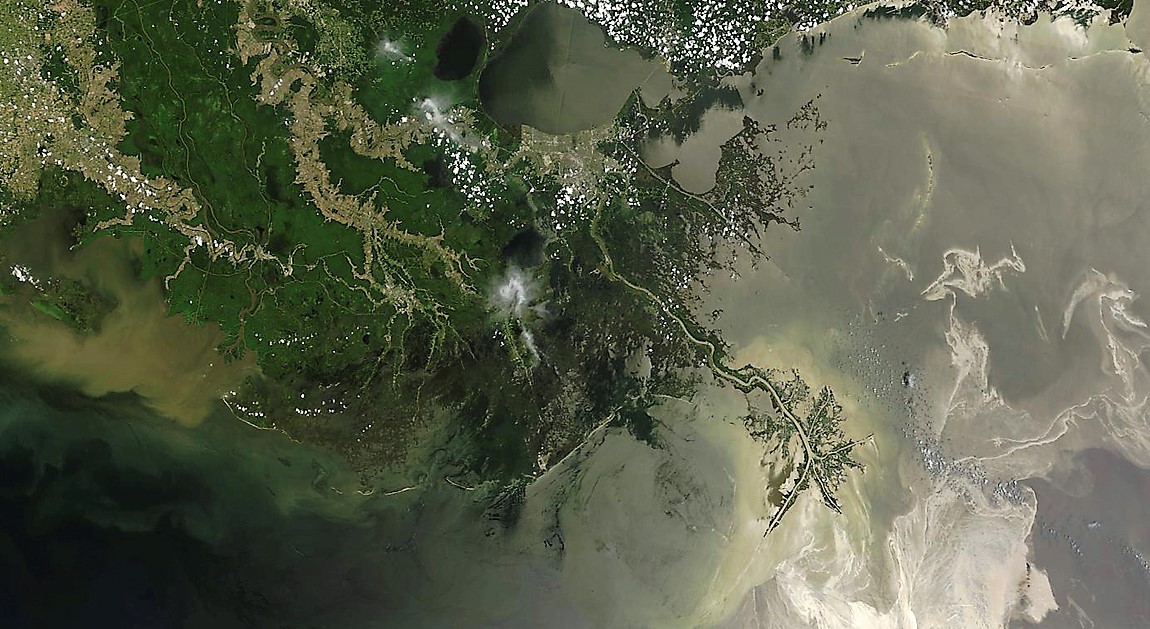
Figure 7. Baidaratskaya Bay, image from IKONOS satellite; Date of acquisition: April 21, 2010.
Creation of 1:5 000 scale orthophotomaps of the gas pipeline route area in Yamalo-Nenets Autonomous Okrug using GeoEye-1 space images.
- GeoEye-1" images, color, 0.5 m resolution;
- processing level: Geo product;
- total area: 861 sq. km;
- object coordinates: the object is represented as a shp-file;
- maximum allowable percentage of cloudiness - 15%;
- product format - GeoTIFF, bit rate - 11 Bit;
- data collection period - from July 15, 2009 to September 15, 2009.
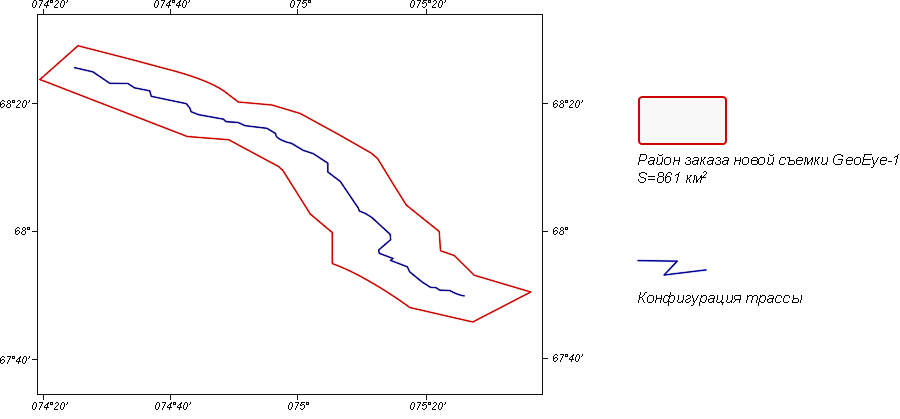
Figure 8. Scheme of GeoEye-1 space images ordering on the gas pipeline route
Analysis of all GeoEye-1 imagery produced during the survey period showed that there were 42 instrument activations. However, due to complicated meteorological conditions some of the images were not suitable for processing due to cloud cover. Cloud cover variation in all 42 images ranged from 0% to 97%. From these images, only those areas were selected that had the maximum allowable cloud cover percentage of 15%. Only those areas that were suitable for processing were cut out of the cloud images. The diagram below shows the final configuration of the selected GeoEye-1 images. The coverage area was 576 square kilometers.
The transformation was performed using rational polynomial functions, the accuracy of which is declared to be 3-5 meters. To eliminate systematic errors a number of reference points were defined on vector fragments provided by the customer. Transformation was performed in UTM projection, 43 zone on WGS-84 ellipsoid. Accordingly, coordinates of vector fragments points, represented in SK-42 coordinate system, were converted to UTM projection.
The accuracy of image orientation provided by additional reference points meets the specified requirements. A mosaic of four specified areas was created from orthorectified images. Final slicing of fragments was performed in accordance with the arrangement of 1:25000 scale maps.
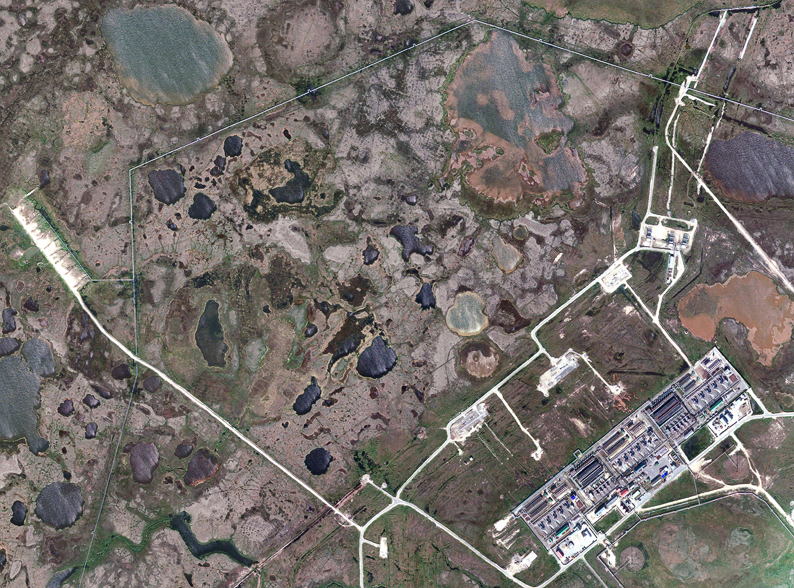
Figure 9. Example of orthophotomap
Output data are presented in GeoTiff and Erdas IMG formats. Dynamic range is 16 per channel. To reduce the size of images they were additionally divided into 2 parts.
M 1:25,000 mapping of the Urengoy-Surgut condensate pipeline facility
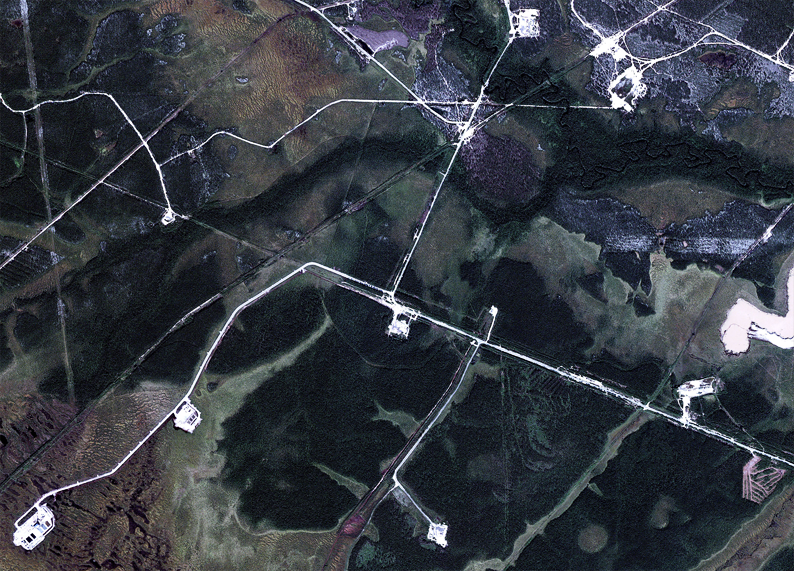
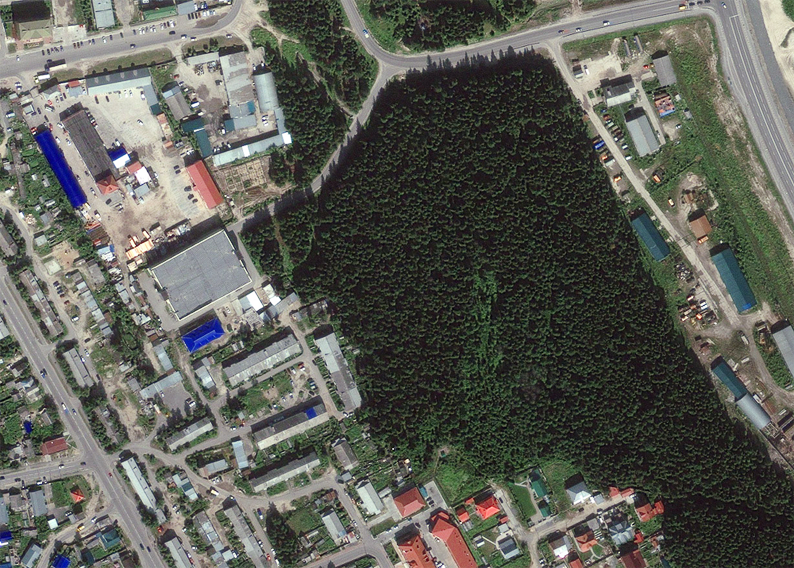
Figure 10. QuickBird image, acquisition date 07.12.2008
Creation of the DEM was carried out on the basis of space imagery materials with the resolution providing updating of cartographic materials of 1:25000 scale available (as of May 2008) in the archives of organizations supplying remote sensing data.
The relief was constructed from geo-referenced raster maps of 1:25000 scale. After that, a digital elevation matrix (DEM) was created on the basis of the constructed terrain relief. Each photo was transformed according to the elements of external orientation using the corresponding catalog of coordinates of reference points and DEM.
The obtained fragments were merged into a single raster space. Creation of image mosaics from space imagery materials was performed in strict compliance with the requirements of guiding documents. With the help of DEM, as a result of transforming the mosaic of images from space imagery materials, corrections were introduced and relief errors were eliminated.
Desk-based interpretation of the obtained image mosaic was performed. On the basis of the obtained data, vectorization of objects was performed in MapInfo 8.0 software environment, with the formation of 29 thematic layers. The attribute tables for the layers were also filled in.
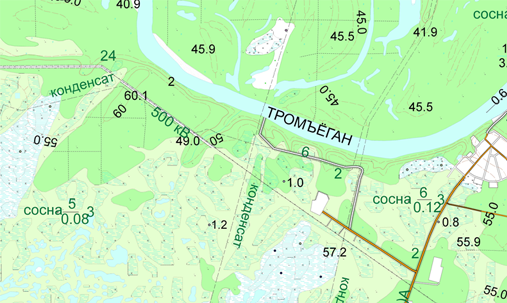
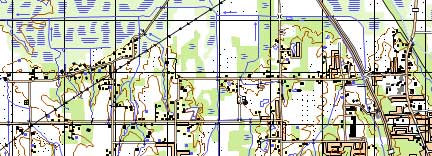
Figure 11. Example of a digital terrain model (DTM) at a scale of 1:25,000.
After the DEM formation was completed, the cameral control of the obtained model was carried out with elimination of detected errors and necessary revision.
Compilation of space map atlas of underground gas storages of the Russian Federation
Archival space images of high spatial resolution from 0.5 to 5 m were searched for in the area of mining allotments of the following Russian UGS facilities: Shchelkovskoye, Kaluga, Kasimovskoye, Uvyazovskoye, Sovkhoznoye, Nevskoye, Leningradskoye, Krasnodar, Kushchevskoye, Punginskoye, Karashurskoye.
The criteria for selecting digital information were as follows:
-
selection of the most recent by date and the best image quality;
-
presence of cloud cover - no more than 10%;
-
relevance of the survey - date of the survey no later than 2004;
-
angle of deviation from nadir - not more than 30°.
Available non-geopositioned cartographic materials on UGS facilities of the Russian Federation on paper or in electronic form (in *jpg, *cdr, *ppt, *doc formats) were digitized using MapEdit and ArcGIS software. The classes of objects stipulated by the Technical Assignment were digitized. Then on the high-resolution optical space images previously found in the archive some reference objects, present on the original cartographic materials, were recognized. After identification of several such reference objects on space images, georeferencing of source cartographic materials and vector layers digitized from them was performed. As a result, situational space maps were obtained, which represent a background substrate of high-resolution space images with vector layers of the objects stipulated by the Technical Assignment (wells, plumes, reservoirs, hydraulic fracturing and compressor stations, contours of the mining allotment).
At the next stage, the spatial location of each specific object on the space map was clarified by visual interpretation. The location of gas pipelines (plumes and collectors) could not always be determined by visual interpretation of space images and, in such cases, a comparative analysis of different available materials was performed. In some cases consultations of the Customer's specialists were required to clarify the location of specific objects.
The cartographic information systematized in this way was integrated into a geoinformation system. The resulting database of geopositioned spatial data became the basis for producing output cartographic products.
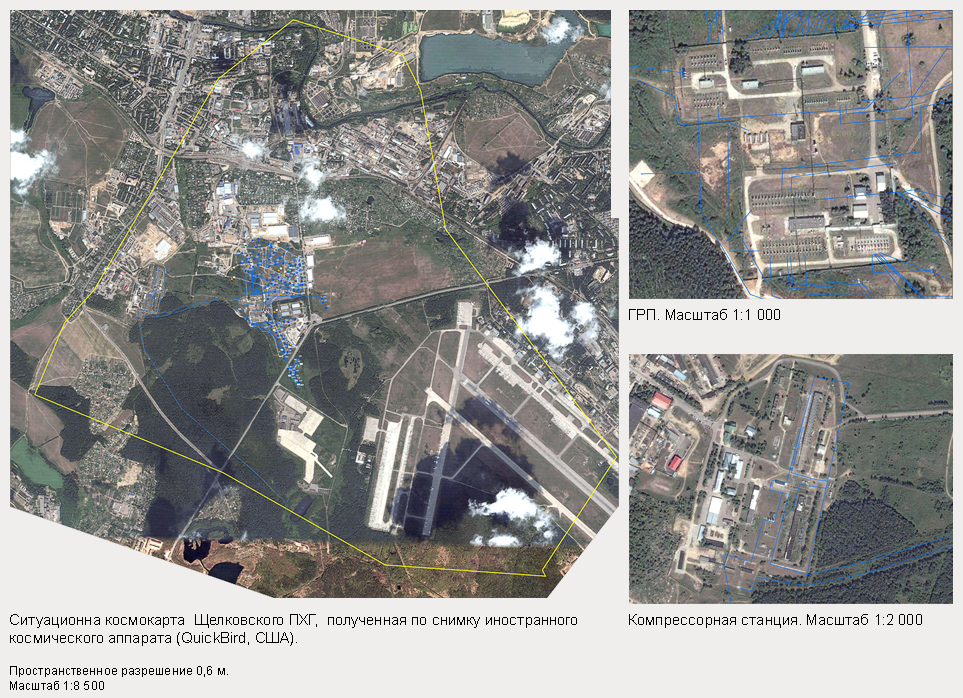
Figure 12. Situation space map of the Shchelkovsky UGSF
The resulting situation space maps of Russian UGS facilities were further analyzed for the presence of restrictions on their use in terms of state and commercial secrets. The authors' conclusions are as follows: the situation space maps of Russian UGS facilities were created on the basis of space images obtained from foreign spacecrafts: Quickbird and WorldView (USA), ALOS (Japan), SPOT (France), and, therefore, they are not secret, and, according to the authors, they do not represent commercial secrets. The final decision on the confidentiality and secrecy regimes of the Russian UGS situation space maps is made by the Customer (OAO Gazprom).
Concerning this project it should be noted that it is expedient to continue the work on creation of UGS space maps. Since the total number of UGS facilities in Russia is 28, while 11 have been worked out. The reason is the crisis of 2008-2009.
Ground-space monitoring of ecological and geodynamic processes
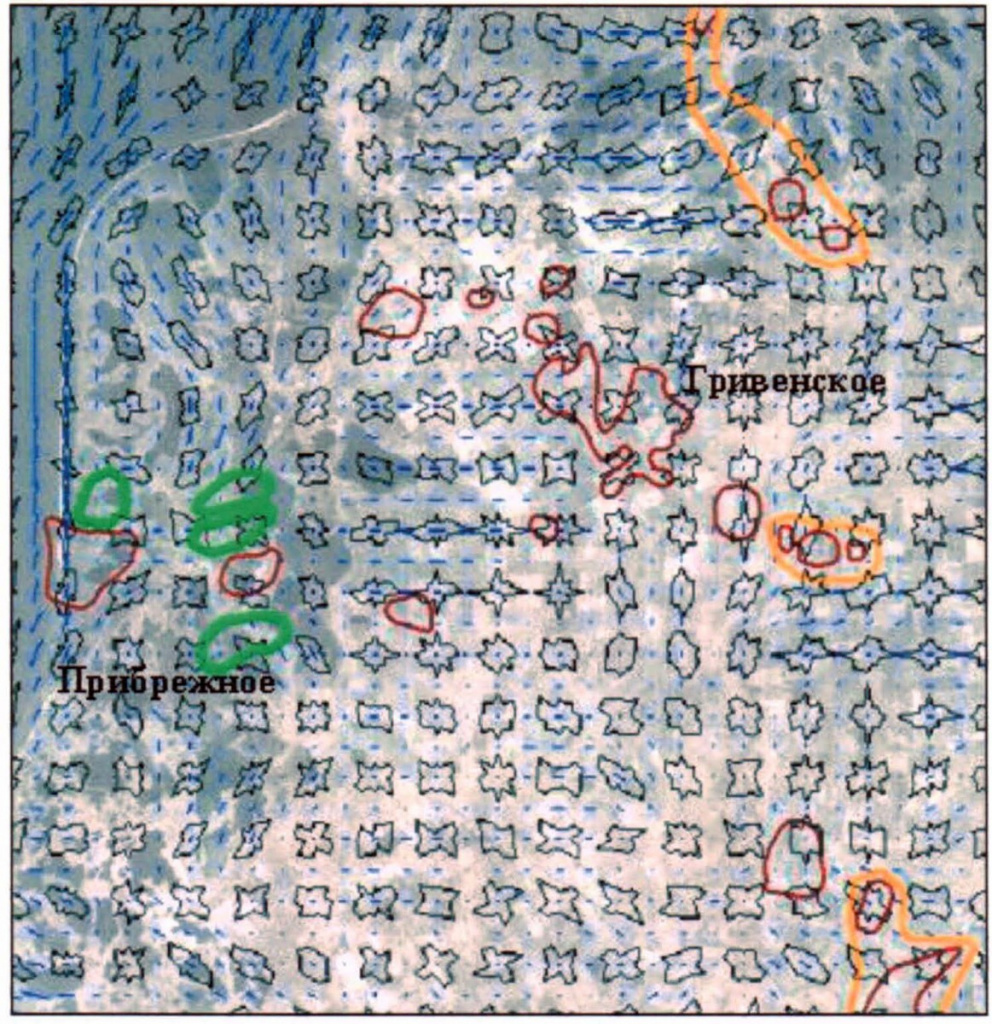
Figure 13. Rose-diagrams of lineament extents in the Pribrezhno-Novotitarovsky license area
The results of studies of spatial and temporal interrelations of natural and anthropogenic processes at oil and gas fields were used as a basis for the development of the method of lineament analysis of oilfield structures accident rate. This method is based on the results of structural interpretation of space images and structural-geomorphologic studies. Comparative assessment of histograms of accident rate distribution by elements of lineament-block structures in these fields allows to assume the existence of dependence of accident rate distribution dynamics on the lineament rank and its dimensionality.
The established regularities together with the developed technological scheme of geoinformation support determine new possibilities of rational design of monitoring systems for oil and gas complex objects.
Innoter has experience in system space-geodynamic computer modeling work on the example of the Pribrezhno-Novotitarovsky license area for surveying support of geological exploration works in 2003. The conclusions obtained in this work were used to build a three-dimensional model of the work area and to develop recommendations on the location of the reference surveying and geodetic network.
Planning of geodetic works at linear and long-distance facilities
Conclusion
You can order from us


Sat-Sun: Non-working days