Sat-Sun: Non-working days
Abstract
This article highlights the importance and necessity of flood monitoring to ensure public safety and preserve material assets. The article discusses the objectives of flood monitoring, methods of flood monitoring, particularly remote sensing methods. The advantages of using remote sensing data in flood monitoring are also described. The article provides examples of successful flood monitoring and outlines the prospects for its development.
Introduction
A flood surge is a sharp and short-term rise in river water levels and discharge caused by heavy rains, intense snowmelt, glacier melt, or sudden releases of water from reservoirs. The duration of a flood surge can range from fractions of an hour to several days. Unlike seasonal floods, it can occur at any time of the year and does not follow a regular pattern. Consecutive flood surges can combine to form a seasonal flood. A significant flood surge can result in flooding—a severe inundation of a large area by water exceeding annual levels, classified as a natural disaster. Flooding most commonly occurs due to river overflow during heavy rainfall or rapid snowmelt.
The occurrence of flood surges and flooding poses a serious threat to human and animal lives, as well as to regional infrastructure and economy. Therefore, flood monitoring is a critical tool for timely warning and minimizing damage.
Objectives of Flood Monitoring
The primary objective of flood monitoring is to collect and analyze data on water levels, river flow rates, precipitation, and other parameters that may contribute to the occurrence of floods.
Flood monitoring is also carried out to achieve the following objectives:
- Alerting the population about potential dangers and organizing evacuations in risk zones.
- Providing timely information about the current situation and flood development forecasts.
- Coordinating the efforts of rescue services and ensuring preparedness for emergency response.
- Minimizing flood damage by implementing appropriate measures to protect people and infrastructure.
- Collecting data to analyze and improve flood prevention and prediction systems.
Methods of Flood Monitoring
Several methods are used for flood monitoring to track, predict, and manage water-related hazards. Below are the main methods of monitoring:
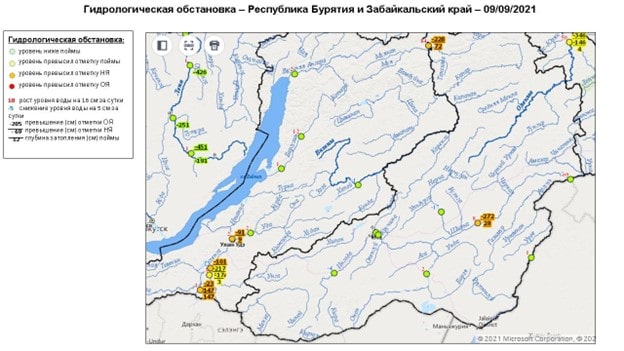
- Hydrological stations. These are installed near watercourses and other water bodies to measure water levels, discharge, and other parameters. Data from these stations help track real-time water level changes, their dynamics, and potential flood threats.
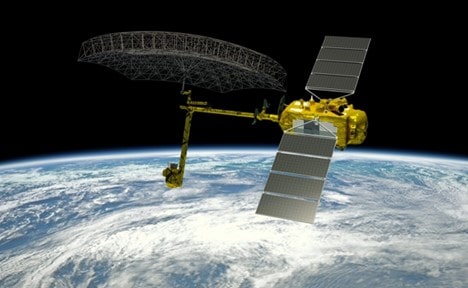
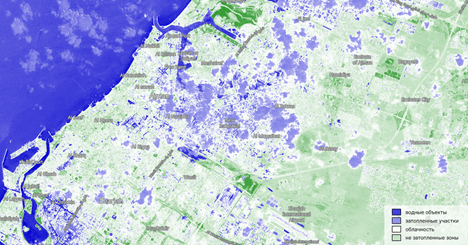
- Radar sensing. Used to observe and measure precipitation and create maps of sedimentation and floods. Modern radars provide highly accurate data on the location and intensity of precipitation, aiding precise flood forecasting.
- Optical remote sensing. Satellites and unmanned aerial vehicles (drones) are used to monitor and measure landscape changes, enabling rapid responses to flood threats.
- Meteorological stations. These stations measure atmospheric parameters such as pressure, temperature, humidity, and wind direction. Information from such stations aids in weather forecasting and identifying potential natural disasters.
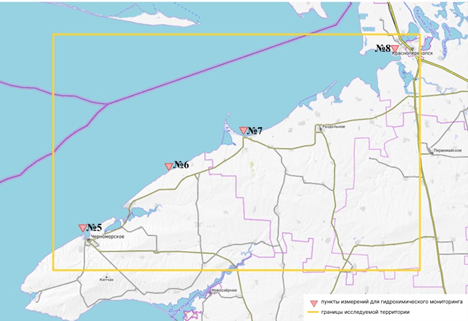
- Hydrochemical monitoring. This method includes analyzing the hydrochemical composition of water to assess contamination and its impact on ecosystems. Monitoring hydrochemical parameters is crucial for preventing ecological threats and protecting drinking water resources.
- Automated monitoring systems. Modern technologies enable the creation of automated monitoring systems that include sensors, satellite data, and software for data collection and analysis. These systems provide continuous monitoring and deliver real-time information for decision-making in flood situations.
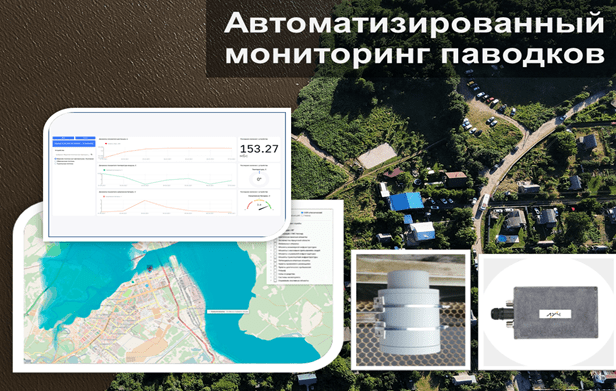
- Modeling and forecasting. Mathematical models are used to simulate potential floods based on hydrology, meteorology, and geography data. Modeling helps predict the development of situations and assess potential flood consequences.
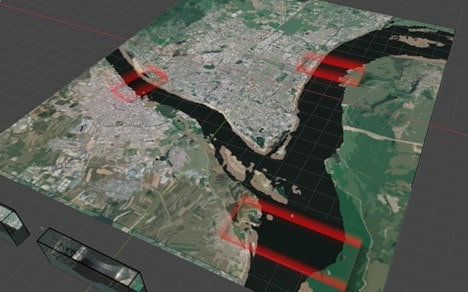
Effective integration of these methods enables the creation of comprehensive flood monitoring systems, ensuring prompt data analysis, forecasting dangerous situations, and taking necessary measures to protect the population and infrastructure.
Advantages of Using Remote Sensing Data in Flood Monitoring
The primary advantage of using remote sensing data in flood monitoring is the ability to observe vast areas, making monitoring more efficient and accurate.
Moreover, remote sensing data enables the rapid detection of the onset of floods, allowing for timely evacuation of residents and rescue operations.
Remote sensing provides the capability to predict and prevent emergencies. Analyzing data on floods allows for early identification of risks and facilitates measures such as reinforcing riverbanks and constructing protective structures.
The use of remote sensing data in flood monitoring reduces monitoring and forecasting costs and decreases response times to emergencies.

Fig. The elevation model processed from UAV imagery.
Requirements for Remote Sensing Materials (Images and DEMs)
- Digital Elevation Models (DEMs). High-resolution DEMs, such as SRTM DEM with a spatial resolution of 30 meters and vertical accuracy of 16 meters, are suitable for real-time flood monitoring. The higher the spatial resolution of the models, the more accurate the resulting maps.
To assess the flooded area with greater precision, data obtained through aerial or radar surveys is often used. These datasets offer higher spatial resolutions (up to several centimeters) and allow for more accurate estimation of water volumes in flooded areas. - Satellite imagery with medium and low spatial resolution. Optical sensors aboard satellites like Landsat-7, Landsat-8, or Sentinel-2 provide systematic updates and capture data across multiple spectral bands, ranging from visible to shortwave infrared (SWIR). For floodplain imaging, using data from various spectral bands is recommended.
- High- and very-high-resolution satellite imagery. To delineate shorelines and inundation zones with high accuracy, imagery with spatial resolution of 0.5 meters or higher is required, such as those from WorldView (USA), Jilin (China), or Innoter (Russia) satellites.
- Data with low cloud coverage (below 5%). Cloud permeability is critical in flood monitoring, as floods often occur during prolonged rainfall. In such cases, data from SAR satellites like Sentinel-1, or for more precise mapping, data from TerrasSAR-X/TanDEM-X/PAZ (France/Germany/Spain) or similar systems, is recommended. Studies show that the selection of appropriate radar wave polarization can optimize flood area detection. Typically, HH polarization (horizontal) is more effective for identifying flooded areas compared to HV or VV.
- Drone data for higher accuracy. Drones provide unparalleled responsiveness and superior resolution due to their mobility, rapid deployment, high-quality sensors, and low-altitude operation. Data from drones can be used to create maps and DEMs with the highest spatial resolution (down to centimeters), enabling real-time and highly accurate flood monitoring. Comprehensive analysis of flood development and impact requires extensive spatial information, including regional data, specific flood zones, and vulnerable objects within those zones.
Software Used
ArcGIS is a family of software for client, server, and online geographic information systems (GIS), developed and supported by Esri. Among the available software products, the following hydrological packages can be highlighted:
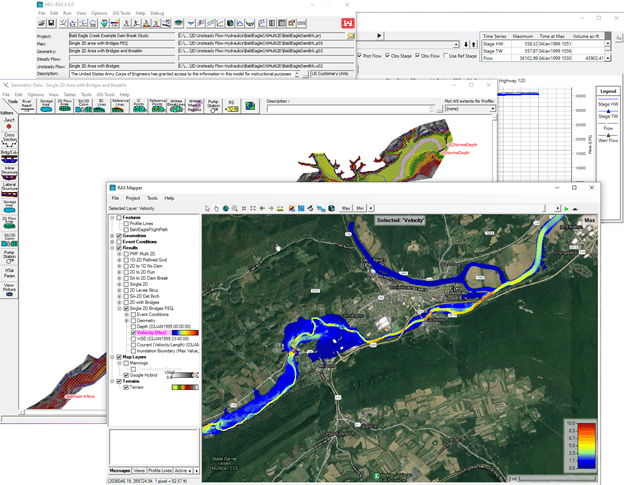
- HEC-RAS: developed for ArcGIS Desktop (8.3 - 10.1). The HEC-GeoRAS add-on allows for the creation of a set of map layers and tables with a specified structure. HEC-RAS implements a one-dimensional hydrodynamic model, and in the beta version, a two-dimensional model and a combined one- and two-dimensional model are available. The drawback is that "two-dimensional" results are saved without support for raster data models, so before displaying the results in ArcGIS, the HDF datasets need to be converted to a text file.
- MIKE Zero: allows for the creation of one-dimensional, two-dimensional, and combined models. Using the MIKE 11 GIS module for ArcMap (10.1), pre- and post-processing of flood data can be performed for a one-dimensional model; in other cases, results are saved as text files with coordinates.
- SMS: developed by the engineering company Aquaveo, allowing direct reading of shapefiles and raster layers in popular formats, AutoCAD files, and exporting results in AutoCAD formats.
Fig. 7. High-level model created with Aquaveo's SMS This development is convenient for projects involving watershed and stream delineation based on raster data. Two new tools in the Surface-water Modeling System (SMS) toolset allow for quick and easy determination of watershed areas. The Converages folder on the toolbar contains two tools - Streams from Rasters and Watershed from Rasters. The first tool, Streams from Raster, evaluates elevation data from a raster, extracts flow direction, creates connected arcs, and places them in a separate coverage. The Streams from Rasters tool shows all flow paths based on elevation in the selected raster. This feature helps trace the most likely water flow paths until it reaches the lowest possible point for that path.
The Watershed from Rasters tool creates a watershed domain. This tool combines several processes working in a specific order in the background while the tool operates. This tool speeds up model creation.
- XPSWMM: developed by XP Solutions. Data preparation and management principles are consistent with those in ArcGIS, making XPSWMM relatively simple for GIS specialists to use. Shapefiles are imported directly, AutoCAD files, raster images in ASCII and GRID formats, and shapefiles are also exported directly. Installation requires prior registration on the website.
- ISIS: developed by CH2M HILL. Implements one-dimensional and two-dimensional models and supports the TUFLOW two-dimensional model. It supports importing shapefiles, raster images, ASCII files, dfx files, and exporting data to kml, mif/mid files, and geo-images.
- Flood Simulation – a new tool introduced in ArcGIS Pro 3.3. It is used for flood modeling, including simulating water movement and accumulation in various environments to predict flood behavior and its consequences. In the latest version of ArcGIS Pro, users can easily integrate digital elevation models (DEM), river data, waterbody data, and even climatic parameters to create multi-scenario simulations. By visualizing potential flood scenarios, flood modeling helps identify vulnerable areas, assess risks, and develop mitigation strategies and emergency response plans.
For new ArcGIS Pro users, the software offers a user-friendly interface with step-by-step instructions, simplifying simulation setup without requiring deep hydrology knowledge. Professionals can use more advanced features, such as adjusting modeling parameters (e.g., flow speed, water volume), analyzing temporal changes, and considering climate changes. This makes flood simulation in ArcGIS Pro a versatile tool for both short-term forecasting and long-term flood risk planning and management.
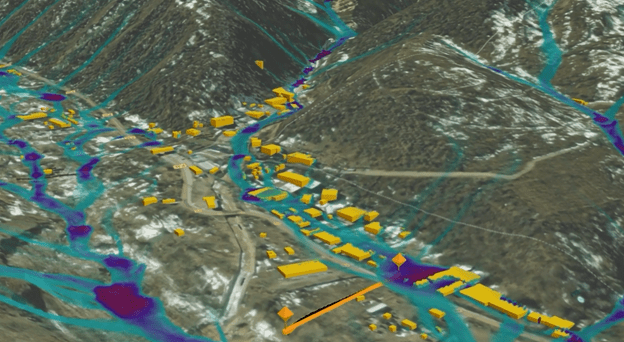
Experience of GEO Innoter in a Project for Flood and Inundation Monitoring
Let us consider the process of monitoring floods and inundations through the example of a project by the company "GEO Innoter." The purpose of the work was to determine the boundaries of flood and inundation zones in the Chelyabinsk region and provide data on such zones to implement measures for mitigating the adverse effects of water and eliminating their consequences. The project site included Lake Smolino and the territory adjacent to Lake Smolino within the boundaries of the Chelyabinsk city district and the Kopeysk city district.
- Data Collection:
- Hydrological Study of Water Bodies
This section describes the relief around the lake, the general slope of the terrain, the hydrographic network within the watershed, the lake's relief, its area, and the description of the lakebed.
- Data on Water Resource Usage
- Data on flooding and inundation of the area around Lake Smolino in the Chelyabinsk and Kopeysk districts during 2000–2017.
The data is presented in a summary table. An example table:
|
No. |
Water Body |
Date of Flooding/Inundation |
Address of Flood/Inundation Location |
Area of Flood/Inundation Zone (ha) |
Number of Houses Affected |
Population Affected |
Cause of Flood/Inundation |
|
1 |
Lake Smolino |
April-May 2014–2015 |
CHPZ Settlement: Fedi Gorelova St., 7, 9, 11, 13, 15; … |
1.8 |
24 |
80 |
Rise in lake water levels due to heavy rainfall |
|
2 |
Beregovoi Settlement: 1st Kaluzhskaya St. … |
2 |
4 |
16 |
- Survey data on flood-prone zones (if available), along with hydrogeological and hydrological studies.
- Description of the area based on reconnaissance surveys and photographs.
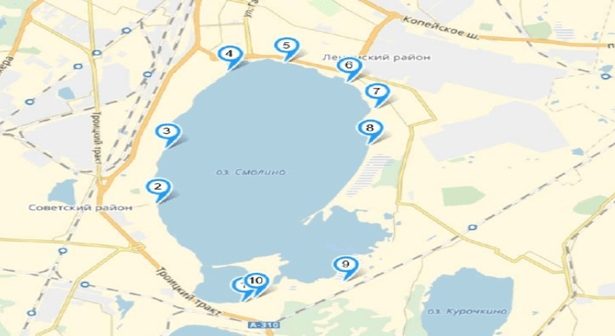
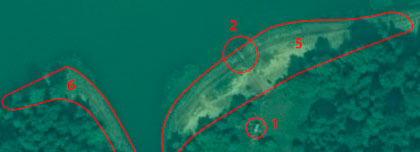
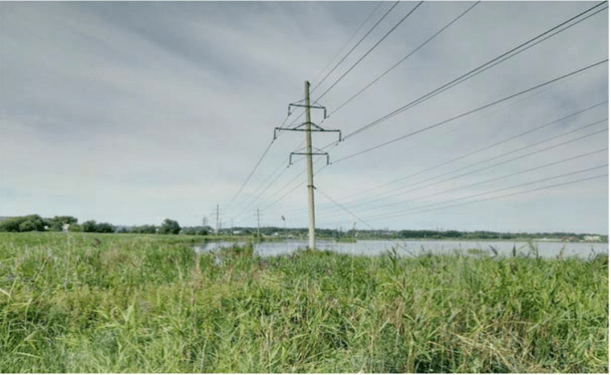
Photographs were taken to show the situation from numbered points. An example photograph:
- Situational plan of areas adjacent to Lake Smolino, showing the boundaries of flood and inundation zones.
It was found that the flood zone boundaries for areas adjacent to Lake Smolino were established for water levels with a probability of P=1%.
The 1% probability level was marked on the plan considering the terrain. The flood zone boundary for the area adjacent to Lake Smolino (including Lake Isakovo) was plotted on the situational plan.
The inundation zone boundary for the area adjacent to Lake Smolino (including Lake Isakovo) was plotted on the situational plan shown in the figure below:
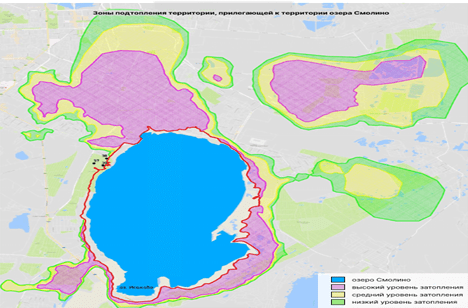
- Water level of Lake Smolino as of 2017.
The water level in Lake Smolino, in the Baltic height system, was 217.04 m.
- Calculation of Lake Smolino water level during 1% probability floods and its water balance.
The water balance of Lake Smolino was calculated using a tabular method based on annual intervals, depending on volume and area from levels W=f(H) and F=f(H).
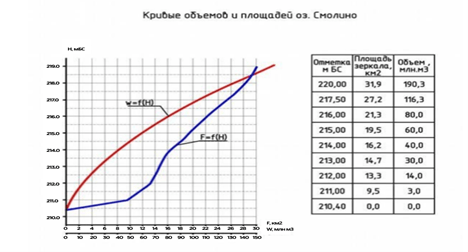
The water balance calculations for Lake Smolino are presented in the table below:
- Brief description of research methods and a list of instruments used, along with their measurement errors (instruments for hydrographic engineering surveys).
As a result of the survey, specific features of the morphometric characteristics of Lakes Smolino and Isakovo were identified. The result of the hydrographic engineering survey was the determination of the water level as of July 13, 2017. The water level was determined at the state observation post—Lake Smolino.
The instrument used for hydrographic engineering surveys was a Sokkia compensator level, C320. Measurement errors: actual angle i=0"; RMS of height differences over 1 km double run does not exceed 2 mm; rangefinder coefficient Kd=100.2; compensator range ±15'.
Examples of Successful Flood and Inundation Monitoring Worldwide
Lake Kerkini, located in Northern Greece, is an artificial reservoir and a region of rich biodiversity. The lake spans an area of 70–76 km2 with a basin volume of 11,600 km2. Through monitoring flood levels and studying associated natural patterns, the ecosystem's dynamics were preserved, and a balance was achieved between the seasonal nesting and feeding needs of its fauna and the irrigation needs of the surrounding Serres Plain.
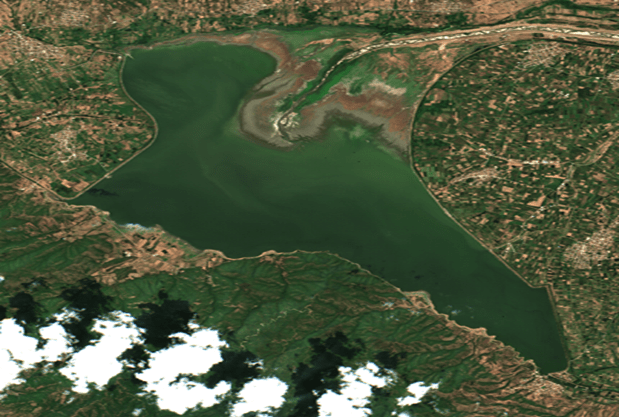
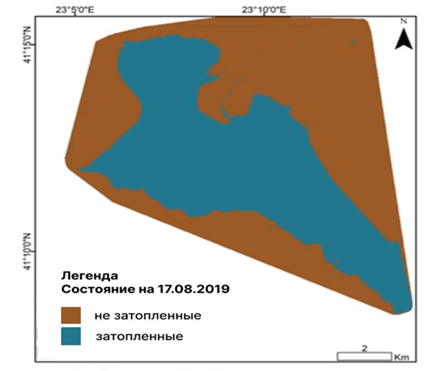
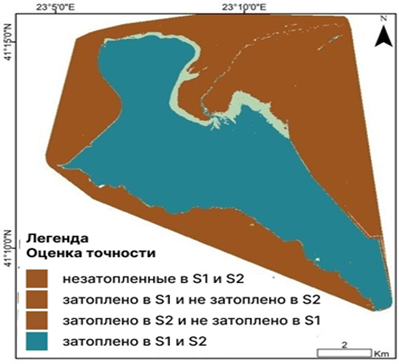
Focus was placed on multi-temporal monitoring of flooded areas from June 2017 to August 2019. Ground-truth measurements coinciding with available Copernicus Sentinel-2 data were selected for verification. Verification layers were created based on not only ground-truth data but also bathymetric maps, expert knowledge of the area, and additional information from the classification layer (SCL) of Copernicus Sentinel-2 L2A products. Copernicus Sentinel-1 data from the same period was also used, and dates close to those of Sentinel-2 were selected for the analysis. This was done to cross-validate flood maps created by Sentinel-1 with those created by Sentinel-2 for the same dates, as this approach has been previously tested to achieve high-quality results.
Using the capabilities of Copernicus Sentinel-1 and Sentinel-2, automated services for flood mapping were developed. The data from both satellites was integrated using machine learning techniques.
The flood maps presented below, created from multispectral data, demonstrated high accuracy in mapping flooded areas, with stable results throughout the year. This highlights the methods' effectiveness and applicability to inland water bodies and wetlands.
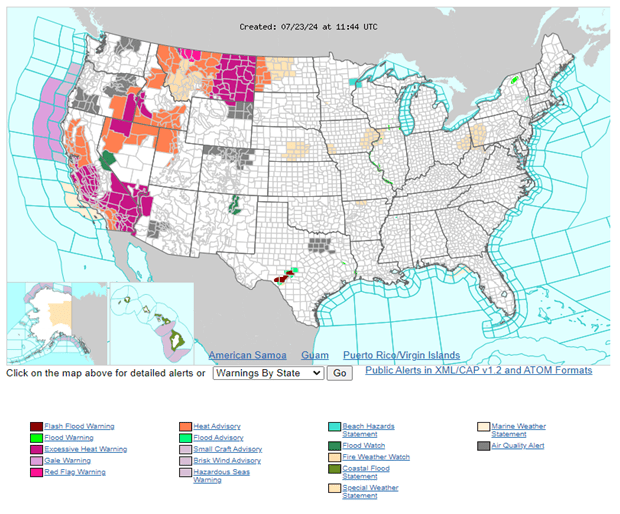
The U.S. National Weather Service (NWS) uses satellite data and hydrological modeling systems for flood monitoring. A combination of radar data, optical satellite imagery, and ground observations enables precise predictions of river water levels and potential floods. As a result, this system has significantly reduced emergency response times and improved forecast accuracy for the population.
The Sentinel Earth Observation Program, initiated by the European Space Agency, provides regular monitoring of changes on Earth's surface. Sentinel-1 (radar satellites) and Sentinel-2 (optical satellites) data is used to track water levels and vegetation conditions. These data help regional authorities manage flood risks and understand water body dynamics.
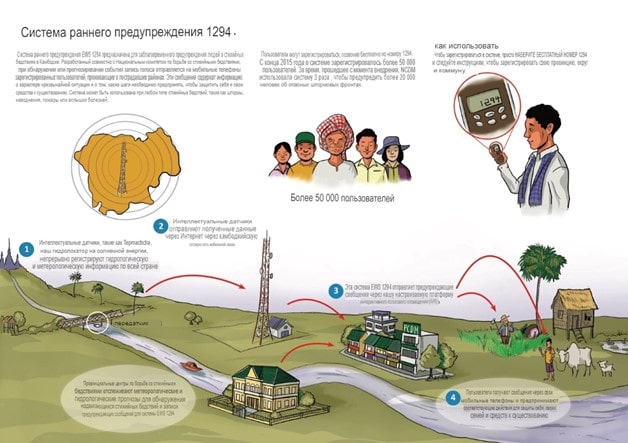
The "Flood Early Warning System" in Uttarakhand, India, includes methods that use satellite imagery and meteorological data to assess rainfall levels and predict floods. This system has improved the speed and accuracy of flood warnings, helping save lives and reduce damage.
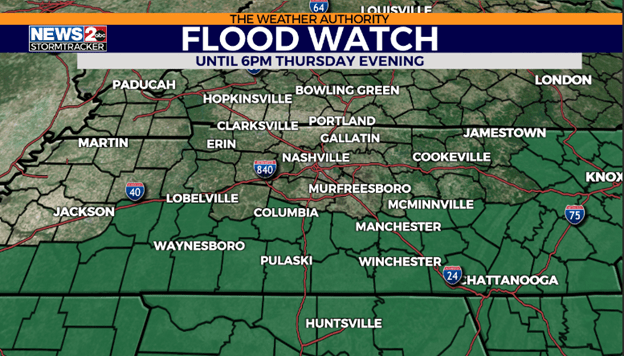
The "Flood Watch" program by the Bureau of Meteorology in Australia integrates data from satellites, meteorological stations, and hydrometric posts. This system provides flood warnings and ensures accurate modeling of water mass distribution.
Flood Risk Monitoring Platform in Baden-Württemberg, Germany, uses GIS to create flood risk maps and analyze historical data. This leads to effective water resource management and preparation for potential floods.
The flood monitoring program based on RADARSAT satellite data provides information on ice jams and high river levels, aiding in flood predictions. This program has significantly enhanced the country's ability to respond to floods and minimize damage.
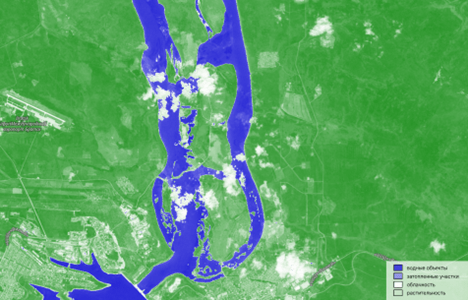
In 2013, severe floods on the Amur River led to the development of a more reliable monitoring and forecasting system. This system integrates state monitoring data with satellite information and forecasts from international meteorological organizations. It has significantly improved forecast accuracy and emergency response.
The Russian Space Agency uses satellites to monitor natural disasters, including floods and inundations. Specialized satellites like "Kanopus-V" and "Resurs-P" provide high-quality imagery for assessing current situations and forecasting flood impacts.
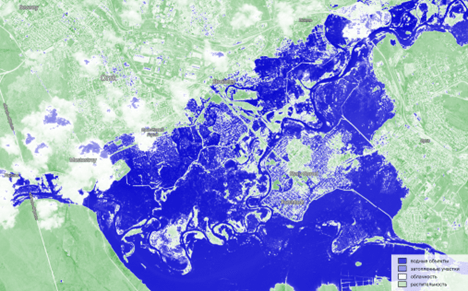
The "Electronic Water Passport" project launched in several Russian regions aims to create detailed maps of water body inventories and their flood potential. Data from reconnaissance drones and other sources allow for more efficient flood prevention and population safety planning.
The Siberian Federal District's Flood Forecasting System for major rivers uses data from hydrometeorological stations, satellite imagery, and meteorological models. It helps identify flood threats on rivers like the Ob and Yenisei in advance and take measures to prevent their devastating impacts.
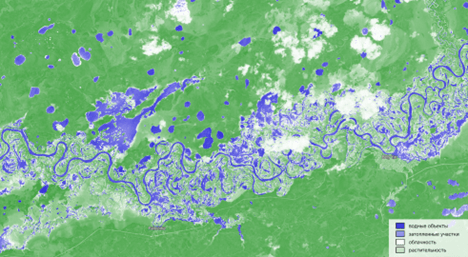
The Russian Academy of Sciences' Space Research Institute actively develops methods for monitoring and analyzing satellite imagery data to assess flood risks and impacts. These projects enable timely data collection on water body dynamics and forecasting flood scenarios.
Early Warning Systems in China are key tools for emergency preparedness and minimizing potential flood damage. China has an extensive network of meteorological stations conducting continuous weather and atmospheric monitoring. Hydrometric stations installed in rivers and reservoirs help detect potential flood threats.
These examples demonstrate how innovative technologies and data integration help countries effectively manage risks associated with floods and inundations. Global practices confirm that investing in disaster prediction and preparedness is 15 times more cost-effective than addressing damages after they occur.
Perspectives on the Development of Flood and Inundation Monitoring
Flood and inundation monitoring is critically important for protecting populations and infrastructure. The future of this field involves the use of advanced technologies, interdisciplinary approaches, and international cooperation. Below are some key directions and perspectives:
- Use of Satellite Data:
- Modern satellites can provide high-resolution real-time data, enabling more precise flood forecasting and monitoring;
- Combining data from various satellite systems (e.g., ESA's Sentinel and NASA's Landsat) allows for a more comprehensive and accurate picture.
- Automated Sensing Systems and Sensors:
- Deploying sensor networks in rivers, reservoirs, and drainage systems for continuous data collection on water levels, rainfall, and other parameters;
- Using the Internet of Things (IoT) to integrate sensor data and create early warning systems.
- Implementation of Artificial Intelligence and Machine Learning:
- Machine learning algorithms can analyze large datasets for accurate flood prediction;
- Artificial intelligence can enhance hydrological modeling and facilitate scenario planning.
- Big Data and Analytics:
- Utilizing big data to analyze historical flood data, providing better insights into patterns and predicting future events;
- Analyzing social media and other data sources to gain real-time information on ongoing situations.
- Mobile Applications and Crowdsourcing:
- Developing mobile apps to provide the public with up-to-date information about flood and inundation risks while enabling users to report situations in real-time;
- Crowdsourcing data from local residents and volunteers can complement official data sources. Combining official data with crowdsourced information is a powerful tool for improving data quality, providing more comprehensive coverage, and engaging communities in the data collection and analysis process.
- International Cooperation and Data Sharing:
- Establishing international consortia for sharing data and technologies between countries;
- Cooperation and coordination between countries within the same river basin.
- Development of Local Monitoring and Prediction Systems:
- Investing in the creation of local monitoring systems in vulnerable regions;
- Training local specialists and raising public awareness about precautionary measures and actions during floods.
- Integration with Other Environmental Monitoring Systems:
- Incorporating flood and inundation monitoring into broader ecosystems for natural disaster monitoring (e.g., mudflows, landslides, hurricanes);
- A comprehensive approach allows for better consideration of interconnected natural phenomena.
Together, these approaches make flood and inundation monitoring systems more accurate, efficient, and proactive, significantly reducing risks to people and infrastructure.
Conclusion
Flood and inundation monitoring plays a crucial role in mitigating damage and protecting populations from natural disasters. Advances in technology and improved monitoring systems enhance the effectiveness of flood warning and response. Effective monitoring not only predicts the timing and intensity of floods and inundations but also provides opportunities for timely warnings, evacuation of populations, and preventive measures to protect infrastructure. Modern technologies, such as the Internet of Things (IoT) and distributed observation systems, expand monitoring capabilities and improve accuracy.
To further enhance monitoring systems, it is essential to continue integrating diverse data sources, refining predictive models, and fostering international collaboration. The combined efforts of scientists, governments, and the public are key to improving preparedness and resilience against floods and inundations.


