of geospatial solutions
Sat-Sun: Non-working days
Oil and gas are among the most important components of the global energy sector. They meet more than a third of humanity's energy needs. Russia is among the top five countries in terms of hydrocarbon reserves, and the oil and gas industry is one of the key sectors in our country's economy. Currently, more than 2,500 oil and gas fields are being developed in Russia, most of which are in hard-to-reach regions: Western and Eastern Siberia, the offshore shelf of Sakhalin, the Barents Sea, and the Kara Sea.
Oil and gas are transported through pipelines, over 1 million kilometers of which are operated in our country—trunk, field, and distribution pipelines. Only on trunk pipelines do more than 55 accidents occur annually. At enterprises engaged in the extraction, storage, transportation, distribution, and processing of oil, gas, and petroleum products, leaks and spills of raw materials occur due to pipeline breaks and other accidents, leading to environmental pollution. The chemicals in oil and petroleum products alter the composition of environmental objects, transforming natural complexes into toxic forms. Remote sensing data is actively used to monitor the environmental condition of land and marine areas where oil and gas industry facilities are located. They allow not only to detect oil pollution but also to prevent it.
Aside from obvious black spots on the ground, the following physical effects, manifested in changes in the electromagnetic radiation of optical data, help to detect oil pollution:
- In areas where pipeline breaks and contaminating components have occurred, thermal contrasts arise, which are recorded by the infrared and thermal spectra of radiation.
- Due to differences in spectral brightness coefficients, contrasts appear between abnormal pollution areas and the general background of the image. Modern multispectral satellite images allow recording these contrasts. The higher the detail of the shooting, the smaller the pollution that can be detected.
- Oil pollution on grass and bare soil changes the brightness characteristics in different spectral ranges. In these cases, the vegetation indices NDVI and NCHVI, which show the state of the vegetation cover, change.
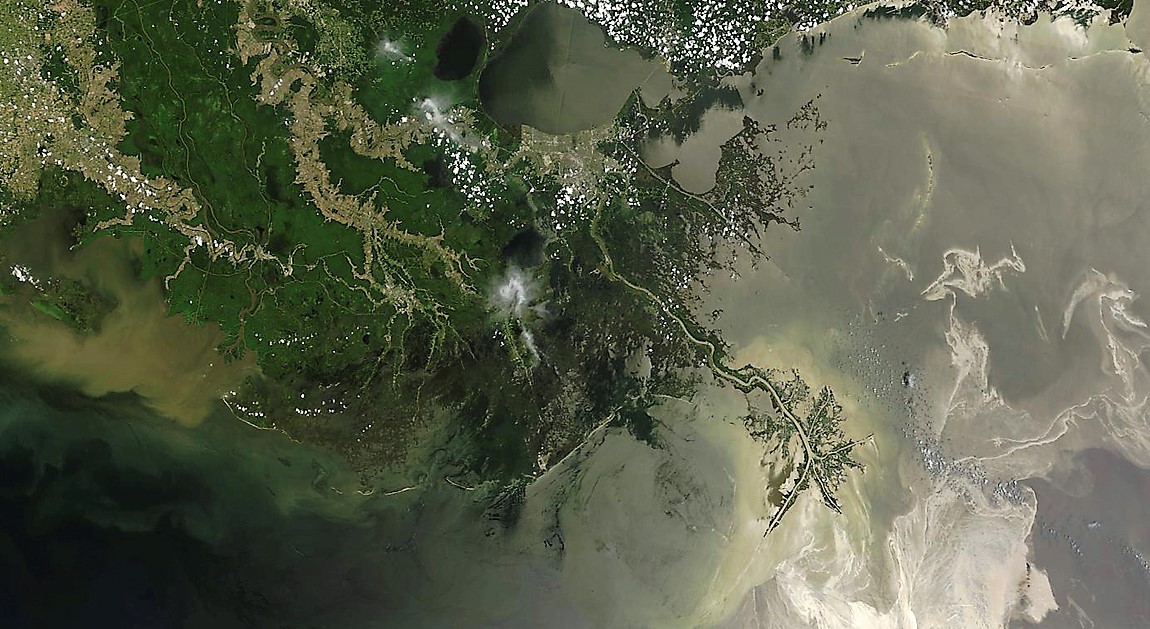
The Samotlor oil field, the largest in Russia and the 7th largest in the world, is located in the Khanty-Mansi Autonomous Okrug, near Nizhnevartovsk, in the area of Lake Samotlor. It began to be developed in the 1960s, and over more than 50 years of operation, more than 16,700 wells have been drilled and over 2.3 billion tons of oil have been extracted. It is hard to even imagine how much of the extracted oil has spilled onto the ground and worsened the environmental situation in the region.
Let's analyze the oil pollution of the Samotlor field using infrared and thermal range processing of a satellite image from Landsat-7 in the ScanEx Image Processor software.

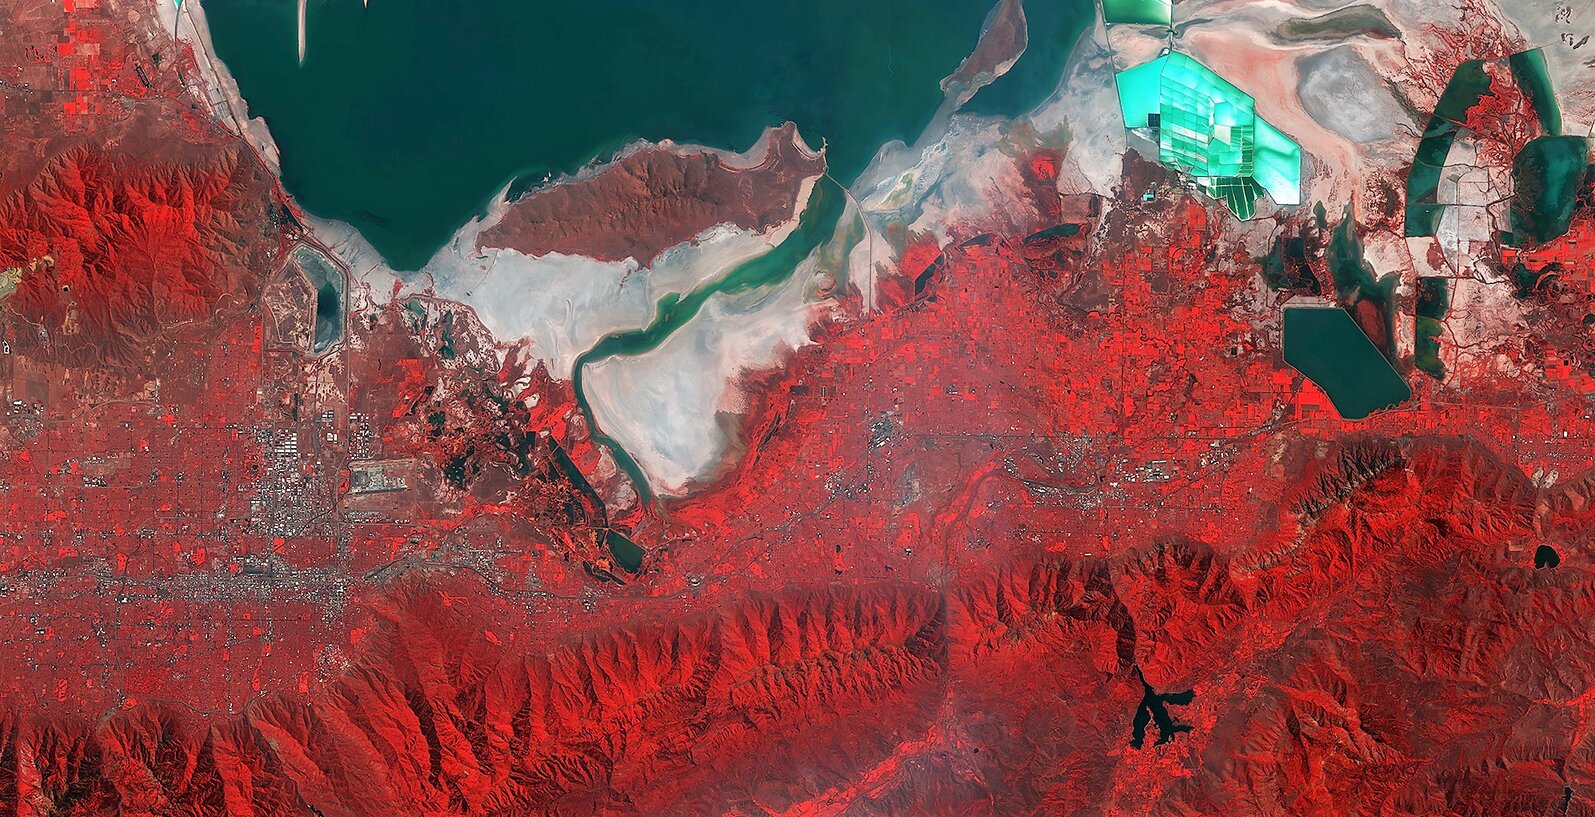
Load the multispectral Landsat-7 image into the project and display the thermal and infrared channels and, as the most contrasting, the blue channel (channels 7-4-2). The image will be colored according to the corresponding channels.

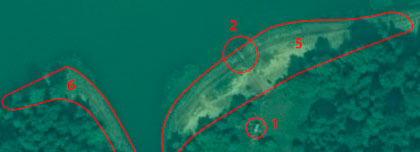
As previously mentioned, oil pollution in the infrared and thermal ranges strongly contrasts with the general background of the satellite image. Green, red, and purple colors stand out prominently in the image. Considering the nature of the area and the location of the green color in the image, it most likely corresponds to floodplain vegetation, which can be verified by a histogram. Zooming in on the extent of the purple color shows that it corresponds to industrial and other anthropogenic objects, such as urban development. Only the red color remains, and by analyzing the histogram of the red "spots," it can be seen that the highest activity is observed in the infrared and thermal ranges, which corresponds to the reflection of oil pollution.
Next, using the "magic wand" tool, capture the red pixels of the image. The captured areas will be recorded in a pre-created vector layer.

Thus, we created templates for further raster classification. We need to extract only the oil pollution spots, so we will use binary classification, which will separate the red pixels from the entire image and create a new raster layer.


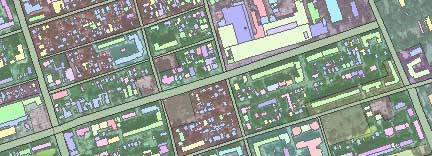
For further analysis, vectorize the obtained result and set the contrast display. Vectorization will allow removing small artifacts that are not related to oil pollution and were mistakenly classified.

Conclusion: Modern satellite imagery allows for quick, economical, and remote monitoring of oil pollution. The higher the spatial resolution of satellite images, the smaller the area of oil pollution that can be detected. This method saves a huge amount of money on field trips.
You can order from us


Sat-Sun: Non-working days