of geospatial solutions
Sat-Sun: Non-working days
Water Indices as a Monitoring Tool
In today's world, remote sensing data is often used for environmental monitoring, studying the condition of forests, fields, and agriculture as a whole. In addition to this monitoring using vegetation indices, there is a growing demand for monitoring flooded areas, detecting the level of combustible materials in fire-prone zones, calculating the snow cover's water content, moisturizing the vegetation cover, and many other tasks.
Various water indices are used for these purposes, calculated based on Earth remote sensing data. In this article, we will explore the most popular ones. Sentinel-2B satellite images were used to study the calculated indices used to identify water bodies on the Earth's surface.
How the First Water Index Emerged
In remote sensing, the Normalized Difference Vegetation Index (NDVI) has been used for many years. To determine the condition of all vegetation, values in the absorption and reflection of red and infrared light are compared, resulting in the NDVI index. However, the main drawback of this index is that the red channel reflection coefficient is too sensitive to atmospheric changes. To address this issue, the first water index (NDWI) was created, utilizing the shortwave infrared channel. The SWIR channel penetrates almost 80% of the atmosphere and is used for monitoring forest fires, searching for valuable minerals, and more. Water can absorb near-infrared waves, so by using NIR and SWIR channels in calculations, we can outline water bodies and moist soils.

Normalized Difference Water Index (NDWI)
Normalized Difference Water Index (NDWI) is an index used to detect water bodies in satellite or aerospace images. NDWI is based on the difference in light absorption in the near-infrared (NIR) and visible green ranges of the electromagnetic spectrum.
This index determines the amount of moisture in the vegetation interacting with incoming sunlight.
How NDWI is Calculated
Calculated by the formula:
NDWI = (NIR – SWIR2)/ (NIR + SWIR2)
Used for:
- Monitoring changes in water content in leaves (and more);
- Analysis of the susceptibility of the studied area to fires;
- Modeling plant fertility;
- Detection of surface waters in swampy areas;
- Measuring the extent of coverage by surface waters;
The values of this index range from -1 to 1. The normal range for green vegetation is from -0.1 to 0.4. It is considered that water bodies take values from 0.2 to 1, while objects without moisture take values less than 0. The main advantage of using NDWI is its ability to identify water bodies in satellite images. The drawback of using this index is its high sensitivity to structures, which can lead to significant errors in NDWI calculation.
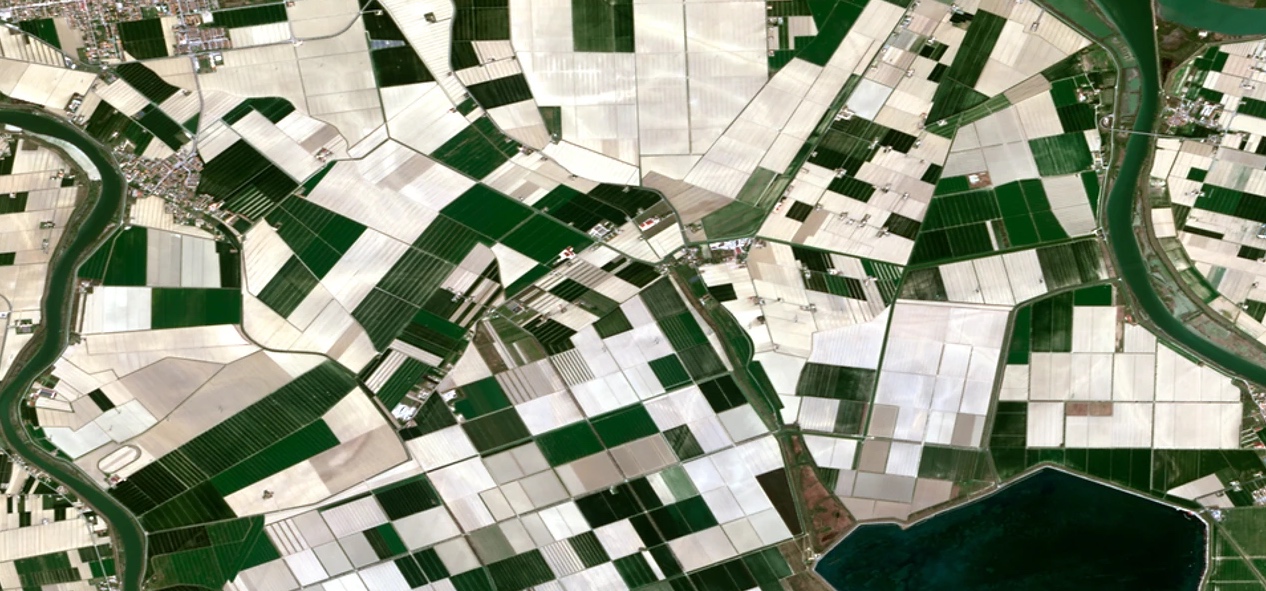
Example of Using NDWI


This raster image allows us to determine which fields have been harvested, which ones have been sown with various crops, and how moist they are. According to the NDWI scale, the lower the index value, the more likely there is no moisture in that area, and vice versa.
Water Ratio Index (WRI)
This index can be used to determine the amount of moisture in vegetation. The calculation technique of this index is based on the ratio between the full spectral index of two visible light ranges (green and red) and shortwave and mid-wave infrared ranges.
How WRI is Calculated
Calculated by the formula:
WRI= (GREEN + RED) / (NIR + SWIR2)
Used for:
- Studying ecosystem physiology
- Detecting water bodies in the studied area
The index values range from 0 to 3. Usually, values of 1 and above represent water bodies or objects containing moisture.
Example of Using WRI

Knowing that objects containing moisture take values from 1 when calculating WRI, it was decided to classify for a more accurate representation of the picture according to the following values:
- from 0 to 1 – no water on the surface;
- from 1 to 2.5 – plants containing moisture;
- from 2.5 to 3.8 (maximum index value in the area) – water bodies.


The classified image only shows us the clear boundaries of water bodies.


High values of the water index show us areas with moist vegetation and water bodies. It can be seen that in the central part of the image, there are bright objects, which are presumably fields that have been moistened. It is also possible to discern the river flowing from south to northeast and lakes in the southeast and west of the image. Based on the presented scale, we can make conclusions about which fields are abundantly moistened, fields where moisture is absent or present. Thus, it can be concluded that for a clear analysis of the image, a mixed analysis method is necessary (visual to determine, in our case, moistened fields, and classification based on certain values to determine water bodies in the image).
Modified Normalized Difference Water Index (MNDWI)
Modified Normalized Difference Water Index (MNDWI) is a variant of the NDWI index used to detect water bodies in satellite or aerial images.
This index is more effective compared to the NDWI index as it reduces characteristics of built-up areas that often correlate with open water in other indices. It is calculated using the green and SWIR channels.
How MNDWI is Calculated
It is calculated using the formula:
MNDWI = (Green – SWIR2) / (Green + SWIR2)
Used for the same purposes as Normalized Difference Water Index (NDWI).
The values of this index range from -1 to 1. Water has values greater than 0.
Example of MNDWI Usage


When comparing the obtained rasters for NDWI and MNDWI indices, it can be noticed that the latter is less contrasting. It is easier for the operator to distinguish the boundaries of certain objects, such as fields and water bodies. MNDWI is best used in heavily built-up areas, as using the visible green channel instead of the NIR range allows for better separation of buildings and water bodies.
MNDWI is widely used in hydrological research and remote sensing for detecting water bodies, monitoring changes in water levels, identifying flood zones, assessing the area of water bodies, and other tasks related to water resource analysis. It is a valuable tool for studying hydrological processes and ecosystems related to water.
Normalized Difference Snow Index (NDSI)
Normalized Difference Snow Index (NDSI) is an index used to determine the presence of snow cover in satellite or aerial images. NDSI is based on the difference in light absorption in the near-infrared (NIR) and visible green (Green) ranges of the electromagnetic spectrum.
This index is derived from the Earth's surface reflectance coefficient. It represents the normalized difference between the spectral bands of green (G) and shortwave infrared (SWIR). Generally, snow is challenging to distinguish in spectral images from clouds since these objects are very similar in brightness. However, at a certain wavelength, snow absorbs sunlight and appears slightly darker on images compared to clouds.
How NDSI is Calculated
It is calculated using the formula:
NDSI = (Green – SWIR1) / (Green + SWIR1)
Used for:
- Identifying snow from vegetation, soil, and end elements of lithology
- Delineating areas covered by snow
The values of this index range from -1 to 1. The likelihood of snow presence is proportional to how close the NDSI pixel value is to 1.
Example of NDSI Usage


From this image fragment, it is easy to determine that this area is almost entirely covered with snow. A high NDSI index value corresponds to the blue color on the presented raster.
NDSI is widely used in hydrological research, climatology, geographic information systems (GIS), and remote sensing for snow cover detection, monitoring changes in snow cover, estimating snow-covered area, and other tasks related to snow condition analysis. This index helps scientists and researchers obtain information about snow and its impact on hydrological processes, climate models, and other environmental aspects.
Normalized Difference Thermal Index (NDTI)
The Normalized Difference Thermal Index (NDTI) characterizes the reduction in water transparency due to the presence of inorganic and organic impurities or the development of plankton in a water body.
How NDTI is Calculated
It is calculated using the formula:
NDTI = (RED- GREEN)/(RED+GREEN)
Since only the visible range of the spectrum is used in the calculation of this index, data from satellites such as WorldView 3 with high spatial resolution can be used if required by the technical task.
Used for:
- Detecting water turbidity
- Forecasting drought, as the index provides a more global indicator — it is more sensitive to changes in moisture content in plants
The values of this index range from -1 to 1. Water turbidity takes values from 0.4 to 1.
Example of NDTI Usage 1.


Comparing the color of the image with the scale of values of this index, it can be concluded that the water in the river is relatively clean and not turbid.
Example of NDTI Usage 2.
For a more comprehensive study, another image from the Sentinel 2A satellite was selected, in the vicinity of the city of Mariinsk.


As we can see from the composite image in natural colors, the water in the Kya River is quite turbid, green. The same picture is provided by the recalculation to NDTI. Low index values are displayed on the map in yellow and correspond to clean, non-turbid water, and vice versa.
Advantages and Disadvantages of Water Indices
Advantages:
- Simple calculation formulas
- Quick generation of results
- High accuracy in identifying hydrography objects
- Obtaining quality results despite atmospheric influences
- Extensive use of indices for monitoring purposes
Disadvantages:
- Not every affordable satellite has infrared channels. (Satellites with a high spatial resolution camera usually capture images only in the visible range, which does not allow us to calculate all indices);
- The absence of a specific discrete scale for indices forces us to rely on visual analysis of images (an example was given for WRI).
Conclusion
In this article, we have clearly demonstrated that the water indices discussed earlier easily allow for monitoring for various purposes. Each of the water content indices qualitatively identifies water objects. The choice of which one to use depends on the purpose of the study. For example, NDWI and MNDWI are excellent for showing the amount of moisture in plants. WRI easily deciphers water bodies and so on. Usually, multispectral images have not very high spatial resolution, but if the technical task allows, based on free data and any GIS program, such as QGIS, anyone can engage in monitoring for their personal purposes. The article presented only indices for determining the characteristics of water bodies, but there are a huge number of other indices for various monitoring tasks.

Sat-Sun: Non-working days