of geospatial solutions
Sat-Sun: Non-working days
What equipment is used to survey the surface
To obtain the NDVI index, spacecraft, airplanes, UAVs, and multi-rotor drones equipped with NIR cameras are used. The survey is carried out from space or by airborne carriers from altitudes of 300-700 m, which allows to obtain the most accurate image. On average, the productivity of this equipment allows to survey 5 thousand hectares per day.The works include several stages. First, the equipment is calibrated in accordance with the type of vegetation. After that geodetic markers are placed and the territory is surveyed. At the same time, the registration of coordinate information is carried out.
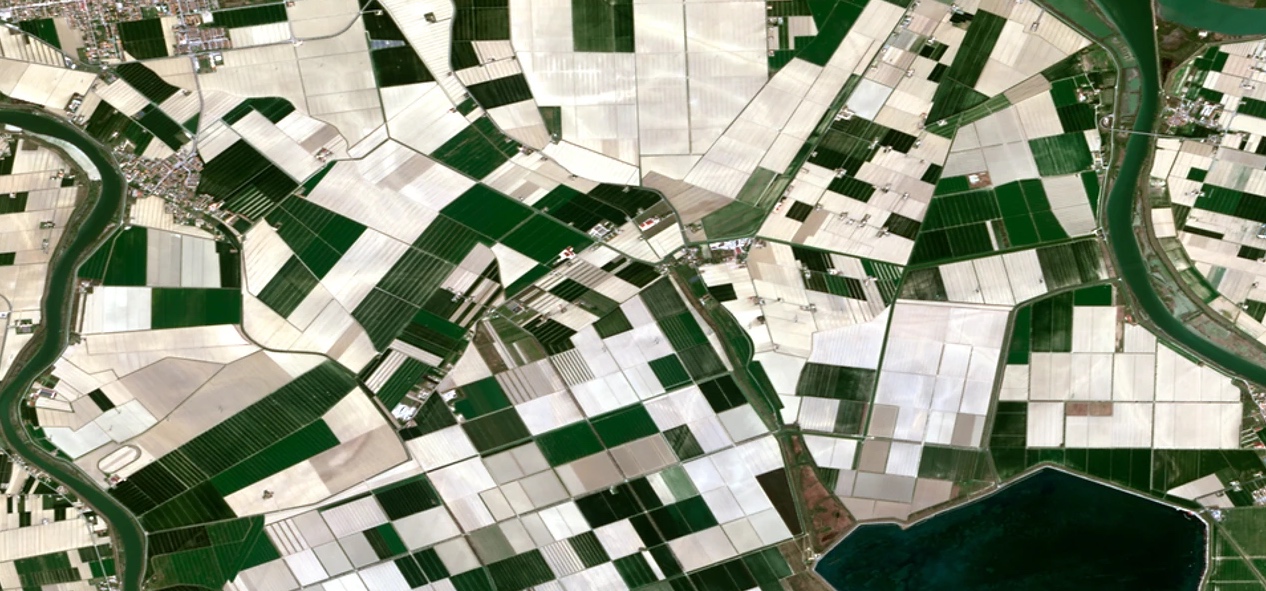
After all the necessary surveys, the customer receives a map of the area and a detailed photographic plan of the field. The data can be presented in graphical and digital form.

What is NDVI in Remote Sensing?
NDVI stands for Normalized Differential Vegetation Index. It is a measure of the biomass active for photosynthesis. In simple terms, it can be used by a specialist to find out if the plants are healthy. In addition, in this way the map visualizes the area under study and determines whether there are abnormal changes in it.Maps with NDVI data can be used independently or in conjunction with a farm management system. But most often they are used on large areas of row crops and grain crops. This methodology is especially indispensable in areas with difficult terrain and the presence of foreign objects. For example, the NDVI index allows you to see if there is concrete or asphalt, water sources and snow cover. All this is of great importance when organizing crops.
What are NDVI maps?
NDVI is an index that stands for plant health. It is used to determine how much active biomass they contain. At the moment, this index is one of the most informative. It allows for a short period of time to assess the condition of the fields. A special formula is used for calculation. It is by this formula that experts accurately determine the density of plantations in a selected point.NDVI is used to determine the degree of crop development. During the entire vegetation period, this indicator increases, and then begins to gradually decrease. In this way they determine the most efficient way of harvesting the fields, because the lower the indicator, the drier the grain.
Also, regular inspection of NDVI maps allows you to timely identify the center of spread of pests or infections. Quick detection increases the effectiveness of the fight against the problem.
How NDVI is calculated
The calculation is based on using a mathematical method of comparison. The principle behind NDVI maps is that the main pigment of any plants, chlorophyll, reflects green waves well. Chlorophyll also absorbs red wavelengths. These are the main elements that make photosynthesis happen, which means the crop grows and develops. The intracellular structure reflects near-infrared waves. As a result, you can see that a healthy plant with a good cell structure and a lot of chlorophyll actively absorbs red light and reflects near-infrared light. If the plant is sick, the opposite is true.To determine the condition of all vegetation, the values in absorption and reflection of red and infrared rays are compared. This gives the NDVI index.
What NDVI Means at Different Stages of the Season
NDVI (Normalized Difference Vegetation Index) helps determine the current state of plants. However, it cannot identify the causes of diseases. Farmers measure this index several times a year to determine which nutrients are lacking in plants and to devise a strategy for supplementation.
Beginning of the Season
At the start of the season, NDVI reflects the condition of plants post-winter. Interpretations are as follows:
- 0.15 – This is the lowest index, indicating that the crops likely did not survive the cold.
- 0.15–0.2 – A low index indicating that plants entered winter at too early a phenological stage.
- 0.2–0.3 – A good result, indicating healthy plants ready to transition to the vegetative stage.
- 0.3–0.5 – The highest index indicating robust vegetation.
If atypical readings are observed, further investigation of that area is recommended.
Mid-Season
During this stage, NDVI helps determine the health of plants in the field. An index between 0.5 and 0.85 suggests no issues in that area. Lower values indicate a need for more nutrients or water.
This vegetation index can also be used to create nitrogen fertilization maps, identifying areas with different vegetation levels to optimize nutrient application.
End of the Season
At the end of the season, farmers can assess crop readiness for harvest. An optimal NDVI range is 0.3–0.35, indicating that the area is ready for harvesting.
Advantages and Disadvantages of NDVI
There are numerous advantages to using NDVI calculations. Primarily, it helps detect plant diseases at an early stage, significantly increasing the chances of saving the crop. It also allows for the efficient assessment of large areas in a short period of time.
Other advantages include:
- Precise data in high resolution
- Unmanned aerial vehicles with high IP indices provide data collection in any weather conditions
- Accurate calculation of required fertilizers
- High yield forecasting
- Precise determination of damage extent
- Identification of areas with water deficiency or excess
NDVI is used to assess the quality of planting work, ensuring proper pesticide application, uniform fertilizer distribution, and detecting overlaps. Additionally, NDVI data is used to calculate LAI (Leaf Area Index) and understand the Photosynthetically Active Radiation (PAR) index.
NDVI is also used in weed control. Images taken weeks before plant wilting can reveal areas with and without weeds. Alternatively, post-harvest images can be used for this analysis. Early weed detection can also be achieved by installing special sensors in the field.
However, there are several drawbacks. Firstly, high cloud cover can hinder quality imaging, resulting in less frequent updates of NDVI maps during poor weather conditions.
NDVI values also depend on crop width and row spacing, especially evident during early vegetation stages before rows close. While NDVI is a valuable tool, it cannot entirely replace agronomist field visits. Nevertheless, it helps specialists identify areas that require more attention.
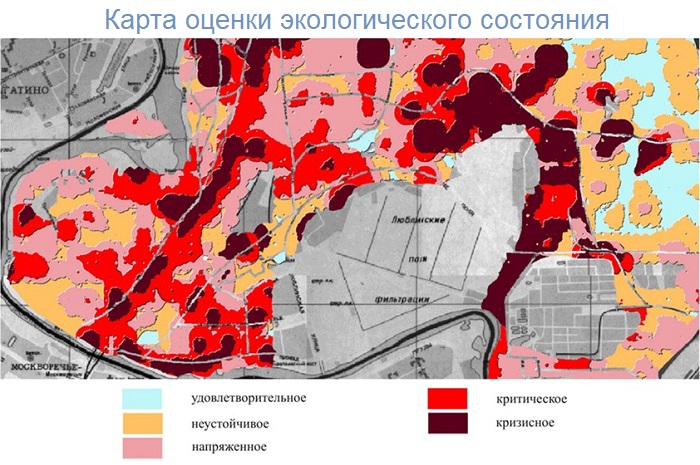
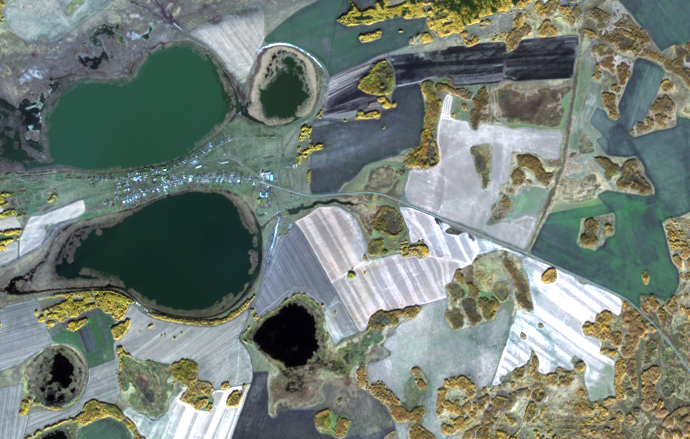
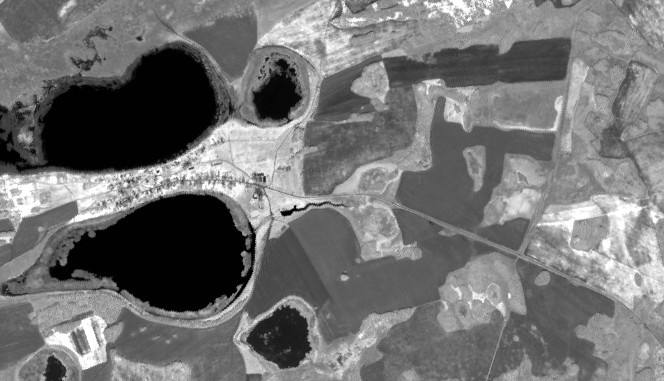
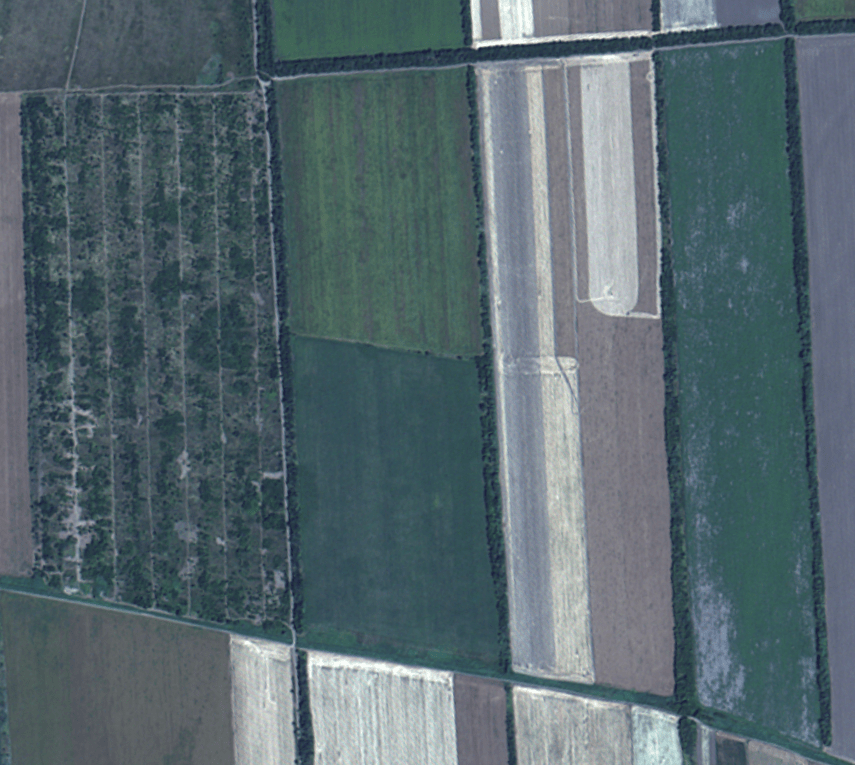
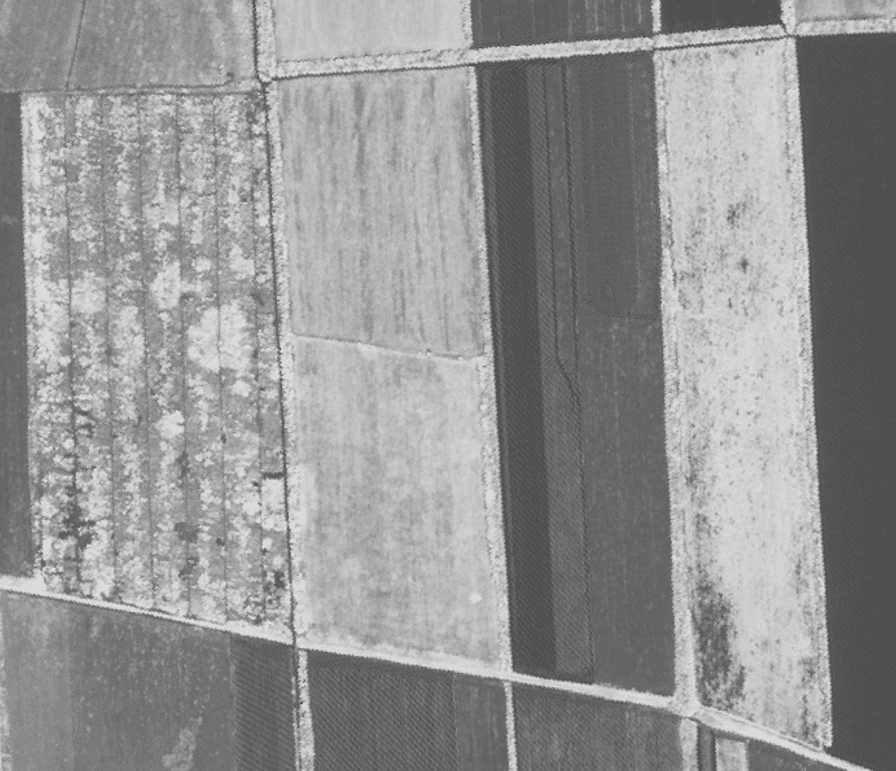
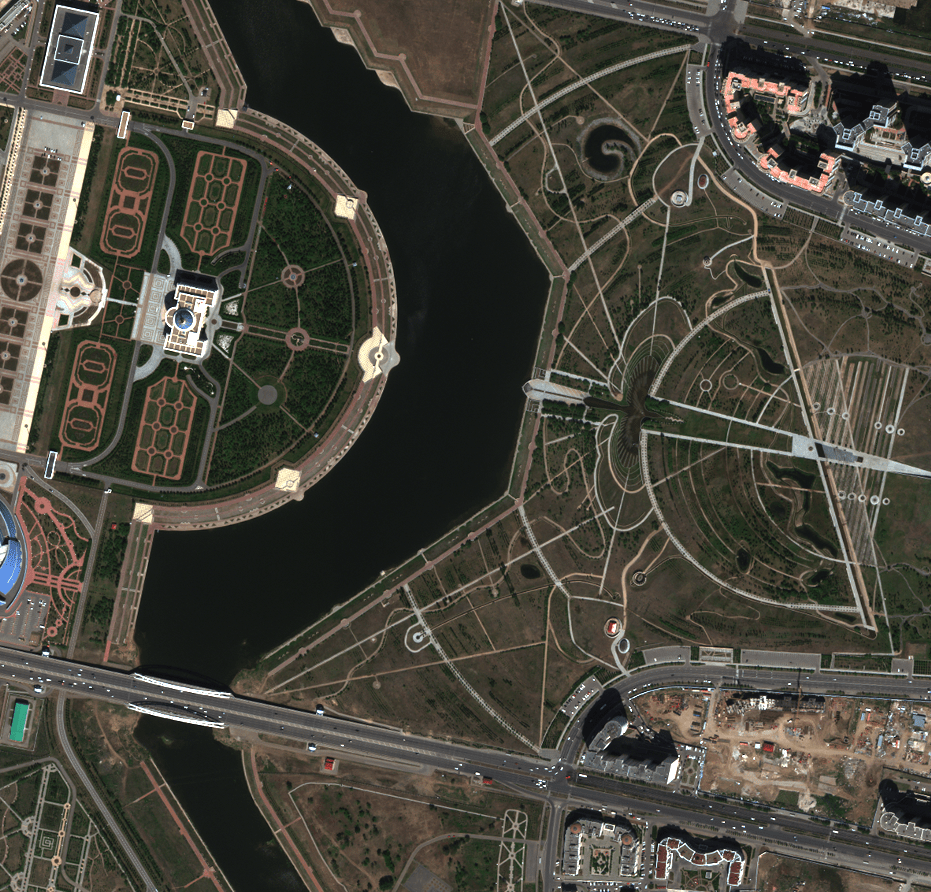
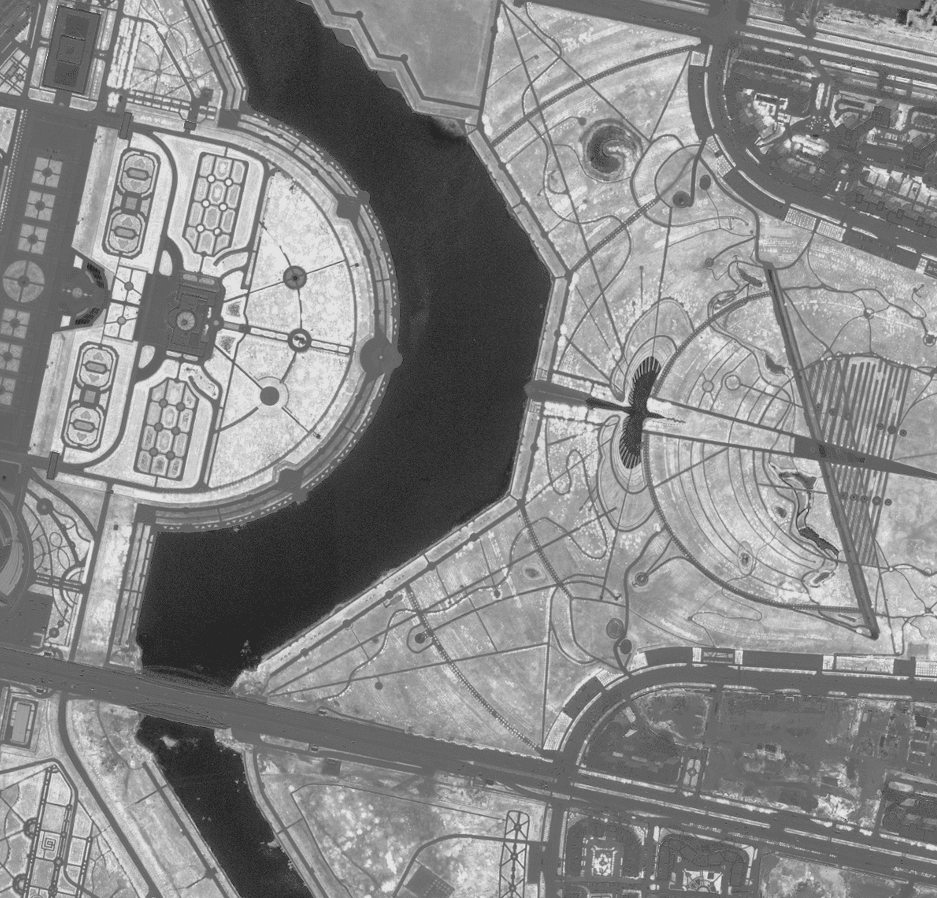
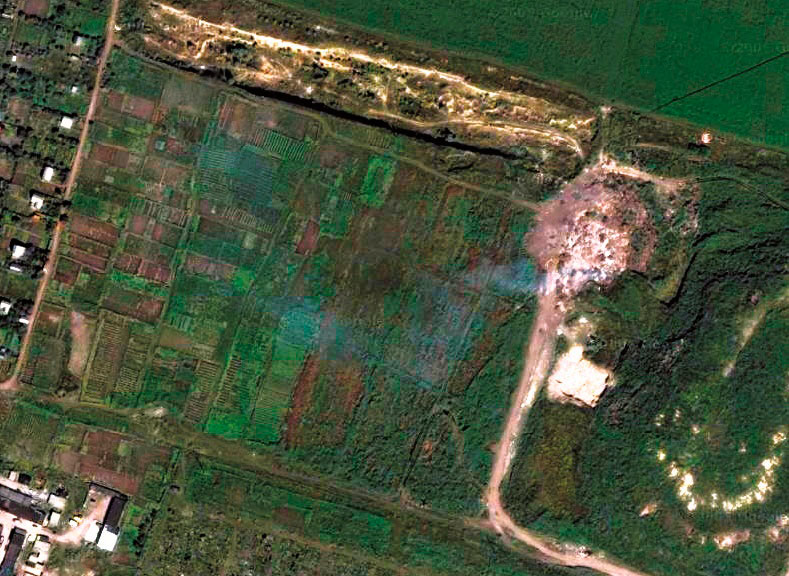
Examples of Using NDVI
You can order from us


Sat-Sun: Non-working days