of geospatial solutions
Sat-Sun: Non-working days
Abstract
In this article, we will examine the significance and advantages of monitoring the Northern Sea Route using remote sensing methods (RS), as well as the main technologies and approaches applied to data collection and analysis. Monitoring the Northern Sea Route through RS opens up new prospects for enhancing safety, optimizing transportation logistics, and more efficiently utilizing this unique maritime route.
Introduction to the Northern Sea Route
The Northern Sea Route (NSR), stretching along the northern coasts of Russia from the Atlantic Ocean to the Pacific Ocean, represents one of the most important directions for the development of maritime transportation logistics from an economic perspective. Reducing the time and costs of cargo delivery between Europe and Asia opens up new prospects for trade and economic cooperation between different regions of the world.
Significant progress in the development of the NSR occurred during the Soviet Union. In 1932, an expedition led by O. Yu. Schmidt on the icebreaker "Alexander Sibiryakov" first navigated the Northern Sea Route from Arkhangelsk to the Bering Strait in a single navigation season. Infrastructure, including the development of ports and ice bases, was established in the 1930s and 1940s.
The route's geography includes several seas: the Barents, Kara, East Siberian, and Chukotka Seas. It passes through the archipelagos of Novaya Zemlya and Franz Josef Land, along the coast of Siberia, and the islands of Chukotka. Key points on the route include the seaports of Murmansk, Naryan-Mar, Dixon, Tiksi, Pevek, Anadyr, as well as islands such as Franz Josef Land and Wrangel Island.
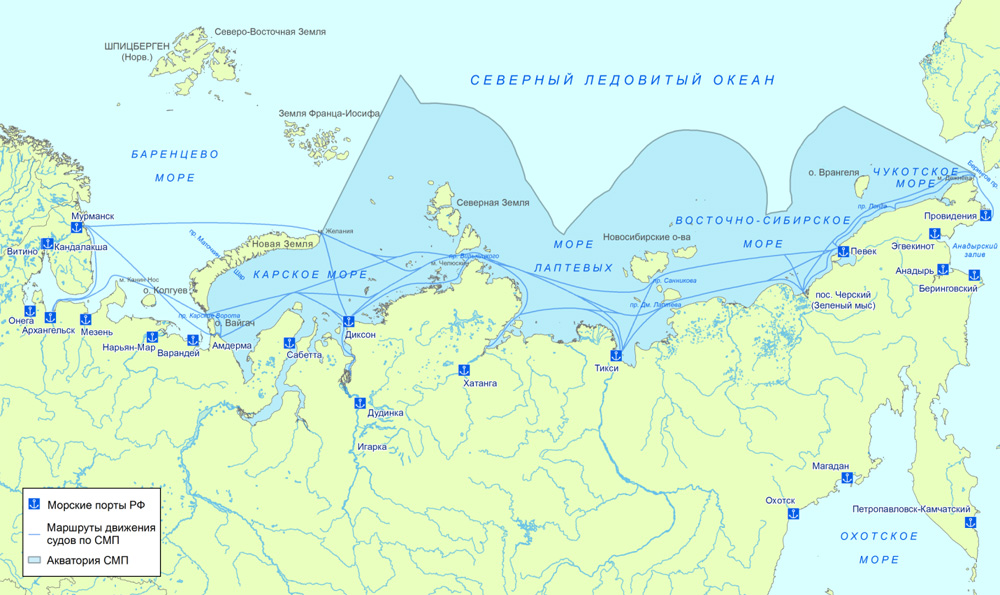
Figure 1. The Northern Sea Route and its waters
This route has significant potential for the development of international trade and the exploration of the riches of the Arctic region. At the same time, the NSR is a complex maritime route that requires special attention and caution. Variable climate, harsh natural conditions, low temperatures, short summers, and underwater obstacles pose serious challenges to safe and efficient navigation in this area.
Therefore, monitoring the Northern Sea Route becomes an integral part of the strategy for the development and safety of this maritime route. With the help of modern technologies, such as remote sensing (RS), valuable data and information about the state of sea ice, severe weather conditions, constantly changing marine topography, and other aspects affecting the safety and efficiency of navigating this route can be obtained.
Monitoring the Northern Sea Route (NSR)
Potential Benefits of Space Monitoring
Space monitoring of the Northern Sea Route is a necessary tool for efficient management and exploration of the Arctic region. The combination of satellite observation and data transmission systems allows real-time information retrieval and monitoring various aspects of the environment, including ice conditions, weather events, ecosystem status, and navigation safety.
Benefits of space monitoring for optimal use and safe navigation of the Northern Sea Route:
- Increased accessibility.
Satellites enable data collection about the Northern Sea Route, even in remote and inaccessible areas. High-orbit satellites provide broad coverage, allowing information retrieval from multiple route segments simultaneously. Such data accessibility is a crucial factor in voyage planning, decision-making, and managing potential risks.
- Continuous observation.
Space monitoring provides continuous observation of the NSR throughout the navigation season. This enables information retrieval on the dynamics of changing ice conditions, weather anomalies, currents, and other factors influencing navigation safety and efficiency. Monitoring contributes to the timely detection of changes and the implementation of appropriate measures.
- Navigation improvement.
Considering the unique features of the NSR, such as ice presence and variable meteorological conditions, precise navigation is critical for navigation safety. Data obtained from satellites provide information on ice conditions, weather forecasts, currents, and the dynamics of changes in the geographical environment. This helps ships prevent ice collisions, choose optimal routes, and make real-time decisions.
- Environmental protection.
Monitoring contributes to a detailed study of the ecological state of the Arctic region, timely detection, and monitoring of emergency situations such as oil spills or other marine pollution. Thanks to space observation systems, it is possible to react to such situations more quickly and efficiently, contributing to the preservation of the unique Arctic ecosystem.
Monitoring Methods
Satellite Monitoring:
For satellite monitoring of the NSR, satellites equipped with optical-electronic devices, radars capable of obtaining high-resolution images and data on ice formations, as well as meteorological sensors providing temperature and weather data, are used.
Optical Range Monitoring:
The optical range consists of ultraviolet (UV), visible, and infrared (IR) wavelength bands. Most satellites capture images in the visible and near-IR ranges since the human eye can perceive images in the visible range, and IR is a useful tool for analyzing not only ice cover but also other objects. The optical spectrum's wavelength range is approximately from 400 nm (violet) to 700 nm (red), although this may vary depending on specific instruments and sensors.
Some Russian satellite systems, such as "Arktika-M" and "Resurs-P," are equipped with optical and infrared sensors that allow observation of ice cover, cloudiness, and other atmospheric parameters. The data obtained from satellites is transmitted to Earth for analysis and the creation of up-to-date maps of NSR ice conditions.
- Identification of ice types and concentration: Optical sensors on satellites provide high-resolution images (1-10 m), allowing the determination of ice types such as open water, thin ice, multi-year ice, etc. Additionally, infrared sensors can detect various temperature zones on the ice cover, crucial for assessing its stability.
- Ice movement monitoring: Satellite systems with optical and infrared sensors enable real-time tracking of ice movement, crucial in Arctic seas for forecasting and preventing potential ice collisions for ships.
- Detection of ice hummocks and icebergs: Optical sensors on satellites can detect ice hummocks and icebergs, crucial for safe navigation. Timely detection and monitoring help prevent possible collisions and minimize risks for ships.
Radar Monitoring:
Radar systems are used to observe ice formations on the surface of the NSR. They operate based on the principle of echolocation, emitting electromagnetic waves in the radio frequency range and registering the reflected signal from ice and the water surface. The method is based on the separation of radar signals reflected from areas of open water surface and initial types of ice in gaps and signals reflected from fields of one-year and multi-year ice. Ice thickness is calculated based on its elevation using the equation of hydrostatic equilibrium, using fixed values of sea water and ice density. An distinctive feature of radio waves is their ability to pass through clouds.
Radio frequency ranges:
- X-band: from 2.4 to 3.75 cm (from 12.5 to 8 GHz). Data in this range are widely used for military intelligence tasks and a wide range of civilian applications. It has high resolution on the ground (up to 1 m) due to the relatively small wavelength compared to other ranges but has a smaller coverage area. Due to this same property of wavelength, it is widely used in meteorology; these radars are more sensitive to fog and clouds consisting of tiny water droplets. They are also used for detecting snowfall and areas of light rain. However, due to low penetration capability (Fig.2), it is less suitable for monitoring ice thickness. Radars in this range are used on satellites such as TerraSAR-X, TanDEM-X, and CosmoSkyMed-1,2,3,4, and will be used on the Overview-R satellite (scheduled launch in 2024);
- C-band: from 3.75 to 7.5 cm (from 8 to 4 GHz). Data in this range have the broadest application for ice monitoring. Due to data availability and wide applicability, this method is the most versatile and is often used in both research and practical activities. Radars in this range are used on satellites such as ERS-1, ERS-2, ENVISAT, Radarsat-1, Radarsat-2, Sentinel-1A, and others;
- S-band: from 7.5 to 15 cm (from 4 to 2 GHz). Compared to the X-band, the S-band is more often used in long-range detection radars. Russia has extensive experience in creating satellites with this range. The radar in this range was used on satellites such as Almaz and Condor-FKA;
- L-band: from 15 to 30 cm (from 2 to 1 GHz). It penetrates vegetation, including not very dense forests. The radiation in this range can partially penetrate dry snow, young ice, and dry soil to a depth of several meters. It has been used on satellites such as SEASAT, JERS-1, ALOS PALSAR, and others;
- P-band: from 30 to 100 cm (from 1 to 0.3 GHz). It penetrates vegetation, including dense vegetation, and is used for biomass assessment. It can penetrate dry soil, dry snow, and ice to a depth of several meters. Implemented on aircraft carriers.
The penetration capability of radar beams increases with increasing wavelength;
Radars with wavelengths longer than 2 cm penetrate cloud cover, but rain and snow are significant complicating factors for radar systems with wavelengths up to 4 cm.
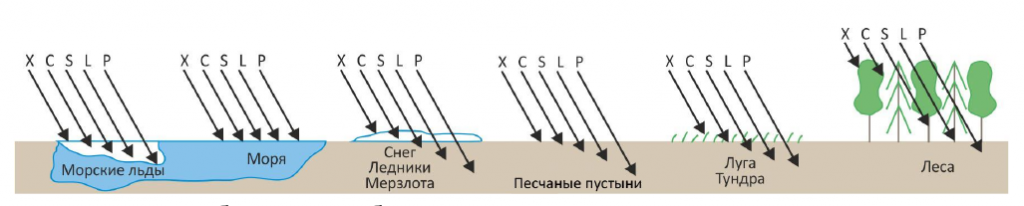
Figure 2. Penetration capability of waves depending on the range
- Signal Polarization:
Polarization is the orientation of the electric vector component of an electromagnetic wave in space. Parallel horizontal (HH) polarization is oriented horizontally relative to the surface, while vertical (VV) polarization is oriented vertically. Typically, horizontal polarization is used for ice monitoring because it provides better sensitivity to ice properties and has lower interference levels from other signal sources. Vertical polarization is used for monitoring water surfaces.
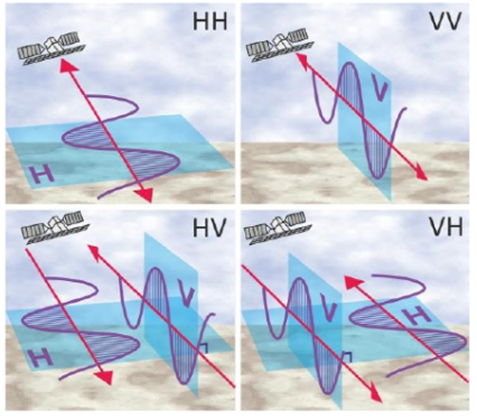
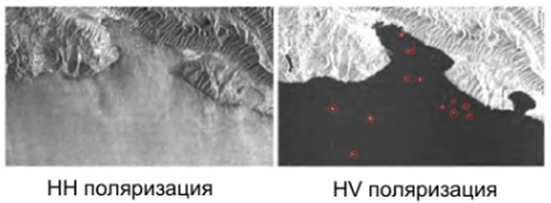
There are also cross-polarizations VH and HV. In this case, the surface is illuminated in one polarization, and the reflected signal is received in another. Due to strong reflection from the sea surface, which is close in level to the reflection from land, vessels are detected only in cross HV polarization.
 .
.
Figure 3. Images of vessels on radar images with HH polarization and HV
In ice monitoring, the key for satellites is polarization; they must have both HH and HV, ideally having all four polarizations for monitoring. This data allows creating ice condition maps with the designation of hazardous zones and determining safe and accessible routes for vessels passing through the NSR.
Meteorological Monitoring Systems.
For meteorological monitoring of the NSR, meteorological stations and buoys are installed, but mainly, space complexes such as "Meteor-M," a group of satellites consisting of 4 devices as of 2023, and "Arktika-M" are used. Satellites are equipped with sensors capable of measuring weather parameters such as air and water temperature, humidity, pressure, wind speed and direction, and other meteorological characteristics.
Data from stations are transmitted to coastal and ground monitoring centers, where data processing and analysis for weather forecasting and climate condition assessment take place.
Meteorological monitoring also includes the use of weather prediction models used for long-term and short-term forecasts to warn of adverse weather events such as storms or strong winds that may affect navigation safety.
Space monitoring methods have a number of advantages and disadvantages as well.
Advantages of space monitoring methods:
- Meteorological monitoring provides real-time data on weather and maritime conditions for weather forecasting and warning of weather phenomena.
- Radar monitoring provides wide geographical coverage and the ability to observe in hard-to-reach areas of the NSR.
- Radar monitoring has the ability to detect ice formations and has high penetration capability through cloud cover and the atmosphere due to the properties of the electromagnetic wave in the radio frequency range.
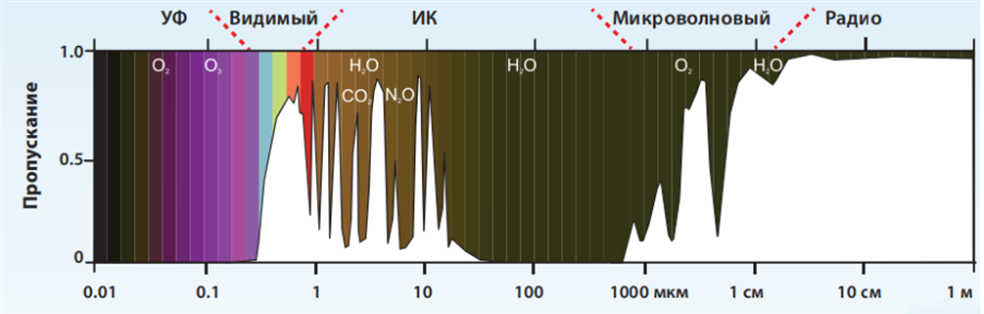
Figure 4. Passage of electromagnetic wave through the atmosphere depending on its length
Disadvantages of space monitoring methods:
- Limitations on the spatial resolution of satellite monitoring images can hinder the detailing and precise classification of ice formations.
- Data transmission delay from satellites to Earth can be several hours, which may hinder obtaining up-to-date information for operational decisions.
- The capabilities of radar monitoring are limited by environmental conditions (e.g., northern lights) and the inability to distinguish details of other objects, apart from ice, on the sea surface.
Ground Observing Points:
Ground observation points are located along the NSR coastline and equipped with sensors designed to collect data on ice formations, weather, and maritime conditions.
Ship Observation:
Ships, including specialized research vessels and icebreakers, play a crucial role in monitoring the NSR. They conduct on-site observations, study ice formations, record changes in ice cover, and collect data on weather and maritime conditions. Equipped with radars, radiolocators, and other sensors, they provide information about ice conditions, helping to determine safe routes and confirming data obtained from other sources.
Ship drones also exist. Engineers from SPO "Arktika" and PO "Sevmash" have created an experimental ship drone capable of landing on the deck. This drone is designed to perform various tasks in Arctic conditions.
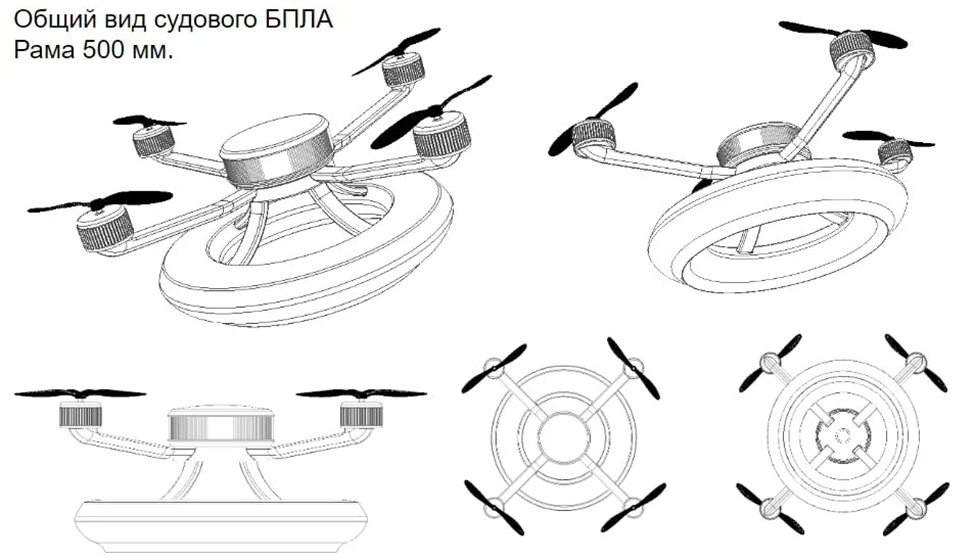
Figure 5. Developed UAV for monitoring located on board vessels
In 2023, the world's first tests of a drone from the deck of the nuclear icebreaker Taymyr were carried out. The UAV performed a flight along the specified trajectory and conducted visual and radar surveys of the Arctic waters.
The complex includes a vertical takeoff and landing UAV with a hybrid power plant, equipped with an optoelectronic system, a side-view radar, and an onboard special-purpose computer. It is also equipped with software for working with image processing and recognition algorithms. As part of field tests, the drone conducted two route flights.
In the next stage of development, specialists planned to implement a fully automated landing system on the deck without operator involvement, followed by repeated tests in the natural environment with landing on an icebreaker in motion during pitching.
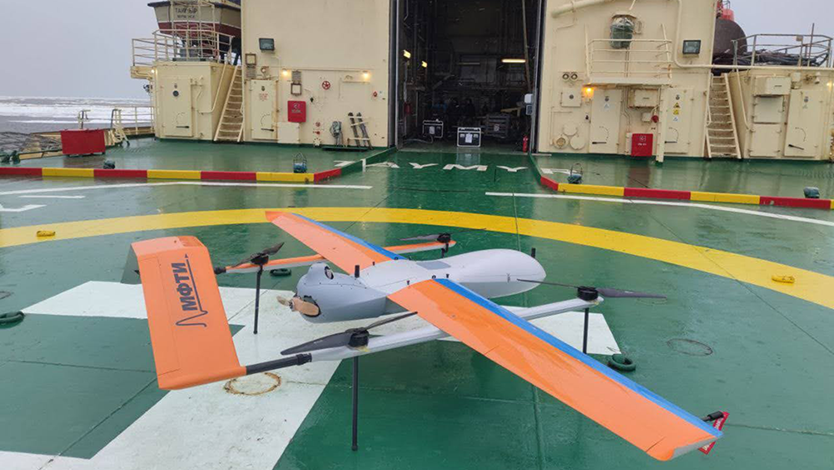
Figure 6. UAV on board the nuclear icebreaker Taymyr
Its uniqueness lies in the use of modern numerical methods and algorithms for synthesizing and autofocusing high-resolution radar images on board a lightweight UAV. The complex of operational aerial ice reconnaissance is one of the components of the emerging digital ecosystem of the Northern Sea Route.
All these methods have their distinctive features and advantages. However, in practice, it is often not enough to rely on a single method, and a so-called combined monitoring method is used.
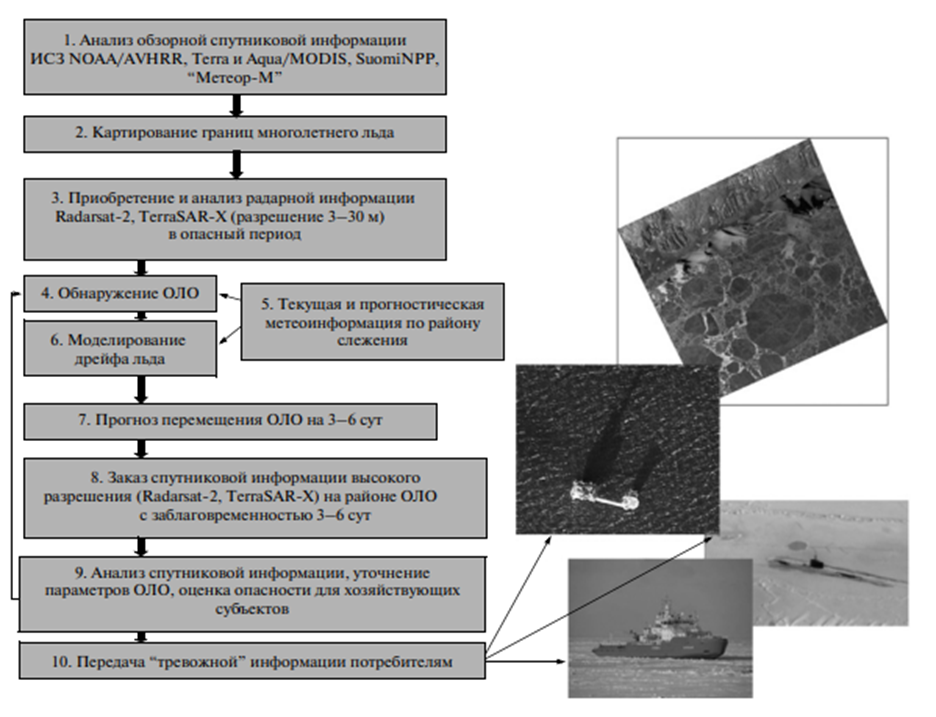
Figure 7. Diagram of staged use of satellite means for monitoring ice cover and detached ice fragments near protected objects
Climate Change and Environmental Aspects
The Arctic ice cover is undergoing significant changes due to global warming. Space monitoring plays a key role in studying and assessing the dynamics of ice changes. Satellite data allows monitoring the area, thickness, concentration, and mass of ice, as well as tracking its movement, condition, and formation. This information is crucial for researching ice melting processes and understanding their connection to climate change.
One special capability of space monitoring is its ability to provide continuous observation of the Arctic ice state over large areas, combining the advantages of overview with high-resolution capability. Many modern satellites are equipped with instruments for measuring radiation, microwave emission, and reflectivity, providing detailed information about the physical characteristics of ice. This helps researchers understand the processes of ice melting and formation in different regions of the Northern Sea Route.
Additionally, space monitoring is actively used to study the impact of changes in the ice cover on the marine ecosystem. Satellite observations allow tracking changes in the availability of food resources, migration routes, and the distribution of marine species.
Another significant area of research is the influence of global warming on ocean currents in the Northern Sea Route. Space monitoring allows tracking surface currents, water temperature, and ice mass transport. These data provide scientists with information about the dynamics of currents and their interrelation with changes in the ice cover. This helps predict the impact of changes in currents on the marine ecosystem, including fishing, migration of marine species, and the state of marine flora.
Space observation also provides an opportunity to assess the impact of changes in the ice cover on the biological diversity and ecosystem of surrounding waters. Many animals, such as walruses, seals, polar bears, and some whale species, depend on the presence of Arctic ice for resting, breeding, and finding food. Space observation helps researchers understand how changes in the ice cover affect the availability of food resources and migration routes for these species.
Figure 8. Greenland Seal and Puffin - Inhabitants of the Arctic Circle
Thanks to satellite data, scientists can assess the state of ice, its dynamics, formation, and melting in different regions of the Arctic, monitor the state of the ecosystem, and more accurately predict climate changes and their consequences for the marine ecosystem. Space monitoring also helps researchers track changes in migration routes, feeding habits, and reproduction of animals within the Northern Sea Route. The wide range of these capabilities contributes to the development of effective strategies for protecting the environment in vulnerable Arctic regions and preserving the unique biodiversity of this region.
Practical Application and Forecasting
Creating Ice Situation Maps
The main goal of monitoring the Northern Sea Route through space is to create Ice Situation Maps. These maps reflect the forms of floating ice in seas and lakes (coastal ice, floating ice floes, icebergs, ice fields, etc.). The map shows the age of the ice, its cohesion, dynamics, and other characteristics. Operational ice situation maps are intended for navigation and are compiled based on ice reconnaissance and aerospace imagery. Overview maps - for scientific purposes - are produced on a decade, monthly, and seasonal basis.
In the 1980s, to address the challenges of ice monitoring and hydro meteorological support (HMS) for Arctic marine transportation, the "Automated Ice Information System for the Arctic" (the "North" system) was created at AARI (Arctic and Antarctic Research Institute) and underwent modernization in 2004-2006. Currently, the entire process of creating ice maps is carried out in the ArcGIS system. Using graphic tools, homogeneous ice zones are highlighted on georeferenced satellite images, with subsequent conversion of closed contours (boundaries of highlighted zones) into polygonal objects in the form of a vector file. Then, the highlighted zones are assigned attribute data in interactive mode (with editing capabilities) using a special dialog box. In accordance with the attributes, the map consisting of ice zones is automatically presented in Russian or international symbols.
- Source Information: Currently, the primary, and often the only, source of information about the state of the ice cover is satellite images that regularly cover the entire Arctic Basin area several times a day. When compiling an ice map, the expert analyzes various types of satellite data: optical imagery, active radar data, passive radiometry, etc.
- Before describing the process of creating ice maps, it is worth noting that the modern methodology of ice mapping is entirely based on the experience of previous generations of ice observers. The task of the ice expert is to correctly interpret images obtained in various electromagnetic spectrum ranges, which requires significant experience and, if possible, participation in fieldwork to improve decoding skills by comparing satellite images with real ice conditions.
Ice monitoring is divided into two periods.
Winter Period (October 1 - May 31 for Arctic seas): The process of creating a map in the winter period begins with determining the boundaries of the main ice zones - old ice, one-year ice, young ice, nilas (including initial ice types), as well as the position of drifting ice edges and coastal ice boundaries. For outlining these boundaries, radar images are mainly used. The boundary of the old ice array in the polar region of the Arctic is highlighted due to the high values of the specific effective scattering area (SESA) and, consequently, the bright tone of this ice among the darker one-year ice. The position of the drifting ice edge is conveniently determined using radar data, as cloudiness on optical images hinders observation of its dynamics. If more current information in the optical range is available, the edge position can be adjusted. For other purposes, microwave data are used sparingly, as they can show errors that are significant for ice mapping purposes. The coastal ice boundary can be easily restored from radar images, visible, and IR range images.
Further detailed differentiation of the ice cover into homogeneous zones is better done using visible and infrared (IR) range data during the polar day. The representation of ice is influenced by characteristics such as albedo (in the visible and near-IR ranges) and surface temperature (in the thermal IR range), which, in turn, depend on the thickness of the ice. Radar images do not exhibit such a clear dependence, and the identification of various types of one-year and young ice becomes significantly more complicated. It should be noted that during the winter months in the Arctic, the polar night prevails, which excludes the use of data in the visible range of the electromagnetic spectrum from mid-October to early February.
Homogeneous zones are separated if they have different overall cohesion and/or age composition of the ice. Cohesion is determined visually on a 10-point scale, where 1 point corresponds to 10% of the sea surface area. Overall cohesion shows the proportion of the sea surface occupied by ice, and the age composition indicates the quantitative ratio of different types of ice (up to three), formed within each ice zone. The sum of partial cohesions always equals the overall cohesion. The age composition of the ice, as well as the size of the encountered ice formations, is indicated in a symbol corresponding to the highlighted homogeneous zone.
Summer Period (June 1 - September 30 for Arctic seas): During the summer season, only zones with different overall ice cohesion are highlighted in the ice cover without indicating its age composition. This is because the appearance of a meltwater layer on the ice surface significantly alters its representation in all types of satellite images, and differences between ice types become invisible. To determine the overall ice cohesion in the summer season, radar images, as well as images in the visible range of the electromagnetic spectrum, are the most informative. Thermal IR imaging data become uninformative during this period. Cohesion, as in the winter season, is visually determined on a 10-point scale. The color designation of different cohesions on "summer" maps is also regulated by the Nomenclature of Ice in Sea.
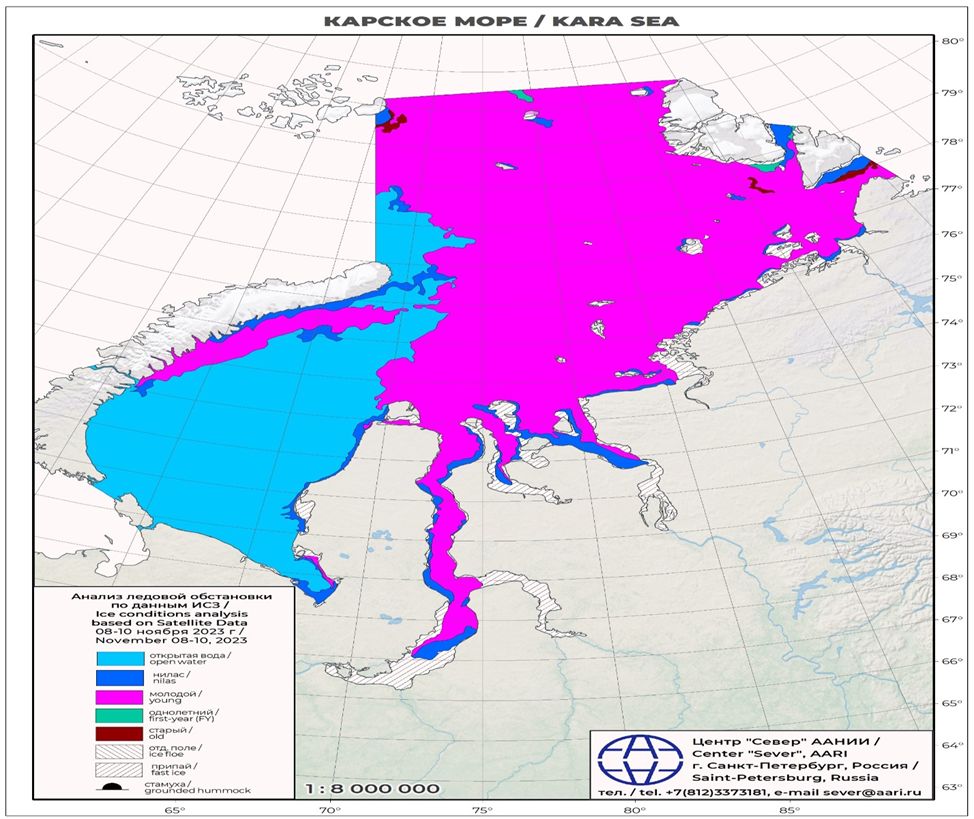
Figure 9. Ice Situation Map of the Kara Sea as of November 8-10, 2023
Challenges and Perspectives
Issues of Data Availability, Quality, and Satellite System Resolution
There is a severe lack of data for monitoring the Northern Sea Route and, more broadly, the Arctic and Antarctic zones due to their geographical location and monitoring nature. Not all satellites with Synthetic Aperture Radar (SAR) capture data in the required ranges and polarizations. For example, the ICEYE SAR satellite with the X-band radio wave range specified for ice monitoring has only one polarization, VV, while monitoring ice conditions strictly requires HH with cross-polarization HV.
Earlier, the need for data was adequately met by the Sentinel-1A/B satellites. However, in 2021, communication was lost with Sentinel-1B, and data from this satellite ceased to arrive, significantly affecting the ice cover monitoring process.
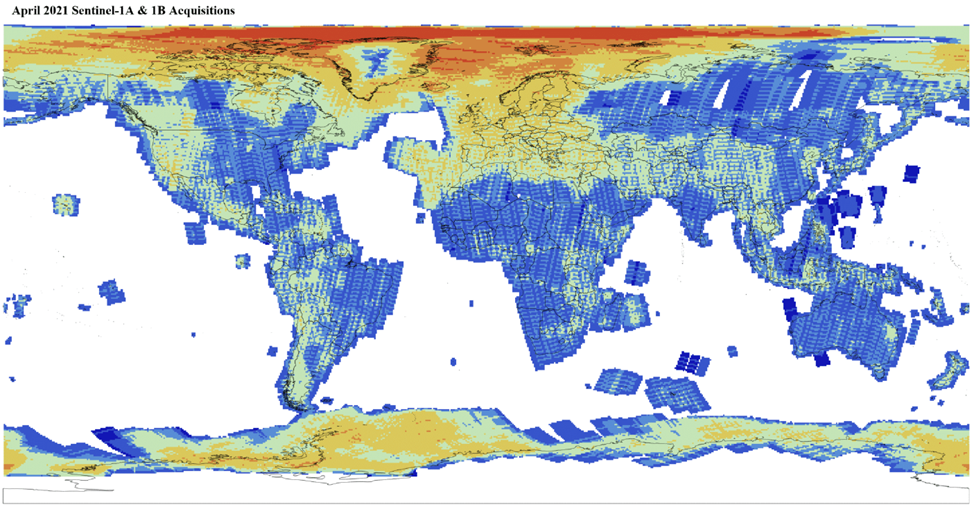
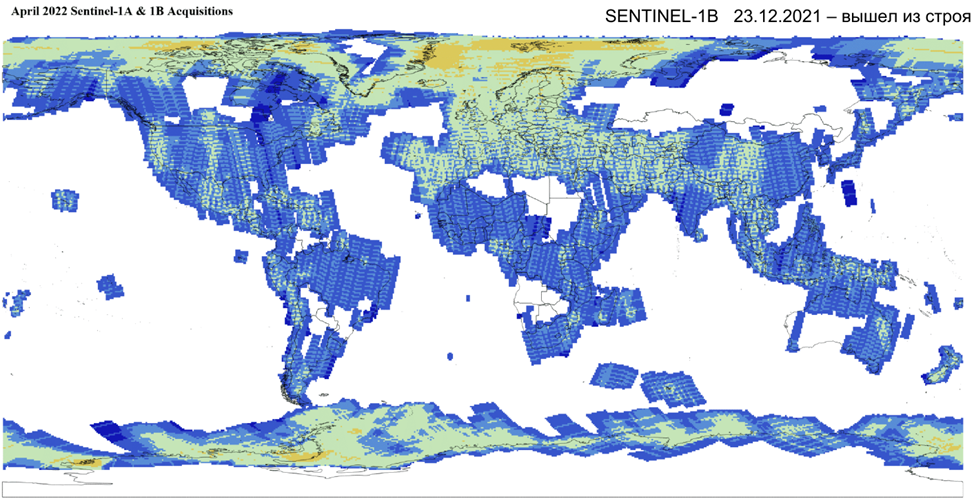
Figure 9. Number of data sets before and after the Sentinel-1B satellite failure. You can observe the decrease in the number of images over the territory of the Russian Federation and the Arctic.
To compensate for the data shortage, plans are underway to launch the third satellite in the Sentinel-1 series, Sentinel-1C, which will be launched as part of the European Copernicus program. The launch was planned on the new ESA Vega-C rocket from the European spaceport in French Guiana in the first half of 2023. However, there is currently no news about the satellite.
Russia's space industry is also advancing. In May 2023, the Condor-FKA satellite was launched (unfortunately, images from this satellite are not yet available for commercial ordering as of 616.11.2023), and in July 2023, the Meteor-M meteorological satellite No. 2-3 was launched. In 2024, multiple satellites are planned to be launched specifically for monitoring the Northern Sea Route, such as Overview-R (X-band with an active phased array antenna (APAA)), Arctica-M No. 2. In 2024, the launch of the Russian radar satellite "Oculus" is planned, marking the beginning of the creation of a Russian orbital satellite group for round-the-clock all-weather monitoring of the Northern Sea Route and the Arctic.
The lack of reliable data on the state of the ice cover on the Northern Sea Route has become a serious problem for many companies involved in maritime logistics and cargo transportation. However, thanks to the development of modern technologies and the use of commercial satellite imagery, the problem is being addressed.
Commercial images obtained through satellite systems allow for more accurate and detailed data on the state of the ice cover on the Northern Sea Route. These images have high quality and cover a large area, making them an invaluable tool for monitoring ice conditions.
Creation of a Unified Digital Platform for NSR Digital Services
The project to create a unified digital platform for digital services of the Northern Sea Route is a state initiative supported by the Government of the Russian Federation. The project is organized by the Ministry of Transport of the Russian Federation.
The project aims to create a unified digital space to ensure the effective operation of the transport and logistics system of the Northern Sea Route, including infrastructure development, improvement of service quality, and better business conditions.
It represents a comprehensive program aimed at modernizing and developing the transport and logistics system of the region. It includes several stages, each with its own features and tasks.
Stage #1 - development and implementation of information systems for monitoring and managing transportation flows on the Northern Sea Route, which will increase the efficiency of port and terminal operations, improve service quality, and reduce cargo delivery time.
Stage #2 - development and implementation of new technologies and innovative solutions to optimize logistics processes, including the use of drones for monitoring the condition of ports and terminals, the development of automatic identification systems for cargo and vehicles, etc.
Stage #3 - improving the comfort and safety of passengers and cargo. The plan includes the development and implementation of online ticket booking and cargo transportation services, monitoring and control systems for vessel conditions, and other services to make the transportation process more convenient and safe.
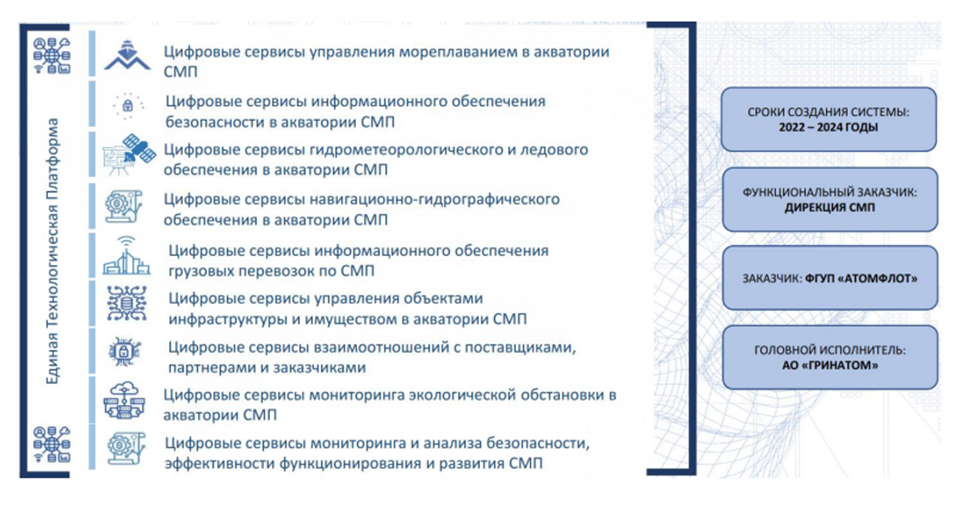
Figure 10. Architecture and subsystems of the unified digital platform for digital systems
The project's tasks include:
- Creation of a unified information system for monitoring and managing transportation flows on the Northern Sea Route;
- Development and implementation of new technologies and innovative solutions to optimize logistics processes;
- Development of electronic services to ensure the comfort and safety of passengers and cargo;
- Improving the efficiency of resource utilization and reducing transportation costs.
The project plans to create a unified digital platform that will bring together various services and information resources related to the operation of the Northern Sea Route. This may include online services for booking tickets and transporting cargo, monitoring and control systems for vessel movement, databases on the condition of ports and terminals, and other services aimed at simplifying and accelerating the cargo transportation process.
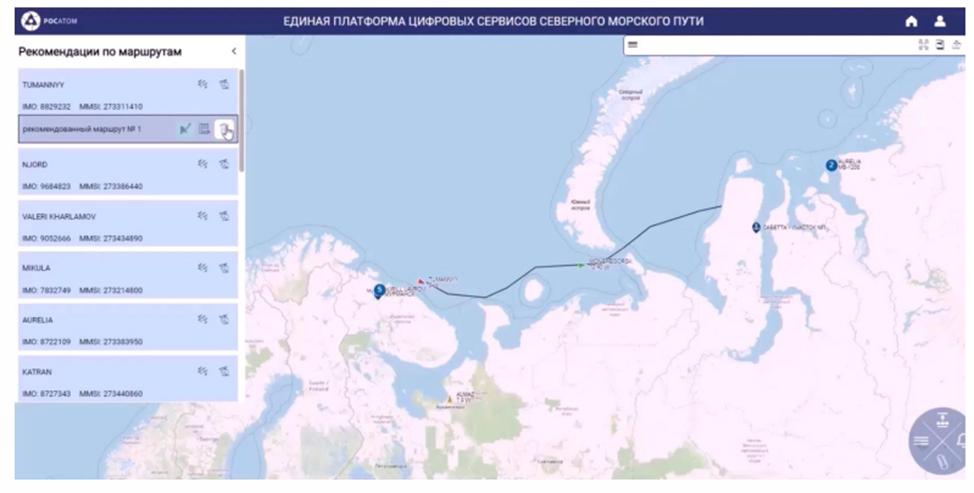
Figure 11. Platform Prototype
Conclusion
Monitoring the Northern Sea Route is an integral part of a modern and comprehensive approach to studying and ensuring safety in the Arctic. This article placed special emphasis on the radar method of ice research, which, with the help of satellite systems, provides reliable and accurate information about the condition and movement of sea ice.
The technical specifications of satellites used for monitoring the Northern Sea Route play a key role in data collection and analysis. For ice and vessel monitoring, HH and HV polarizations are necessary. Satellites such as IceyeSAR or HiSea-1 are not suitable for monitoring the Northern Sea Route and the Arctic because they have only one VV polarization. Regarding the radio frequency range, there are no such strict requirements; with the mandatory polarization, any radio frequency range allows obtaining the necessary data for ice monitoring.
Satellites such as Sentinel-1, Radarsat-1/2, TerraSAR-X, TanDEM-X, ALOS PALSAR, ERS-1, ERS-2, ENVISAT, COSMO-SkyMed 1–4 (if using medium-resolution mode with dual polarization HH/HV), etc., have stood the test of time and proven themselves well in Arctic ice research.
Satellites such as Gaofen-3 (C-band) and KOMPSAT-5 (X-band) are also suitable for monitoring Arctic ice, although they have not been widely used in research.
However, it is essential to note that monitoring the Northern Sea Route is not limited to the radar method of ice research alone. The creation of a digital ecosystem for the sea route, bringing together data from various sources, allows for a more complete and comprehensive picture of the situation. New satellites expected in the near future open up new possibilities for improving monitoring and supporting safe navigation in this region.
Thus, upcoming satellite launches and the development of the digital ecosystem of the sea route will make monitoring the Northern Sea Route even more reliable, efficient, and essential for risk prevention and sustainable development in the Arctic.
Our company, LLC "GEO Innovations," has been supplying and processing radar and optical satellite images since 2020. As of November 2023, we confirm our ability to provide satellite monitoring services in the Arctic zone, including the Northern Sea Route.
Websites for Monitoring the Northern Sea Route:
GlavSevMorPut - the main website for monitoring the NSR in Russia. Provides current ice maps for the Kara Sea, Laptev Sea, East Siberian Sea, Chukotka Sea. Also, you can find synoptic forecasts and hydrometeorological information for the desired date.
Hydrometcenter of Russia - provides fresh data on the current state of sea ice for the required sea. Also, there is information on the cohesion of sea ice in the Arctic and Antarctica.
PolarView – a service developed by an international consortium of experts, providing a wide range of products for Earth observation (data from Sentinel-1, Radarsar-2, etc.), monitoring polar regions, and areas subject to ice and snow.
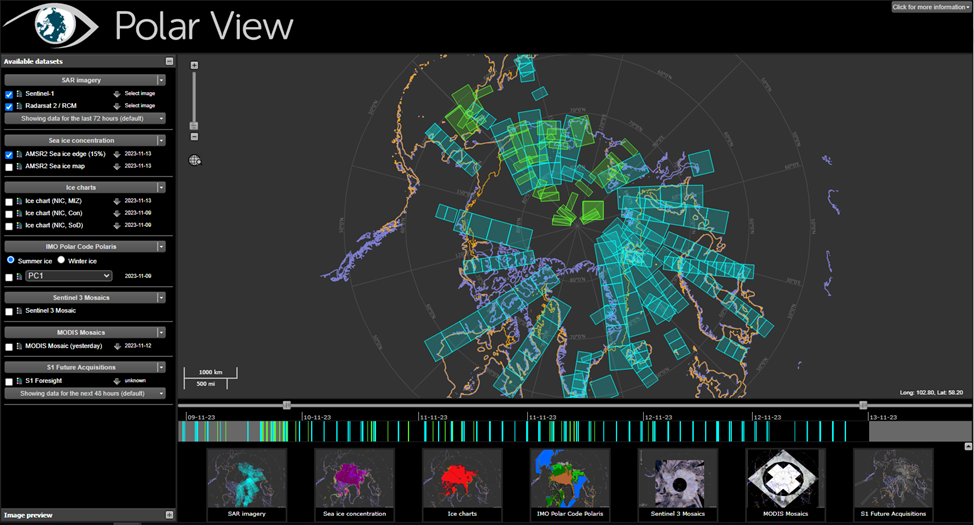
Figure 12. PolarView Interface
National Snow and Ice Data Center at the University of Colorado - an information and reference center in the USA supporting polar and cryospheric research. NSIDC archives and distributes digital and analog snow and ice data and keeps information about snow and ice cover. Provides daily information on the state of the Arctic and Antarctic ice.
Norwegian Meteorological Institute's Ice Monitoring Service - this web portal provides access to current products and information on sea ice, snow, and permafrost (cryosphere) from the Norwegian Meteorological Institute. Provides current ice maps not only for the NSR and Arctic seas but also for nearby seas, bays, and fjords. In addition, it provides mosaics of satellite images from Sentinel-1 and Radarsat-2.
Official Government of Canada website with current information on Arctic ice conditions - the map collects the most recent ice information available on the maps of the Canadian Ice Service. This ice information is updated daily in areas of known maritime activity.
The special opinion of the CEO
Natalia N. Malkova:
"There is a widely spread hypothesis about the dynamics of ice melting in the Arctic zone, which brings prospects for the development of navigation along the Northern Sea Route as an alternative to the route from Asia to Europe through the Suez Canal. So, this hypothesis is not an axiom. Analysis of the results of space monitoring of the ice situation in the Arctic does not lead to the conclusion of a guaranteed annual increase in the navigation period of non-ice-class vessels.
What is guaranteed is the militarization of the Arctic region. The NATO Arctic doctrine is approved, in the USA, in January 2021, the doctrine "Regaining Arctic Dominance" was adopted.
"When Finland and Sweden join NATO, seven out of eight Arctic countries will be NATO members" - NATO Secretary-General Jens Stoltenberg on August 26, 2022.
As of October 20, 2023, competitive pressure from the NATO military bloc for control over the Arctic waters is increasing.
In opposition to this pressure, including to reduce the risk of conflict, Russia in the Arctic is increasingly involving China.
In conditions of growing military tension, the constant ecological monitoring of the fragile nature of the Arctic zone becomes of increasing importance for which Russia, by all means, needs to have its satellite group."
Sat-Sun: Non-working days