Humanity cannot survive for more than three days without water. The entire animal and plant world on the Earth's surface depends on water for survival. This is the defining characteristic of the importance of water resources for the existence of life on Earth.
The demand for water is increasing due to global population growth, which has reached approximately 7.8 billion people (a 307% increase over the past seven decades). Four billion people face severe water shortages, while more than one-third of the population (2.1 billion people) live in arid regions. However, the availability of water in lakes, rivers, and reservoirs has decreased due to climate change, as droughts have become more frequent. Surface freshwater accounts for only ~0.296% of the total water supply in the hydrosphere.
The study of water resource distribution highlights opportunities for humanity to access water for drinking, agriculture, and industry, while also assessing potential threats to water availability based on natural and atmospheric changes on Earth.


Water resource expenditures in various countries indicate that critical situations are emerging in North and South Africa, the Middle East, and India. Even in the United States, Western Europe, China, and Central Asia, the situation is not much better.

The study of water-related issues and the search for solutions to critical water resource challenges worldwide rely on remote sensing (RS) data and methodologies for two-thirds of the analysis.
For example, the specialized satellite Surface Water and Ocean Topography (SWOT) will provide direct assessments of global water resource changes on Earth. Researchers using remote sensing data aim to summarize the latest advances in large-scale hydrological processes.
Additionally, well-established remote sensing methods for water monitoring remain in use, ranging from satellite imagery across known spectral ranges to high-precision thematic aerial photography and UAV surveys. New underwater unmanned systems are also being introduced.
Water resources are generally classified into natural and human-made categories. Natural water resources include seas, oceans, rivers, lakes, swamps, glaciers, groundwater, and soil moisture. Artificially created water resources refer to reservoirs, which are essential for storing large volumes of water.
In Russia, the primary water resources are represented by a dense network of large and small rivers. The country has about 120,000 rivers with a total length of over 2.3 million km, contributing to 10% of the world's total river runoff. Russia is also home to over 2 million lakes and 100,000 swamps. Among the tens of thousands of reservoirs in the country, 325 are the largest, with a total capacity of around 10 million m3. The territory of Russia is washed by the waters of 12 seas from all oceans except the Indian Ocean. There are 1,777 underground water deposits in operation. The area of Arctic glaciers is 55,500 km2, while permafrost glaciers cover 11 million km2. More than 20% of the world's fresh water reserves are concentrated in Russia.
Water reserves in lakes and, moreover, groundwater play a significant role. Our country possesses substantial river runoff reserves.
However, in terms of water availability per unit area, Russia's runoff layer is almost twice as low as the global average. Nevertheless, the water issue in our country is not so much due to an overall shortage of water resources but rather due to the natural characteristics of the hydrosphere and the specifics of human activity.
The majority of Russia’s water resources (9/10) are concentrated in the basins of the Arctic and Pacific Oceans, where less than one-fifth of the country’s population resides. At the same time, most of Russia’s population and economic potential are concentrated in the basins of the Black, Caspian, and, to a lesser extent, Baltic Seas. These areas account for less than 10% of the country's river runoff, making the water resource deficit particularly evident in these regions.

The primary objective is to minimize or completely prevent the pollution of hydrosphere ecosystems.
To achieve this, both global and national-scale measures are implemented to reduce overall water consumption and wastewater discharge, along with individual efforts made at the household level.
At the national and global levels, solutions to hydrosphere pollution issues include:
- Implementation of advanced methods (waste-free technologies, recycling systems);
- Ensuring full wastewater treatment;
- Proper waste disposal.
Humanity cannot survive for more than three days without water. The entire animal and plant world on Earth's surface cannot exist without water. This is the defining characteristic of the importance of water resources for the existence of life on Earth.
The demand for water is increasing as the world's population, which has reached approximately 7.8 billion people (a 307% growth over the past seven decades), continues to rise. Four billion people face acute water shortages. More than one-third of the population (2.1 billion people) live in arid regions. However, the availability of water in lakes, rivers, and reservoirs has decreased due to climate change, with droughts becoming more frequent. Surface freshwater accounts for only ~0.296% of the total water supply in the hydrosphere.
The study of water resource distribution reveals opportunities for humanity to obtain water for drinking, agriculture, and industry, as well as to assess threats to water resources based on natural and atmospheric phenomena on Earth.
The expenditures on water resources in various countries show that critical situations are developing in North and South Africa, the Middle East, and India. Even in the USA, Western Europe, China, and Central Asia, the situation is not much better.
The study and solutions for overcoming critical water resource situations in the global community are carried out using remote sensing (RS) data and RS methodologies for two-thirds of all cases.
For example, the specialized satellite Surface Water and Ocean Topography (SWOT) provides direct assessments of global water resource changes on Earth. Researchers use remote sensing data to summarize recent advances in large-scale hydrological processes.
Established and well-tested remote sensing methods for water include satellite imagery in known spectral ranges, high-precision thematic aerial photography, and UAV (unmanned aerial vehicle) surveys. Additionally, new underwater autonomous vehicles are being introduced.
All water resources are conventionally divided into natural and artificially created by humans. Natural water resources include seas, oceans, rivers, lakes, swamps, glaciers, groundwater, and soil moisture. Artificial water resources consist of reservoirs, which are necessary for storing large volumes of water.
In Russia, the primary water fund is represented by a dense network of large and small rivers. Around 120,000 rivers flow through the country, with a total length of more than 2.3 million kilometers, contributing to 10% of the world's total river runoff. Russia has more than 2 million lakes and 100,000 swamps. Among the tens of thousands of reservoirs, 325 are the largest, with a total capacity of approximately 10 million cubic meters. The country is bordered by the waters of 12 seas from all the world's oceans except the Indian Ocean. There are 1,777 groundwater deposits in operation. The area of Arctic glaciers is 55.5 thousand square kilometers, while the permafrost glacier area is 11 million square kilometers. More than 20% of the world's freshwater reserves are concentrated in Russia.
The reserves of water in lakes and, additionally, groundwater are of great importance. Our country possesses significant river runoff reserves.
However, in terms of unit area, Russia's water availability is almost twice as low as the global average. Nevertheless, the issue of water in our country is not so much due to an overall shortage of water resources, but rather due to the natural characteristics of the hydrosphere objects and human activities.
The majority of Russia’s water resources (9/10) are concentrated in the basins of the Arctic and Pacific Oceans, where less than 1/5 of the country’s population resides. Meanwhile, most of Russia’s population and economic potential are concentrated in the basins of the Black, Caspian, and, to a lesser extent, Baltic Seas. These territories account for less than 10% of the country’s river runoff, making water shortages particularly pronounced in these regions.
The main objective is to minimize or completely prevent the pollution of hydrosphere ecosystems.
To achieve this, global and state-level measures are implemented to reduce overall water consumption and minimize wastewater discharge, along with actions taken by individuals at the household level.
On national and global levels, solving the problem of hydrosphere pollution includes:
- Implementing advanced methods (waste-free technologies, closed-loop water systems);
- Ensuring complete wastewater treatment;
- Proper waste disposal.
What Tasks Does Remote Sensing Solve?
Remote sensing data, combined with corresponding open global geodata, are used to create databases and enable consistent spatial analysis and assessment of the past and present conditions of major marine and river basins. These are the primary objectives and solutions for water resource assessment:
Using remote sensing data and specialized processing software, the following tasks can be solved:
- Inventory of reservoirs and other water bodies
- Hydrometeorological monitoring, evapotranspiration, hydrological modeling, land use change analysis, and water resource management; climate change and water scarcity; population growth and water shortages; spatiotemporal dynamics of water resource management.

Fig.5 Hydrometeorological Monitoring - Continuous monitoring of the condition of dams and other hydraulic and water protection structures.
- Assessment of the ecological state of water bodies, including identifying pollution caused by accidental discharges and spills of harmful substances, and detecting pollution sources.
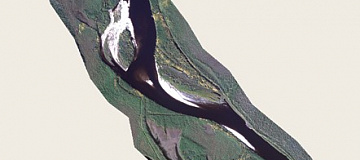
- Study of riverbed processes and mapping of microrelief on shallow waters.
- Flood prediction and operational monitoring, modeling of flood-induced inundation processes.
- Monitoring the condition of water protection zones, unauthorized construction of industrial and residential facilities within them.
- Resolution of legal disputes related to water use and violations of the Water Code.
- Determination of water bodies' biological productivity, identification of aquatic bioresources, solving fish farming challenges, and more.
- Water resource mapping, assessing evapotranspiration in specific areas and comparing its changes over several years. Creating maps showing precipitation distribution surfaces and snowmelt rhythms.
- Water resource audit.

Fig.6 Water Resource Audit - Runoff assessment based on terrain slope, precipitation levels in different areas, etc.
- Speed, direction, concentration, and duration of river or precipitation runoff.
- Groundwater flow rhythm, recharge patterns, and aquifer levels.
The application of GIS and both active and passive remote sensing methods addresses specific water resource-related themes, such as:
- Selection of dam construction sites.
- Monitoring spatiotemporal dynamics of water bodies.
- Time-series analysis and change detection.
- Multispectral, hyperspectral, thermal, and radar-based imaging systems for water surface monitoring.
- Soil moisture assessment.
- Research approaches to wetland analysis.
- Machine learning and deep learning techniques for water extraction and change detection.
- Underwater mapping and evaluation.
- Satellite-derived bathymetric mapping of shallow waters.
Advantages of Using Remote Sensing:
- Due to its temporal and spatial advantages, remote sensing technology is widely used to obtain data on water quality. With the advancement of hyperspectral sensors, unmanned aerial vehicles (UAVs), and artificial intelligence, significant progress has been made in retrieving water quality data through remote sensing, thanks to various available data sources and methodologies.
- Regardless of political boundaries, river basins serve as functional units of the Earth's surface, providing abundant resources for both the environment and human activities.
- The most urgent and effective measures are based on dynamic and accurate large-scale water quality monitoring.
- Geospatial analysis of the study area was performed using a digital elevation model (DEM) based on watershed delineation, land use and land cover (LULC) classification, monitoring site mapping, industrial cluster mapping, spatial data integration, and identification of polluting industries.
- Spatiotemporal analysis of freshwater dynamics in response to land use changes and climate change, using spatially accurate hydrological models and remote sensing data, can provide critical information for water resource management, event impact assessment, policy-making, and decision-making processes.
- Earth observation data, when integrated with in-situ (local) measurements, can significantly contribute to the creation of surface water resource cadastres, thematic maps relevant for hydrogeological studies, and models (soil-vegetation cover, surface geology, lineaments, geomorphology). They can also provide (bio)geophysical parameters (water quality and temperature, soil moisture) for deeper analysis.
- The repeatability of observations allows for the creation of time-series datasets of observed parameters, enhancing capabilities for analysis, monitoring, and forecasting the evolution of phenomena, thus facilitating water resource management.
- Synthetic aperture radar (SAR), as a microwave sensor capable of detecting water depth in all weather conditions, day or night, plays a crucial role in identifying water resources such as coastlines, lakes, and rivers.
")
- Urban river pollution is considered an "inevitable evil," a consequence of disproportionate urban expansion. Unprecedented urban sprawl and anthropic activities, among other factors, lead to contamination of urban rivers by municipal and industrial wastewater. Urban rivers are deteriorating while awaiting remediation, despite the efforts of city authorities, primarily due to a lack of coordination between river authorities and stakeholders, conflicts at various levels, governance pluralism, lack of reliable technical data, and financial constraints.
- GIS serves as a reliable tool due to its ability to process and analyze vast amounts of water resource data from various sources.
- Photogrammetry offers a wide range of applications with both quantitative and qualitative information on water resources. Data collection requires minimal time and is independent of weather conditions. However, photogrammetry depends on geodetic measurements and field surveys, requiring skilled surveyors and hydrographers to conduct fieldwork and interpret results.
Examples of Application
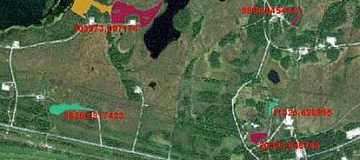
Use of Digital Technologies for Defining Fishing Ground Boundaries in the Water Bodies of Khanty-Mansi Autonomous Okrug – Yugra
Objective: Develop recommendations for the use of digital topographic maps and remote sensing data in determining the boundaries of fishing grounds in the water bodies of fishery significance in the Khanty-Mansi Autonomous Okrug – Yugra. Utilize the Territorial Information System of the Khanty-Mansi Autonomous Okrug – Yugra as a digital platform for managing established fishing ground boundaries. Conduct an audit of water bodies for their potential inclusion in commercial fishing and aquaculture.

Solution:
Collection and systematization of digital topographic maps and satellite imagery for the Khanty-Mansi Autonomous Okrug – Yugra.
Establishment of reference points for fishing ground boundaries in the Khanty-Mansi Autonomous Okrug – Yugra. All boundary points were verified through spatial analysis.

Vector files in polygonal format were created for each district of the region. This approach minimized errors in defining fishing grounds, as each district was processed individually, unlike group processing in a general dataset. A vector file structure was developed.
The project was implemented using a specialized software package. The coordinate system used for the project was WGS84 UTM, minimizing distortions in direction, distance, and area. WGS84 is a global coordinate system covering the entire Earth's surface. UTM zones divide the planet into 60 zones of 6-degree longitude each, with the equator and prime meridian as reference points.

According to technical requirements, the digital map template had to include:
- Name of the fishing ground
- Name of the water body
- Area/length of the site
- Coordinates of the fishing ground points
- Scheme of the fishing ground (with marked points and boundaries) on a digital topographic map
- Scale
- Legend and symbols

A total of 753 water bodies in the Khanty-Mansi Autonomous Okrug – Yugra were vectorized. Each water body was categorized based on its potential for commercial fishing and aquaculture development.
A GIS project was created, containing all necessary layers as well as a digital topographic map from the Territorial Information System of Yugra, presented as a cartographic service.
Result:
During the research work on the use of digital technologies for defining fishing ground boundaries in the water bodies of the Khanty-Mansi Autonomous Okrug – Yugra, the following results were achieved:
- Fishing ground locations were identified on digital topographic maps, and fishing ground boundaries were defined for specific water bodies.
- Electronic templates of geographic maps displaying the fishing grounds of the Khanty-Mansi Autonomous Okrug – Yugra were created.
- A draft list of detailed information was prepared for inclusion in an agreement on information exchange between the Operator of the Territorial Information System of the Khanty-Mansi Autonomous Okrug – Yugra and the Department of Industry of the Khanty-Mansi Autonomous Okrug – Yugra concerning the transmission of fishing ground data.
- An electronic dataset was prepared for uploading fishing ground data into the Territorial Information System of the Khanty-Mansi Autonomous Okrug – Yugra.
- Recommendations were developed for the continued use of the Territorial Information System of the Khanty-Mansi Autonomous Okrug – Yugra as a digital platform for managing established fishing ground boundaries.
Preparation of Proposals for Determining Flood and Waterlogging Zones in the Chelyabinsk Region
Objective: Prepare proposals for defining the boundaries of flood and waterlogging zones in the Chelyabinsk region and compile data on these zones for entry into the Unified State Register of Real Estate. This is done to implement measures for preventing the negative impact of water and mitigating its consequences.
Solution: Based on very high-resolution satellite imagery, orthophotoplans at a scale of 1:10,000 were prepared. Reconnaissance field surveys were conducted, focusing on key locations starting from the village of Isakovo (point 1) in a clockwise direction.

The flood zone boundaries for areas adjacent to Lake Smolino were established based on a 1% probability water level flooding scenario. This follows the decree of the Government of the Russian Federation from April 18, 2014, No. 360, "On the determination of flood and waterlogging zone boundaries." The 1% probability level was mapped, taking into account the topography. The flood zone boundary for the area adjacent to Lake Smolino (including Lake Isakovo) was added to the situational plan.
")
The waterlogging zone boundary for the area adjacent to Lake Smolino (including Lake Isakovo) was also mapped onto the situational plan.
")
The methodology for this work included collecting, analyzing, and systematizing engineering-geological, hydrogeological, and hydrological survey materials. Based on these data, a hydrogeological model of the studied area was built using hydroisohypses—contour lines on a map that connect points of equal groundwater level. The movement of groundwater occurs along lines perpendicular to these hydroisohypses.
The model serves as a mathematical representation of the natural interaction between surface and groundwater.
The main modeling stages included:
- Schematization of natural conditions
- Model creation
- Solving the inverse problem (model verification)
- Solving the direct problem
- Interpretation of the calculation results
Result: Data on the hydrological study of water bodies, their usage, and flood and waterlogging conditions for the territory of Lake Smolino (including Lake Isakovo) in the Chelyabinsk and Kopeysk urban districts were provided. The work utilized materials from previous surveys identifying flood-prone areas (if available) and engineering-geological and hydrogeological survey data.
The results included:
- Description of the area based on reconnaissance survey results, with photo documentation.
- Situational plan of the territory adjacent to Lake Smolino (including Lake Isakovo), showing flood and waterlogging zone boundaries.
- Water level calculation for Lake Smolino during 1% probability flood events, along with the lake’s water balance analysis.
- Hydrogeological calculations of groundwater levels to determine the waterlogging zone boundaries.
- A map album (scale 1:10,000 or larger) displaying the flood and waterlogging zones, as well as residential and economic objects located within these zones.
- Data on the boundaries of flood and waterlogging zones for the area adjacent to Lake Smolino (including Lake Isakovo) in the Chelyabinsk and Kopeysk urban districts.
- Text and graphical descriptions of the flood and waterlogging zone boundaries, including a list of coordinates for characteristic boundary points, formatted according to the official coordinate system used for the national real estate cadastre.
Satellite-Based Surface Water Extent Determination: Methodology Overview
Objective: Study methods for water body delineation using optical and radar imagery.
Solution: Monitoring water bodies is essential. Remote sensing methods offer real-time capabilities, extensive coverage, and rich information, making them a revolutionary technical means for quickly obtaining water-related data. The study summarized existing commonly used methods for water body extraction from optical and radar imagery, including threshold methods, support vector machines, decision trees, object-oriented extraction, and deep learning, along with the advantages and disadvantages of each approach. These methods were applied to the Huai River Basin in China and Nam Co on the Qinghai-Tibet Plateau.
Result: The classification methods demonstrated that all the above-mentioned approaches produced reliable results. The threshold-based segmentation method, relying on the Normalized Difference Water Index (NDWI), proved to be the most reliable among them. There are various techniques for extracting water information from remote sensing data, such as thresholding and classification-based methods using optical imagery, thresholding and filtering methods using radar imagery, texture extraction techniques, and Digital Elevation Model (DEM)-based methods. Additionally, optical and radar remote sensing methods have complementary advantages that can be leveraged for improved water body mapping.

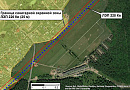
Risk Assessment of Dam Reservoir Breaches
Objective: Determine potential causes of dam failure through geodynamic monitoring using radar interferometry data.
Assess the feasibility of using interferometric processing of satellite images to predict accidents at hydraulic structures.
Forecast emergency situations for other operational hydropower facilities.
Solution:
- Analyzed the area before the dam breach (2017–2020). A ground displacement graph was obtained, showing a 90 mm shift over three years.
- Conducted post-repair displacement analysis of the dam (May 2020 – June 2022). The new displacement graph indicated movements of up to 30 mm over two years.
Result: The breach was preceded by critical ground displacement. After repairs, movements persisted but at lower magnitudes. The availability and operation of a space-based monitoring system for deformations and surface displacements, including dam stability assessment, can help prevent future dam failures.
Retrospective analysis using radar interferometry revealed dangerous displacements long before the dam breach, allowing for early identification of potential failure risks.
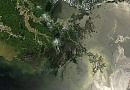
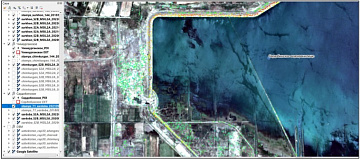
Environmental Monitoring of Oil Pollution on Marine Surfaces in the Bay
Objective: Detect, assess the volume, and analyze the movement of oil pollution near a marine port.
Solution: It was crucial not only to detect the pollution but also to assess its spread rate and drift across the marine surface. To achieve this, polluted areas were identified automatically on each satellite image.
Result: Based on Earth remote sensing data, vector and raster maps of oil pollution in the bay were compiled. Additionally, statistical data on pollution dynamics were provided. By utilizing the Automatic Identification System (AIS) data of ships, it was possible to identify the vessel responsible for the spill based on its movement history. A forensic analysis report was subsequently prepared using the obtained data.

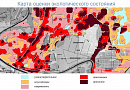
Review of Remote Sensing for Water Quality Monitoring:
Progress and Challenges
Objective: Water quality monitoring.
Solution: Water pollution has become one of the most serious problems threatening aquatic environments, water as a resource, and human health. The most urgent and effective measures depend on dynamic and accurate large-scale water quality monitoring. Due to their temporal and spatial advantages, remote sensing technologies are widely used for acquiring water quality data. With the development of hyperspectral sensors, unmanned aerial vehicles (UAVs), and artificial intelligence (AI), significant progress has been made in extracting water quality data using remote sensing. Traditionally, in situ measurements provide precise water quality parameters based on specific sampling points, but they are time-consuming, labor-intensive, costly, and limit large-scale monitoring.
Thanks to the spatial and temporal coverage advantages, remote sensing technology has been used to reflect the spatial distribution and dynamic changes of water quality components. Specifically, certain retrieval algorithms have been developed for multiple water quality variables, including total suspended solids (TSS), chlorophyll-a (Chl-a), colored dissolved organic matter (CDOM), chemical substances, organic matter, chemical oxygen demand (COD), total nitrogen (TN), and total phosphorus (TP).
Result: Pollution hotspots in water resources were localized.

Need for consultation?
Fill the form and we will contact you
Customers


FAQ
Licenses
Our partners


")


")

Sat-Sun: Non-working days