Search and Exploration for Mineral Deposits in Africa
Search and Exploration for Mineral Deposits in Africa
01
About the project
Testing Remote Sensing Methods for Locating Carbonate Minerals in the Eastern Province
Industry
Geology and mining
End date
02/26/2021
02
Project goal
Testing of remote sensing methods for locating carbonate minerals in the Eastern Province.
03
Completed works
Insufficient exploration and assessment of mineral resources are among the main barriers to the social and economic development of countries.
For example, Zambia primarily produces minerals such as copper and cobalt. Zambia’s copper deposits are gradually being depleted and closed. The poor condition of mines and the risk of collapse force major deposits to shut down, resulting in substantial losses for the national economy. The Kabwe lead-zinc mines and the Luanshya copper mines ceased operations in the 1990s–2000s, respectively, due to high recapitalization requirements. To support Zambia’s social and economic growth, it is necessary to explore and develop new mineral deposits. One of the main factors hindering socio-economic development is the concentration on a single mineral commodity as the primary source of revenue, while other potentially valuable resources receive less attention.
Since the 1920s, an important driver of Zambia’s mining industry has been mineral extraction in the Copperbelt, located in Central Africa, in northern Zambia and the southern part of the Democratic Republic of the Congo.
Zambia ranks among the leading developing countries in terms of copper reserves. Its main deposits are located within the Central African Copperbelt. Mining is focused mainly on industrial and metallic minerals, and to a lesser extent on energy resources. Within the Copperbelt, deposits of gold and polymetallic ores, muscovite, beryllium, and graphite have also been identified.
The extraction of industrial minerals in Zambia is only beginning to reveal its potential. Historically, the metallurgical industry has dominated, especially copper and cobalt mining.
The privatization of the copper-cobalt industry has stimulated construction and infrastructure development, which in turn has increased demand for industrial minerals.
Carbonate-group minerals occur throughout the country. Large deposits of dolomite and limestone are found near Lusaka Province, in the southern part of Central Province, and in Eastern Province. Eastern Province was selected for analysis.
STUDY AREA:
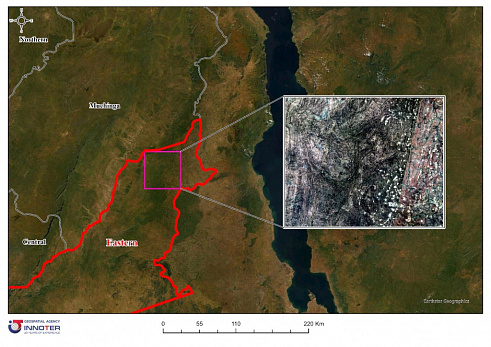
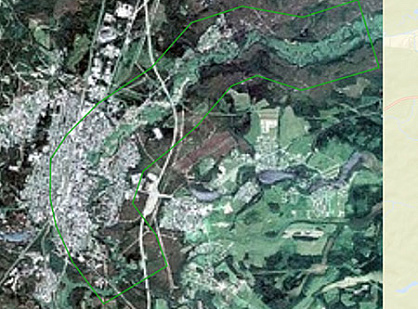
Lundazi, Eastern Province, Zambia. The study area covers 3,068 sq. km.
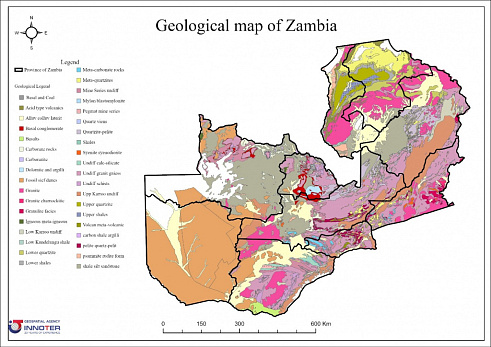
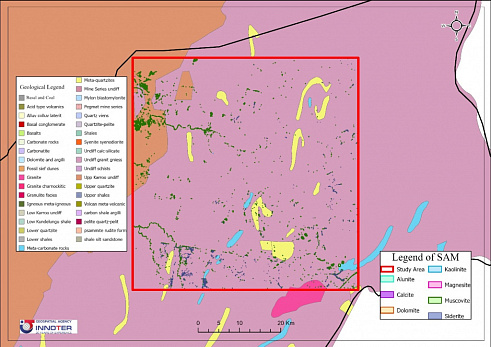
At the preparatory stage, all available geological maps covering Zambia were analyzed. Subsequently, a geological map at a scale of 1:2,000,000 was digitized (Fig. 1).
Figure 1. Geological map of Zambia
Publicly available ASTER satellite imagery was used for the initial analysis. An order covering the entire Eastern Province of Zambia was compiled and downloaded in batch mode (Fig. 2).
Figure 2. Study area
Each image underwent mandatory quality assessment and primary processing, including:
Radiometric correction
Geometric correction
Atmospheric correction
Subsequently, areas affected by shadows, snow, water, vegetation, and other objects were masked on each satellite image using various indices and deep machine learning algorithms.
Primary processing significantly reduced errors at each subsequent stage of analysis. A proprietary automated preprocessing algorithm made it possible to analyze the entire satellite imagery dataset automatically.
In this study, spectral analysis algorithms with different levels of reliability were used to localize large deposits of carbonate-, calcite-, and kaolinite-group minerals.
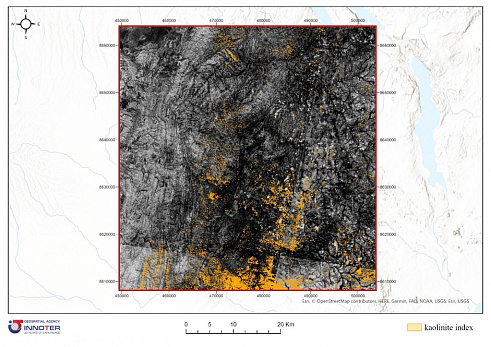
One of the spectral analysis methods used was the calculation of mineralogical (geological) indices. These indices make it possible to determine the probable distribution of key mineral groups. To develop a geological index, the absorption zones of the mineral group under investigation must be taken into account.
The following indices were calculated for the area of interest:
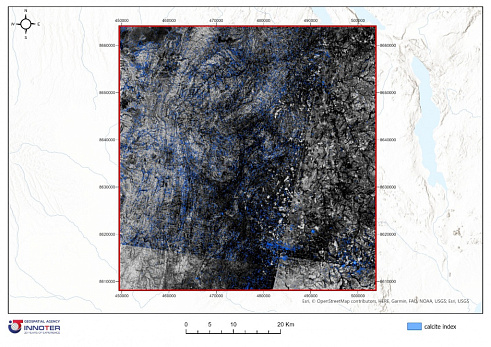
Calcite-group mineral index (Fig. 3)
Figure 3. Calculation of the kaolinite-group mineral index (the yellow area indicates the probable distribution zone of kaolinite)
Figure 4. Calcite index calculation (the blue area indicates the probable distribution zone of calcite)
At the next stage of analysis, the Spectral Angle Mapper method was used, which is an automated algorithm for comparing spectra. Spectral libraries or mineral spectra obtained during field surveys served as the source of spectral reference data. The advantage of this method is that it is insensitive to differences in solar illumination and compares the angular deviation between two spectral curves. The following minerals were analyzed:
Dolomite
Alunite
Muscovite
Calcite
Siderite
Magnesite
Kaolinite
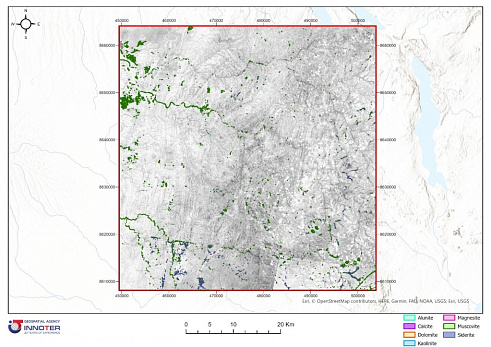
Figure 5. Integrated distribution map of the main indicator minerals associated with gold mineralization
CONCLUSION.
As a result of the work:
Distribution maps of indicator minerals associated with gold mineralization were prepared (Fig. 5);
The gold exploration area was reduced by 90% compared with the original territory (Fig. 6);
High-accuracy remote sensing base materials, including single-band and synthesized products, as well as orthophotos, were prepared.
The results obtained can contribute to the expansion of Zambia’s mineral resource base, which may have a positive effect on the country’s economy and increase the investment attractiveness of the region.
Primary processing of satellite imagery using the developed automated method
Application and development of mineralogical indices for the area of interest
Mineral localization using the Spectral Angle Mapper method
The spectral analysis methods used — geological indices and the Spectral Angle Mapper method — proved effective for mineral exploration and made it possible to identify new ore-prospective zones (Fig. 6).
Figure 6. Integrated distribution map of the main indicator minerals associated with gold mineralization
Geological map of Zambia.jpg
Study area.jpg
Calculation of the kaolinite-group mineral index.jpg
Need satellite imagery or help choosing the right data?
Describe your task, area of interest, and desired outcome. We will check data
availability, assess new acquisition options, and propose the optimal solution in terms of timelines, cost,
and quality.
Fast feedback during business hours
We will select the best data for your task
Confidentiality guaranteed
Discuss the project
clients who trust us
25+ years in the geodata market
Мы используем Яндекс.Метрика и собственные Сookies для обеспечения наилучшего
опыта работы на нашем сайте, персонализации сайта для наших пользователей и аналитики.
Продолжая использовать сайт вы соглашаетесь с условиями
Пользовательского соглашения.
Request a call
Leave your contact details — we will get back to you during business hours, clarify the task and suggest suitable data or services.
Write to e-mail
Send a message, technical specification or task description. We will review your request and reply to the specified e-mail.
Fill in the order form
Describe the area, object and imagery requirements. We will check archive availability, the possibility of a new acquisition and offer a suitable option.