



Crop maps and NDVI: areas, crop condition, moisture and pests from archive or new survey.
Search the site
What the service is used for
Classification and cadastre
Land suitability classification and inventory of agricultural parcels (cadastre).
Soil conservation and land use
Soil resource conservation, land assessment and land-use planning.
Natural disasters
Floods, droughts, fires, landslides: risk and loss assessment from aerospace data.
Precision agriculture
Smart farming and data collection: soil, biomass, growth stage and farmland management.
Plant protection
Control of pests, diseases, weeds and invasive species from satellite imagery and UAV.
Need field monitoring?
Describe the farmland outlines and the task. A specialist will select the RS archive and thematic map composition.
Solutions and materials for agriculture
01
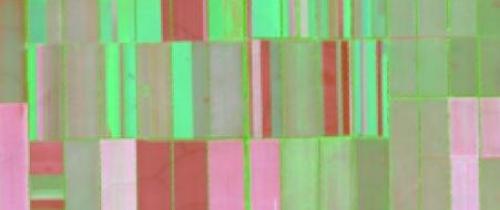
Assessment of sown areas
Mapping of cultivated areas from aerial and satellite data for area analysis and disaster-risk assessment.
One of the main RS applications in agriculture is the assessment of sown areas. Sensor data provide analysis of cultivated territories and help assess the risk if a disaster or catastrophe is to occur.
What you get
- sown-area maps from satellite and aerial survey
- field contours for cadastre and inventory
- a basis for risk assessment in natural disasters
The map set and survey dates are fixed in the terms of reference; archive availability and cloud cover affect coverage.
02
NDVI index
Assessment of vegetation dynamics and crop health from the spectral bands of a satellite image.
NDVI correlates with green biomass and helps understand crop phenology and its link to weather and the season. Red-Edge and infrared channels detect damaged crops earlier than RGB.
What you get
- NDVI maps and vegetation dynamics for the selected period
- an assessment of crop health from green biomass
- if agreed — analysis of Red-Edge and infrared channels
The channel set depends on the sensor and archive; cloud cover and the survey date affect the index calculation.
03
Precision agriculture
Soil and vegetation-cover monitoring: organic matter, texture, pH, moisture, biomass and growth stage.
RS technology provides vegetation-cover health, yield, vegetation density and the link between productivity and soil condition. For this the source mentions machine learning, neural networks, GPS/GLONASS and the Internet of Things.
What you get
- crop-condition and soil-parameter layers according to the agreed ToR
- an assessment of biomass, vegetation density and growth stage
- a basis for optimising crop-production management
The set of soil and crop parameters depends on the sensors, resolution and field verification.
04
Water and irrigation
Monitoring of water bodies, irrigated arable land, soil moisture and waterlogging-risk zones.
Remote sensing provides information on agricultural water resources at different scales. Thermal sensors and LWIR help optimise irrigation and identify areas that emit heat because of poor water-supply systems.
What you get
- an assessment of water bodies, irrigated land and soil moisture
- delineation of waterlogging-risk zones under excess precipitation
- if agreed — analysis of thermal channels for irrigation systems
Thermal and infrared channels are not available on all platforms; the survey composition is agreed in the ToR.
05
Pests and risks
Early detection of pest and weed infestation; flood-zone maps from archive and current imagery.
For detailed threats the source specifies a shift from satellite imagery to UAV and field verification. Risk maps are prepared from historical and current sensor data — regions with a high hazard rating are not planted without protection.
What you get
- early detection of pest and weed foci
- maps of zones with a high flooding probability
- if agreed — UAV survey and field verification
Satellite imagery does not replace field verification of foci; the survey-level set is fixed in the ToR.
How the work goes
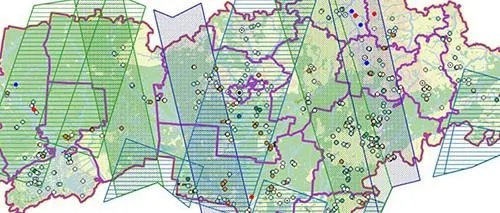
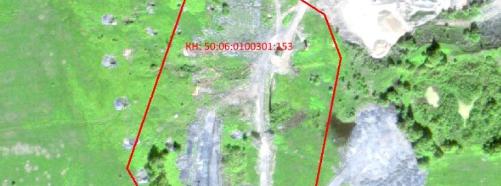
Real projects — real results
We solve complex challenges using advanced technologies and expertise in geospatial data.



Cost and timeline
The cost and timeline of agricultural land monitoring depend on the field area, survey type and the set of maps.
- farmland area and the task: field cadastre, NDVI, pests, irrigation, soil or natural disasters
- data type: satellite imagery, UAV, field verification; archive or new survey
- observation period: operational control or mapping over decades (LULC)
- in the source’s advantages, images are ready within a few days after the request — this is a survey-timeliness benchmark, not a normative Innoter order timeline
- figures of 9,7 billion people by 2050, 4% of world GDP (2018), a 2–4-fold rise in incomes of the poor and 65% of poor working adults in agriculture (2021) — industry context, not the service price
The cost of the work is calculated individually
Timelines depend on the area, survey type and product composition
The final estimate is agreed after the fields and the map set are described
What is needed for a quote
To agree the ToR for agricultural land monitoring, provide:
- task: field inventory, NDVI, pests, irrigation, soils, cadastre or natural disasters
- area of interest — field outlines, a farm, a district or a shapefile
- period: operational control, a season or a multi-year retrospective (LULC)
- whether you have your own images or need archival / new satellite imagery and UAV survey
- whether soil-composition maps, fire monitoring, land-use statistics are needed
- requirements for the format of maps and layers, if they are already known
If survey parameters have not been set yet, describing the farmland and the goal is enough — specialists will propose the RS data composition.
Describe the field outlines and the task — we will clarify the archive, a new survey and the set of maps.
Why Innoter
Prompt access to archives
Suitable archive imagery can be obtained faster when the required area and date are already available from operators.
No aviation clearances
A new satellite survey does not require the flight clearances typical of aerial surveys.
Large and remote areas
A single satellite pass covers large areas and makes it possible to work in hard-to-reach regions.
Direct agreements with operators
Distribution agreements help select archive imagery and order new surveys from different providers.
Software and server infrastructure
Modern software and computing capacity for quality control and processing of large data volumes.
Experienced specialist team
Years of experience on complex projects and specialists in cartography, photogrammetry and remote sensing.
RS data, NDVI and monitoring composition
The composition depends on field area, archive or new survey, space or UAV, and map requirements.
1
Agriculture is named in the card as the main industry: infrastructure is heterogeneous — from household plots to agroholdings — and depends on climate. The main problems are concentrated on water, drought, weather, pests and soil fertility.
In the source, development of the industry is named as a tool against extreme poverty: growth in agriculture is two–four times more effective for the incomes of the poorest strata than in other sectors. Analyses of 2021: 65% of poor working adults earn their living from agriculture. In 2018 the industry accounted for 4% of world GDP, in some of the least developed countries — more than 25%. Population forecast — 9,7 billion people by 2050.
The target RS customer in the text is Russia (the Volga Federal District, the North, the Far East), Asia (India, Cambodia, Indonesia, Vietnam), African countries; separately — water resources of Arab countries, Algeria, Morocco, Tunisia. The RS process is based on aerospace data over a period using LULC technology for crop and yield analysis.
2
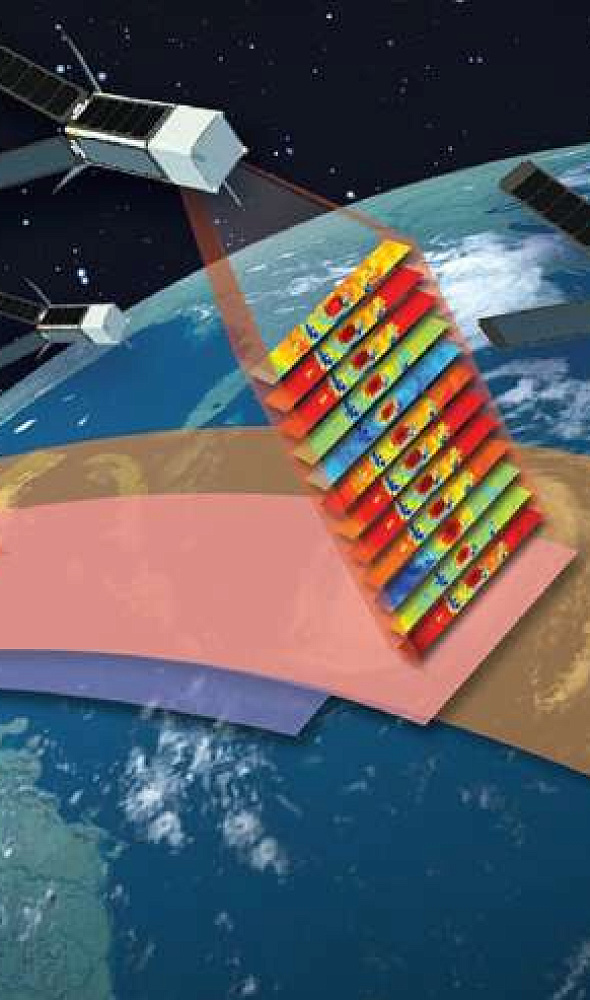
Satellite images cover a vast area and help check crop condition. UAV data is used to measure chlorophyll level and identify nutrient deficiency or a plant health problem.
Infrared sensors and Red-Edge in the NDVI model identify damaged crops. Thermal sensors help optimise irrigation. A long-wave infrared sensor (LWIR) shows regions that emit heat due to poor water supply systems. GPS from satellites provides an accurate location for self-driving agricultural machinery.
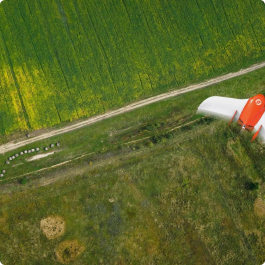
For pest and weed infestation the source indicates a transition from satellite imagery to UAV survey and field verification.
3
The card names as main topics: land suitability classification and plot inventory (cadastre); soil protection, land assessment and land-use planning; natural disasters (floods, droughts, fires, landslides); spatial digital farm management; precision and smart agriculture; production and monitoring of agroecosystems.
Next: plant protection, pests and diseases; weeds; invasive species; soil nutrients, fertility and fertilisers; livestock and pasture management; land mapping from monitoring data over decades.
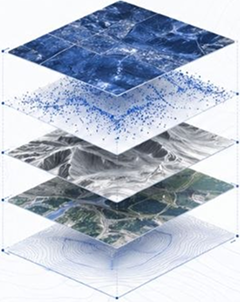
New sensors on Earth observation instruments, tractors and field devices collect multi-temporal and multispectral high-resolution data. GIS, GNSS and GPS, IoT, geostatistics, neural networks and AI, cloud services turn them into information for farmers and risk assessment.
4
The source lists the following directions: phenotyping for breeding and precision agriculture; UAV spectral imaging for crop diseases; biophysical parameters from RS data; crop coefficients and evapotranspiration; hyperspectral images; plant growth modelling from contactless images.
Also: deep and machine learning for crop monitoring; near-real-time monitoring; chlorophyll fluorescence and photochemical reflectance index; proximal sensing; digital production based on AI and robotics; synergy of aerospace images and AI; 3D modelling and mapping for precision agriculture.
5
In the advantages block of the card: timeliness — up-to-date photos from space are ready within a few days after the request is submitted; objectivity of aerospace information on soil and vegetation; simultaneity and periodicity of detailed-resolution survey by satellites and UAVs.
Uniformity: information comes from calibrated sensors, additional processing is not required. Coverage: modern satellites image areas and provide simultaneous observation in remote zones. Solving a large number of applied tasks in the agricultural sector is indicated separately.
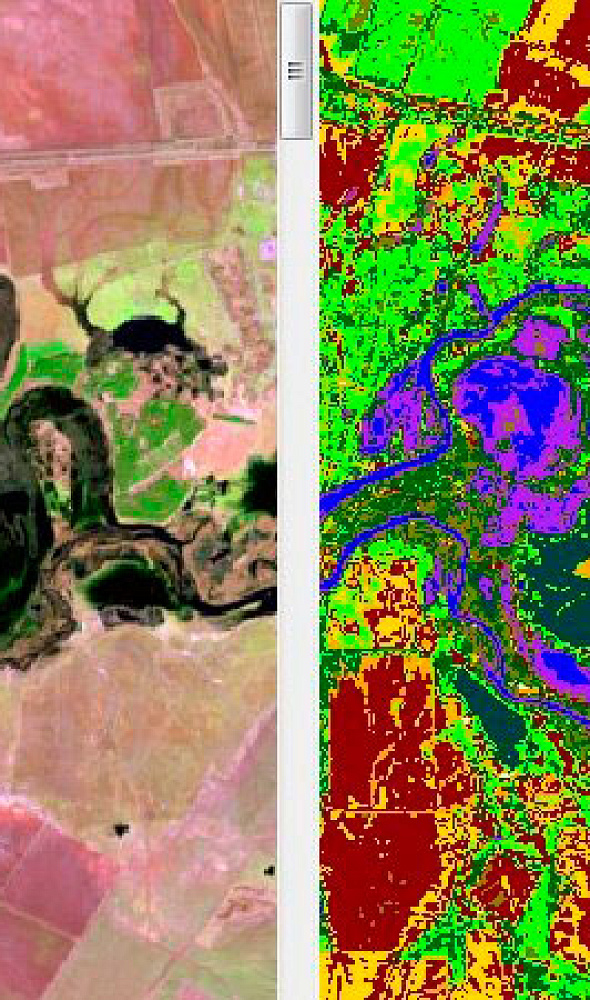
The text includes image examples: Kompsat-3A (Finney County, USA), Aist-2D (Stavropol Krai, 12.07.2018), QuickBird (field harvesting).
6
The FAQ describes the development of a system: a register of agricultural fields, maps of soil composition, fire monitoring, volumes of subsidies and financing. Stages: automated provision of satellite images; image processing for a statistical base, summary figures for Voronezh Region and thematic maps; operational statistical outputs; interpretation of land characteristics from images; an internet portal for user categories; operational decisions; forecasts.
Monitoring of agricultural land includes observation of crop-rotation fields, fertility parameters, vegetation cover on arable land, fallows, hayfields and pastures. Division of monitoring: by administrative-territorial feature, land categories, anthropogenic impact, user categories, intended purpose and land use.
Frequently asked questions
Answers to key questions about service parameters, timelines, deliverable formats and workflow. If you did not find what you need — contact us and we will help.
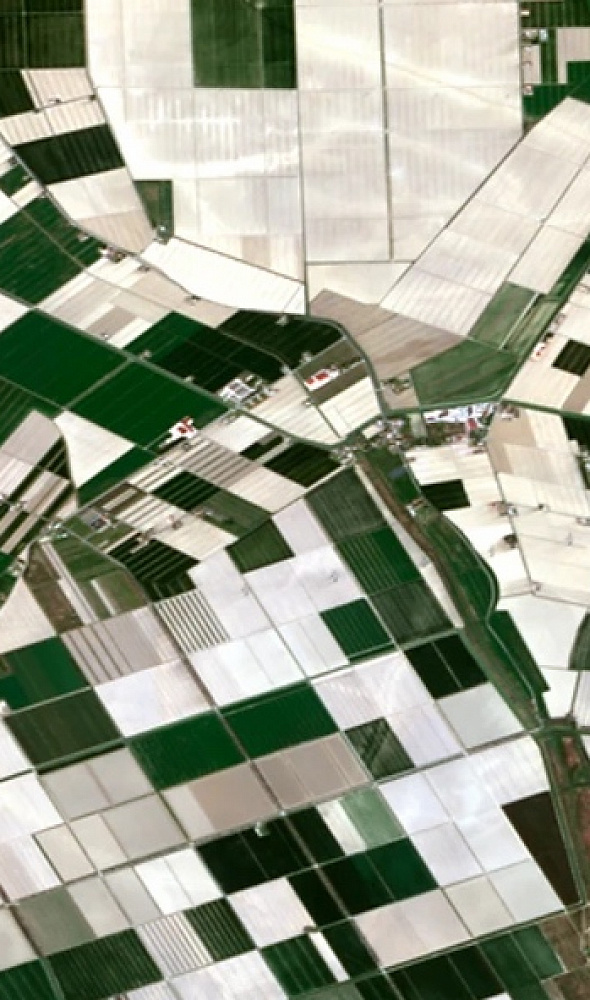
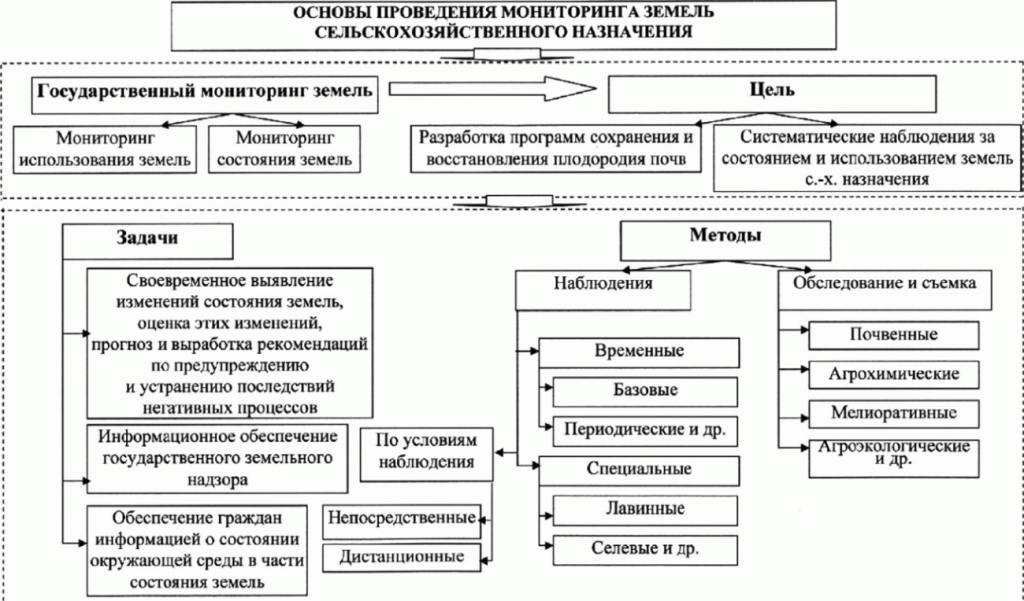
Agricultural land monitoring holds a special place in land monitoring. The use of land in agriculture has its own unique characteristics, the most important of which is its irreplaceability for food production.
Agricultural land monitoring is categorized as follows:
- By administrative and territorial division
- By land categories
- By anthropogenic impact
- By user categories
- By intended use
- By agricultural land utilization
Fundamentals of Agricultural Land Monitoring
In recent years, the land resource management authorities established in our country have failed to develop an effective resource management system and have lost control over land use and protection.
This is evidenced by the following factors: a decline in humus content, increased physical soil degradation processes. The soil is subject to degradation, losing its resistance to destruction and its ability to regenerate fertility.
Analyzing the multifaceted relationships emerging in land use processes indicates an unsatisfactory state of land monitoring. This explains the incomplete information regarding the size and forms of land ownership, the owners of land shares, the conditions of land leases, land tax amounts, and land cadastral valuation. Farms do not conduct a systematic analysis of land relations.
All of this negatively impacts land use, land management activities, the formation of an optimal land ownership and land use structure, and the enforcement of legally established measures against improper land use.
It is now evident that a modern land resource management system based on land monitoring is necessary.
Land monitoring can be defined as a system of observations over the state of land resources to promptly identify changes, assess them, predict trends, prevent negative processes, and mitigate their consequences.
Improving agricultural land monitoring aims to prevent agricultural land loss, preserve and incorporate it into agricultural production, and provide all land-use stakeholders with accurate information on the state and actual use of agricultural lands.
Agricultural land monitoring includes systematic observations of the condition and use of crop rotation fields, soil fertility parameters, and vegetation cover changes on arable land, fallow land, meadows, and pastures, among others.
Agricultural Field Registry
Stage 1: Automated provision of satellite imagery
Soil composition maps.
Stage 2: Automated processing of satellite imagery to create a statistical database
Fire monitoring.
Stage 3: Generation of real-time statistical reports
Information on subsidy and funding volumes.
- Stage 4: Interpretation of information for automated data utilization
- Stage 5: Development of an online portal for various user categories
- Stage 6: Decision-making process
- Stage 7: Forecast development
- Automated provision of satellite imagery;
- Automated processing of satellite imagery to generate intermediate products, forming the basis for statistical reports, aggregate figures for the Voronezh region, and thematic maps;
- Real-time statistical reporting and analytics;
- Interpretation of obtained data for automated use in a system that determines specific land characteristics based on satellite imagery;
- Development of an online portal for different user categories;
- Implementation of rapid decision-making processes;
- Forecasting and predictive analytics.
Thanks to this innovative development, agricultural management specialists, as well as agricultural producers and landowners, will be able to visualize crop development in a unified system and respond promptly to emerging issues.
Need satellite imagery or help choosing the right data?
Describe your task, area of interest, and desired outcome. We will check data
availability, assess new acquisition options, and propose the optimal solution in terms of timelines, cost,
and quality.
Discuss the project
clients who trust us
25+ years in the geodata market






