of geospatial solutions
Sat-Sun: Non-working days
Forest industry is an important sector of the economy in many countries. Russia holds a quarter of the world's timber reserves. As of 2015, the total forest area exceeded 885 million hectares, which constitutes 45% of the country's total area. The timber stock volume was approximately 82 billion cubic meters. However, the forest industry's contribution to Russia's GDP is only 2%.
One of the problems in the forest industry is tree diseases. Previously, assessing the state of the forest required field surveys and measurements. With advancements in technology, particularly in satellite Earth observation and geographic information systems (GIS), it has become possible to assess tree health using remote sensing.
Let's consider the application of machine learning in deciphering satellite imagery to assess the condition of palm trees on Tongan islands:
Coconuts and coconut products are significant exports in the economy of the Kingdom of Tonga. Thousands of palm trees grow on plantations (e.g., near Kolovai town). Conducting a comprehensive inventory of each of these trees would require substantial time and labor resources. To reduce the time spent on resource assessment, it is expedient to employ an alternative method for assessing tree health and location using remote sensing, with deep learning models.
To decipher objects, a satellite image with very high spatial resolution is required. The model can identify palms only if the pixel size is small enough to distinguish palm crowns. Additionally, to compute tree health status, a satellite image with spectral channels enabling vegetation health index calculation is needed. Four-channel satellite images from the WorldView-3 satellite with a spatial resolution of 30 cm are excellent for such tasks.
First, let's load the satellite image into ArcGIS:

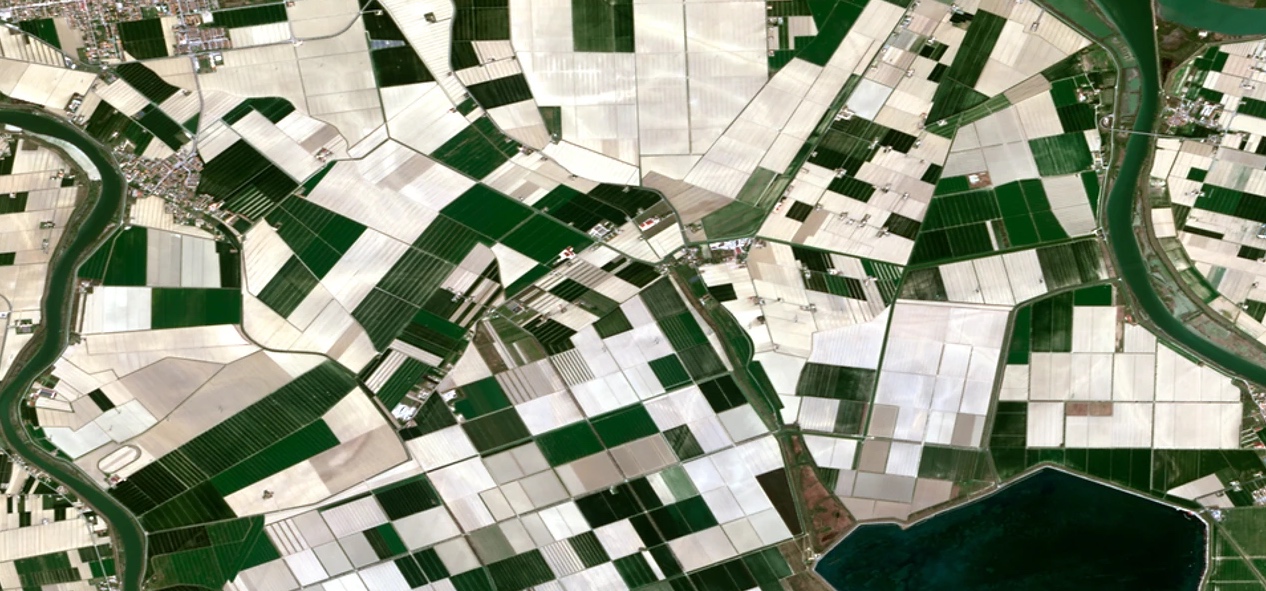
Fig.1 WorldView-3 satellite image loaded in ArcGIS software
The image shows a large number of coconut palms. Counting them on site or from the image would take several days. To delegate this task to a deep learning model, we need to create a model for further action steps in the algorithm.
Creating Training Samples
To populate a deep learning model or any image classification models, good training samples need to be created. Often, this is the most time-consuming step in the process. To provide the deep learning model with the information necessary to extract all palm trees in the image, objects need to be created from a number of palms to "explain" the model what size, shape, and spectral signature might correspond to this tree species.
To ensure a representative sample of trees in each area, trees should be digitized from the image using the "Training Manager" feature. These objects are recorded in the model in a format called "image chunks". Image chunks are small image blocks cut from the main image. Once a sufficient number of objects are created in the Training Manager, they need to be exported using the geoprocessing tool as image chunks with metadata.

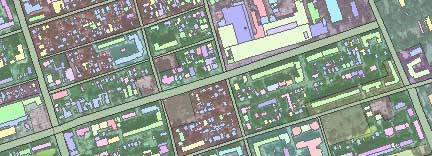
Fig.2 and 3 Creating a sample for training the model
About 100 digitized tree units are sufficient to train the model. Digitizing the training sample may take time, but it pays off with a large number of samples. The more examples you provide the model in training data, the more accurate the result will be.
Detecting Palm Trees Using Deep Learning Model
Deep learning tools in ArcGIS allow users to integrate the platform with an external deep learning modeling environment using a convolutional neural network. A similar set of deep learning tools in ArcGIS Pro enables training your data in an external deep learning model and then applying the model results for image classification.
After entering the sample criteria, you can start automatic decryption. The result will be a new vector layer indicating all identified palms (for best results, visual inspection is recommended):

Fig.4 Result of automatic decryption
Assessment of Vegetation Health
To obtain information about vegetation health, the Visible Atmospherically Resistant Index (VARI) needs to be computed, which was developed as an indirect indicator of Leaf Area Index (LAI) and Vegetation Fraction (VF) using only visible wavelength reflectance values:
(Rg - Rr) / (Rg + Rr - R(Rg - Rb))
where Rr, Rg, and Rb are reflectance values for the red, green, and blue channels respectively (Gitelson et al., 2002).
Calculating Visible Atmospherically Resistant Index (VARI)
To measure VARI, three raster channels (Red, Green, Blue) are required as input. To compute VARI, use the "Raster Calculator" tool. Raster functions work faster than geoprocessing tools as they do not create new sets of raster data. Instead, they perform real-time pixel analysis as you pan and zoom.
After using the "Raster Calculator" function, the VARI layer is added to the project. By panning and zooming the image, you can see shoreline objects, roads, buildings, and fields.
")
Fig.5 Result of computing Visible Atmospherically Resistant Index (VARI)
To determine which trees need attention, average VARI values for each individual tree need to be known. To find the average VARI value for each tree, convert the previously selected palms into a polygon layer. Then, extract the average VARI for each polygon (it will be in the attribute table):

Fig.6 Converting to a polygon layer
After setting up the layer display based on the VARI index classification, a map with object classes is obtained, showing the location, condition, and model confidence for each palm tree in the image.

Fig.7 Vegetation map with object classes: red denotes trees needing inspection; orange indicates deteriorating health; light green represents moderately healthy; green signifies healthy.
You can order from us


Sat-Sun: Non-working days